Is my line speed slow or fast? ``MySpeed'' review that allows you to test your internet connection speed every hour and record and analyze it for up to 30 days, open source that can be self-hosted on Windows or Linux
MySpeed is a tool that continuously measures and records your internet line speed. I actually tried using it to see what kind of app it is.
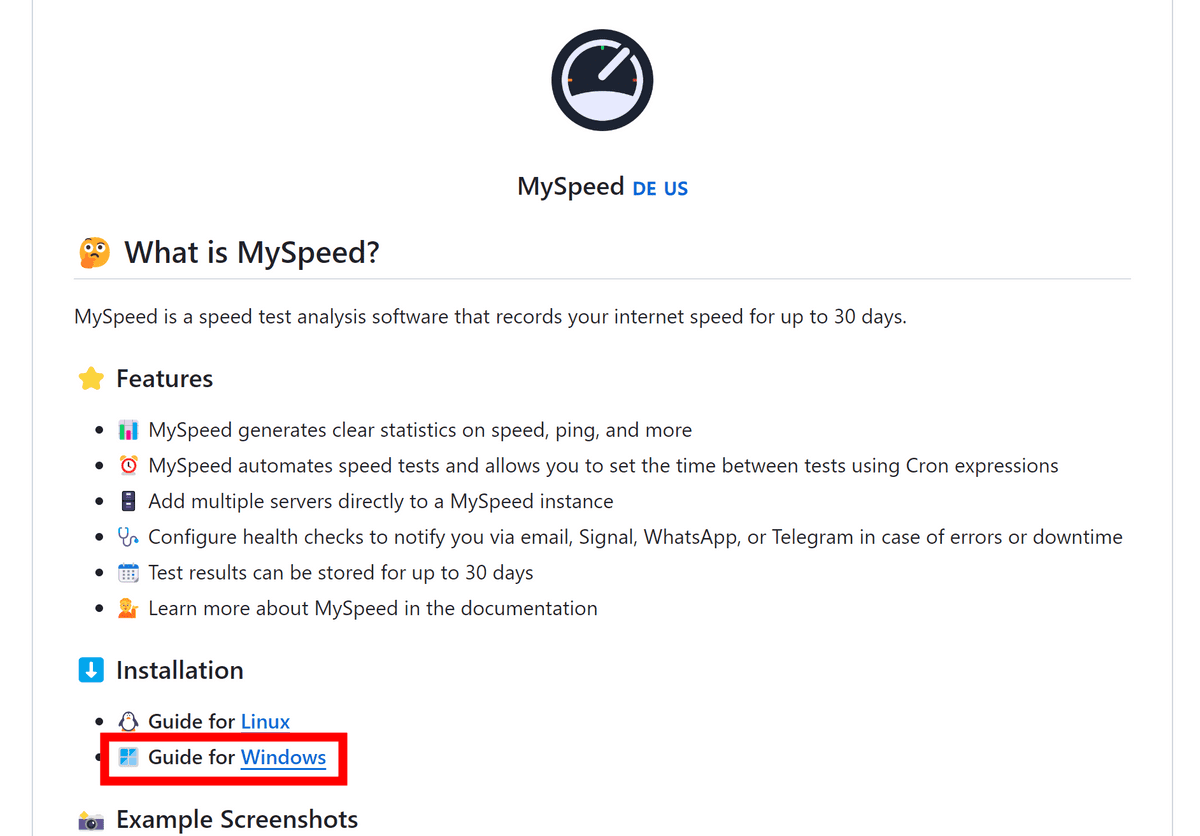
gnmyt/myspeed: A speed test analysis software that shows your internet speed for up to 30 days
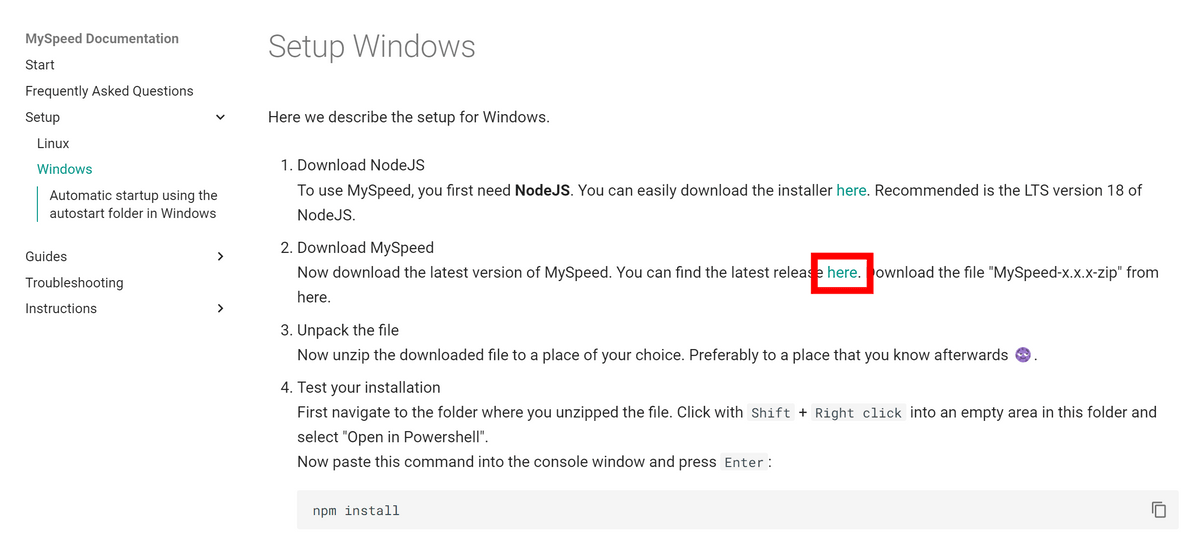
This time we will test the operation on Windows, so click 'Windows' in the 'Installation' item.
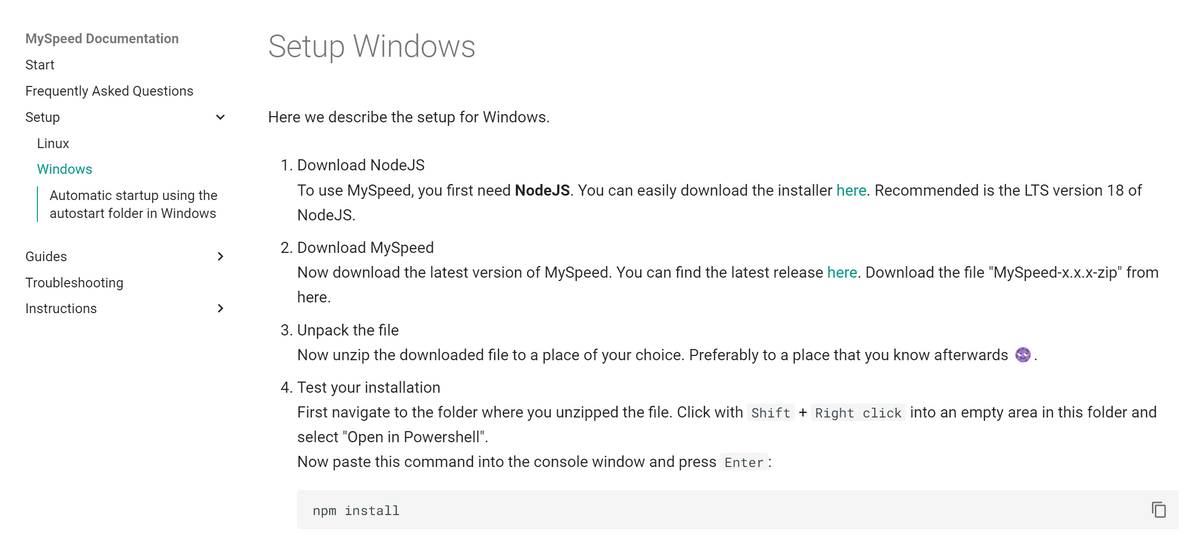
It is necessary to install Node.js first. Go to
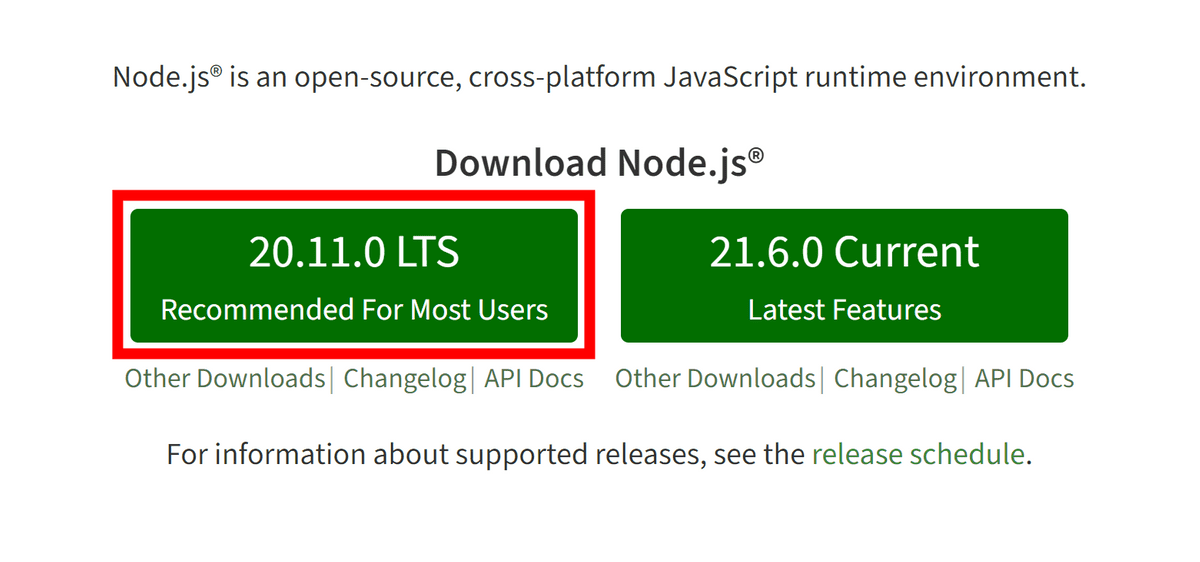
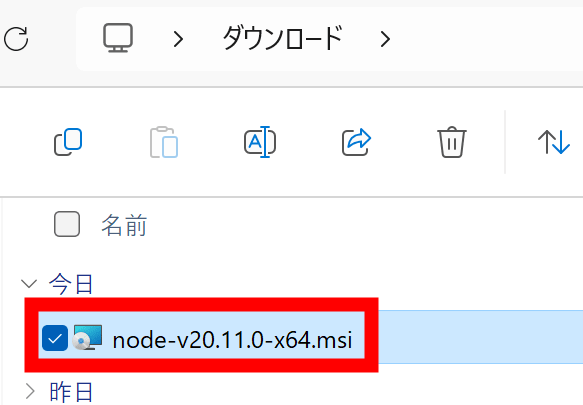
The executable file will be downloaded, so double-click to run it.
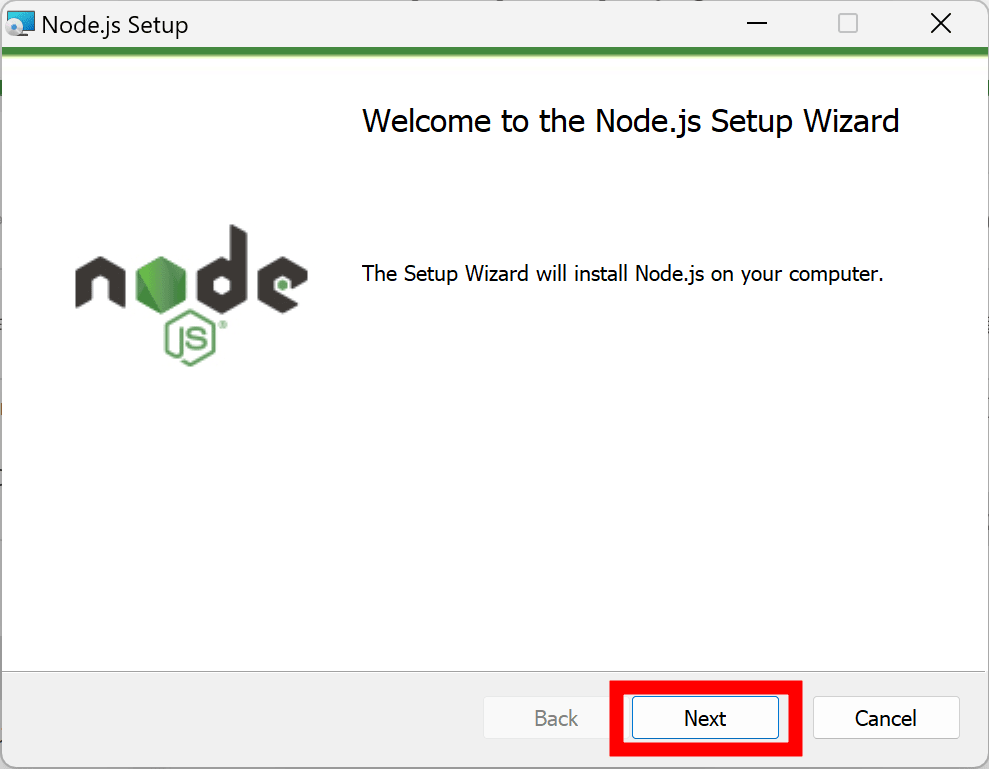
The setup wizard will start. Click 'Next'.
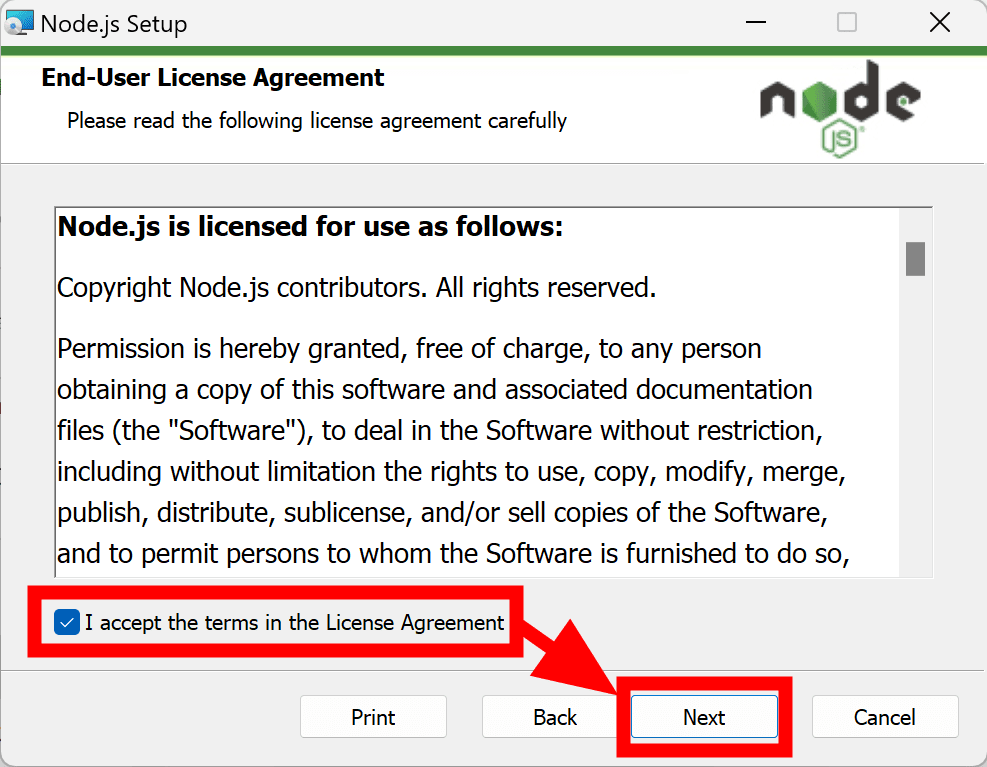
Click to add a check mark and click 'Next'.
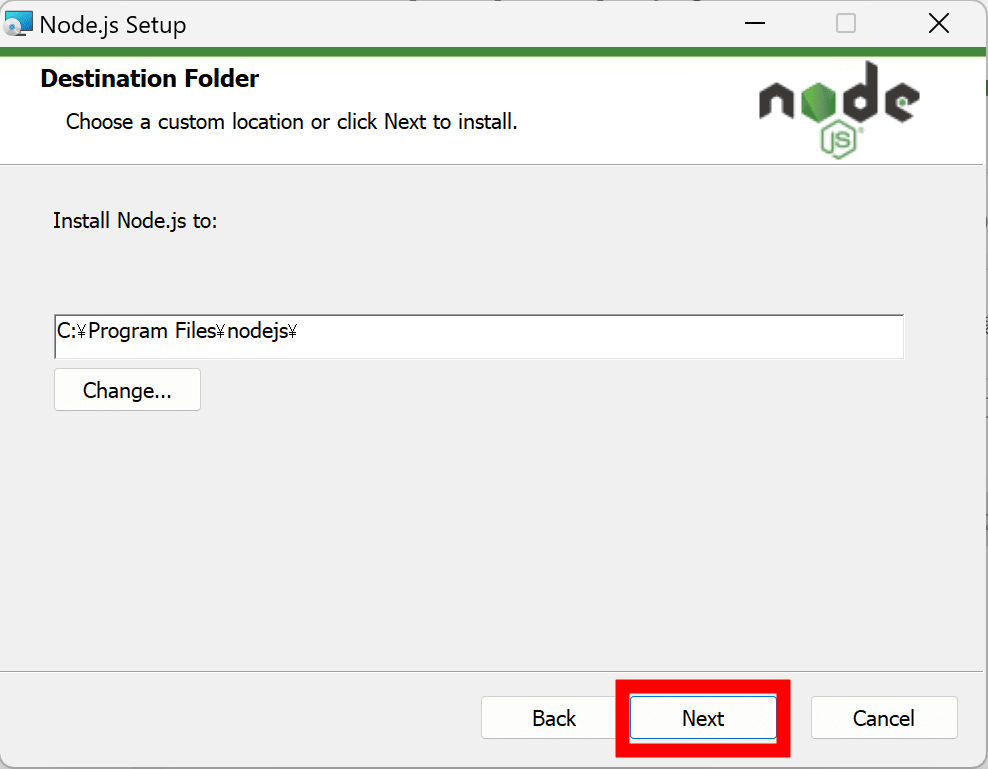
Click 'Next'.
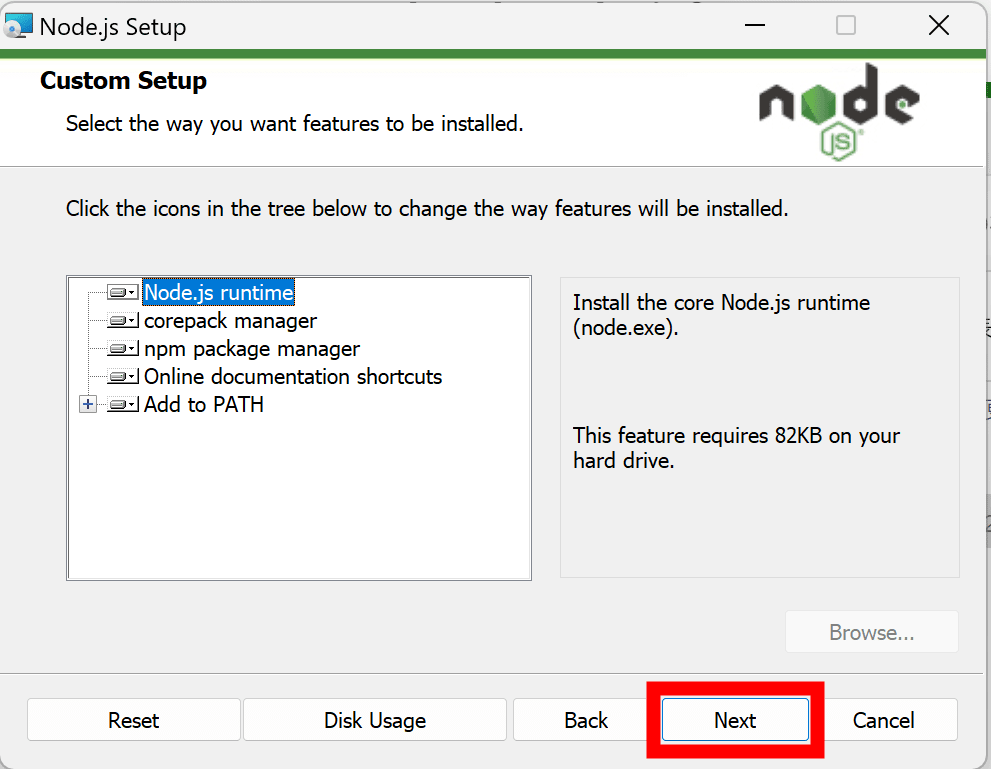
All components will be installed by default, so just click 'Next'.
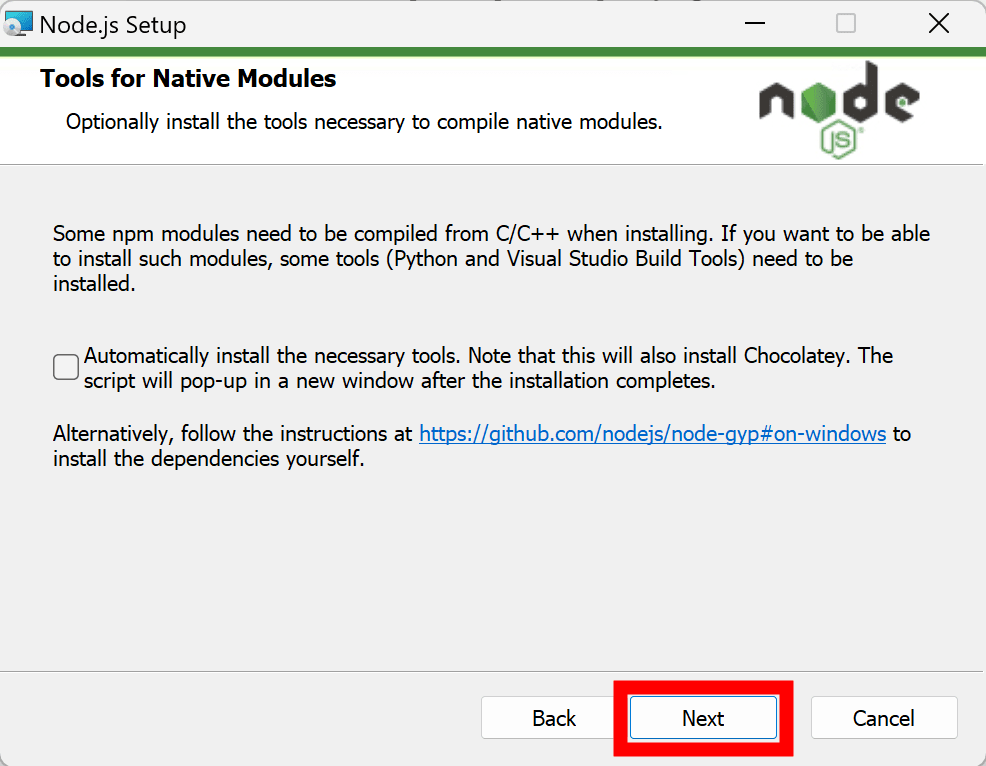
Some libraries compile from C or C++ source code when used, and you can also set whether to prepare the C or C++ compilation environment when installing Node.js. This time I will not be using any libraries that require compilation, so I clicked 'Next' without checking them.
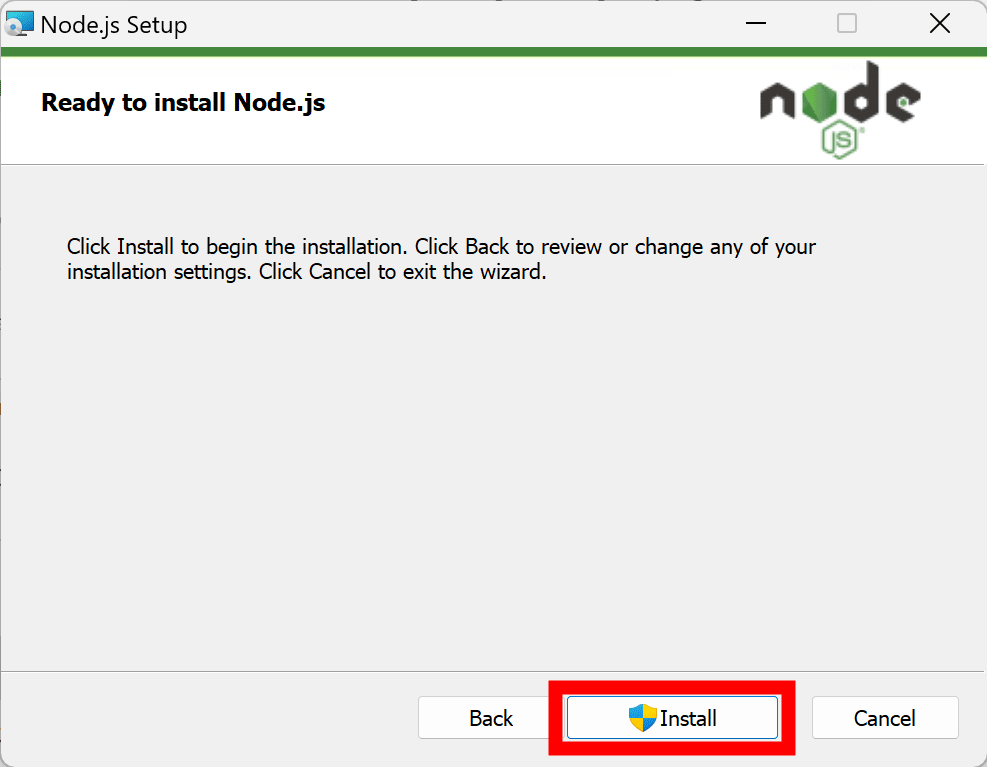
Click 'Install'.
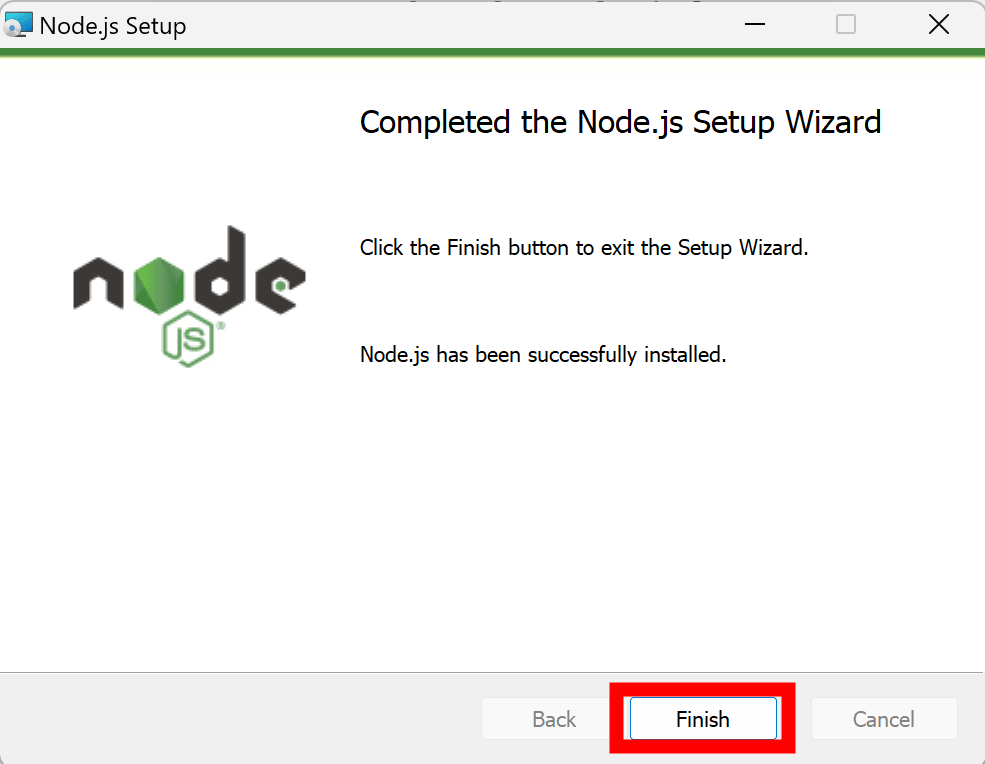
The installation of Node.js is now complete. Click Finish to exit the setup wizard.
Next, download MySpeed. Click '
You will be automatically redirected to
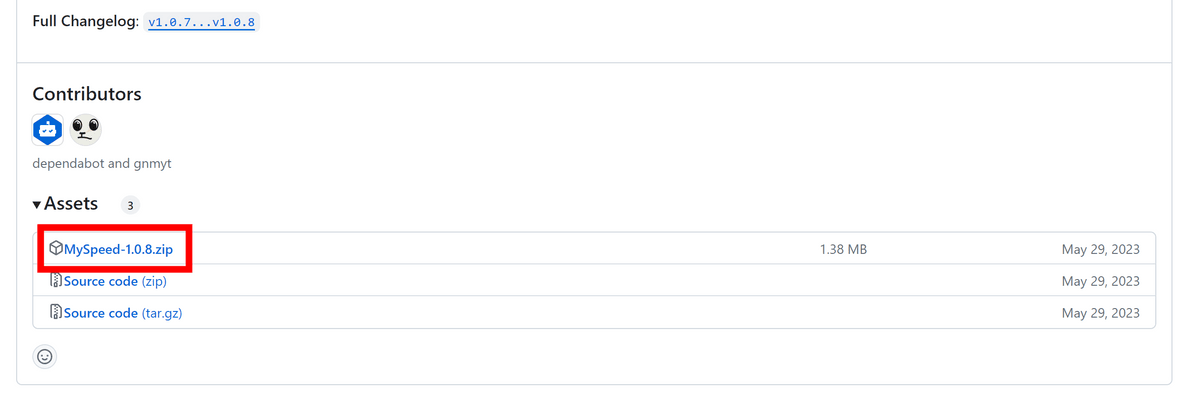
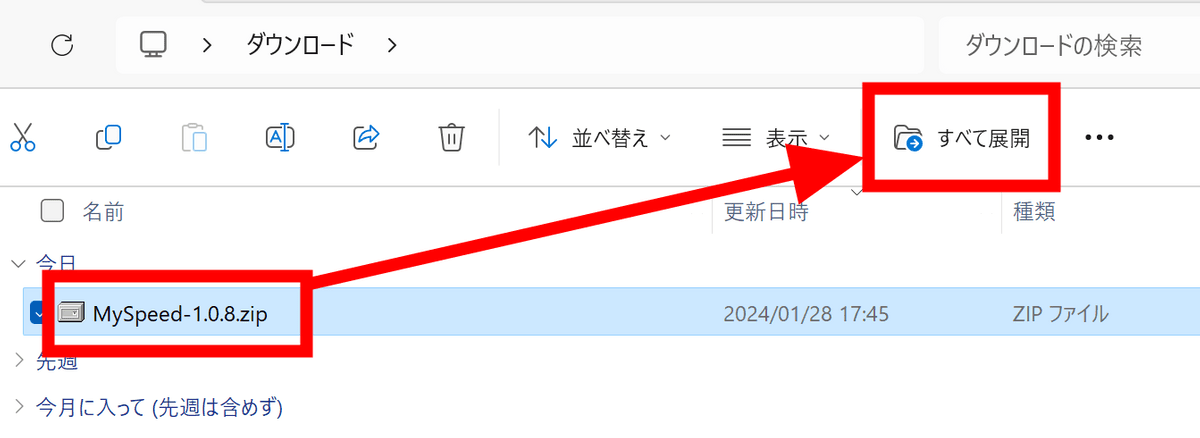
Select the downloaded file and click 'Extract all'.
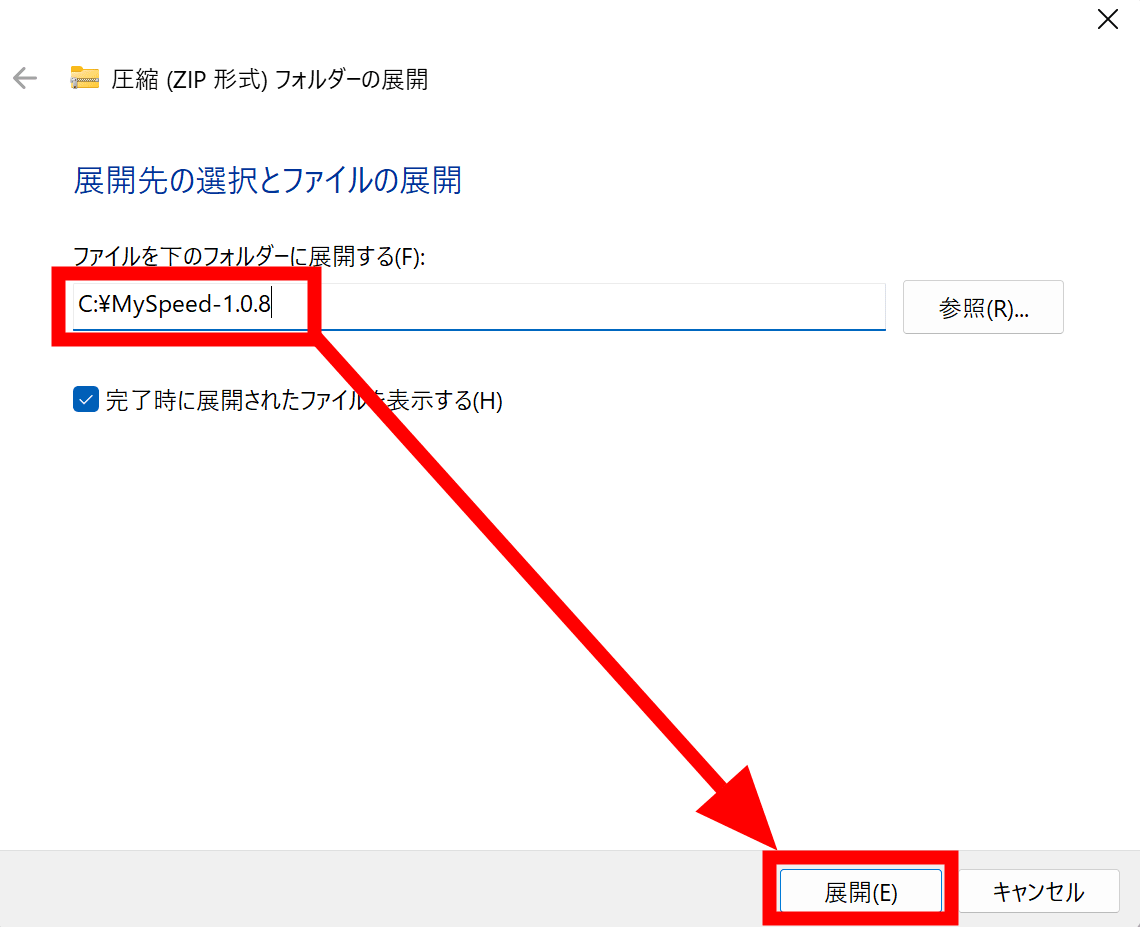
Select the destination folder and click Extract.
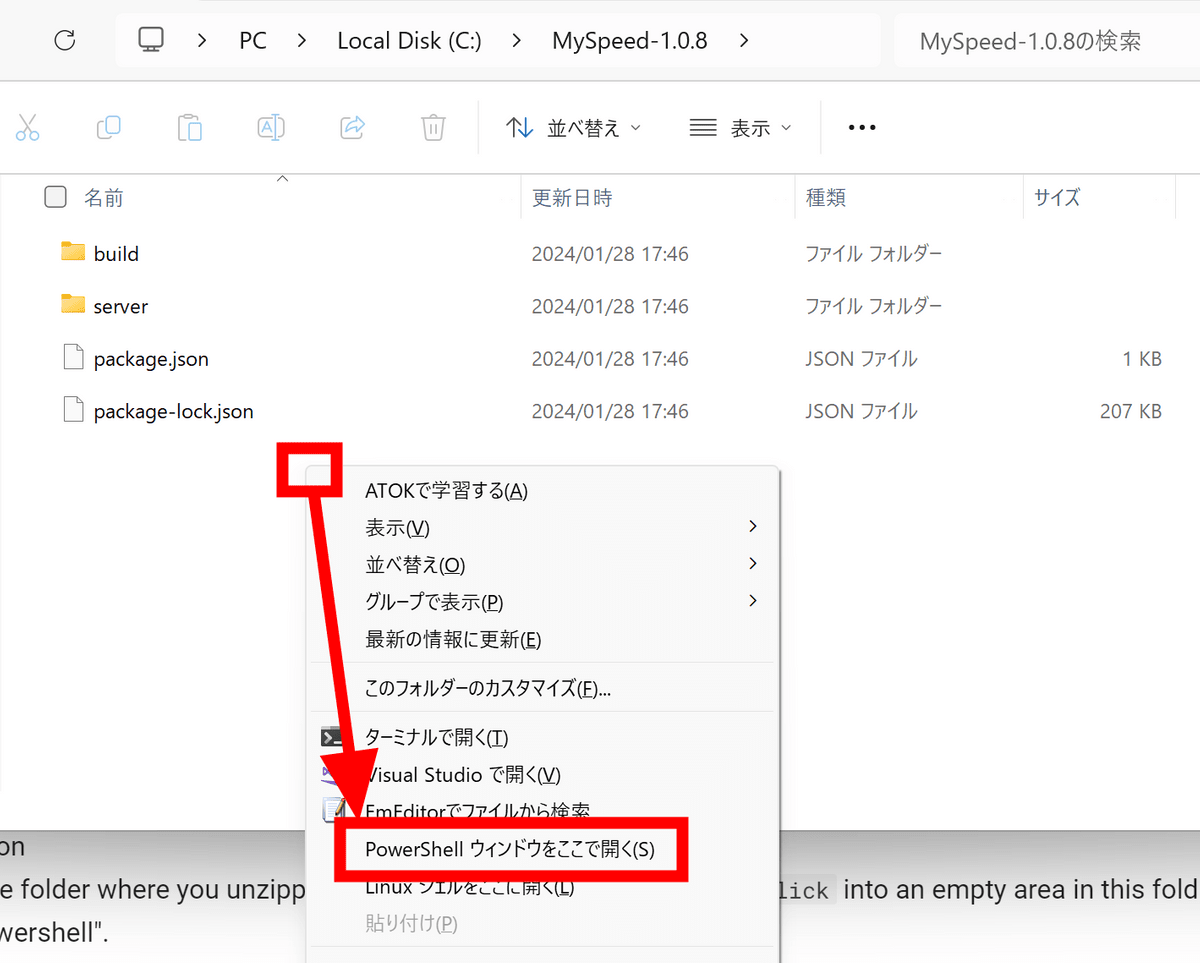
When the expanded file is displayed, 'Shift + right-click' on an empty area to display the menu, and click 'Open PowerShell window here'.
Type 'npm install' in PowerShell and press the enter key. The necessary libraries were installed in about a minute, and 'added 299 packages' was displayed.

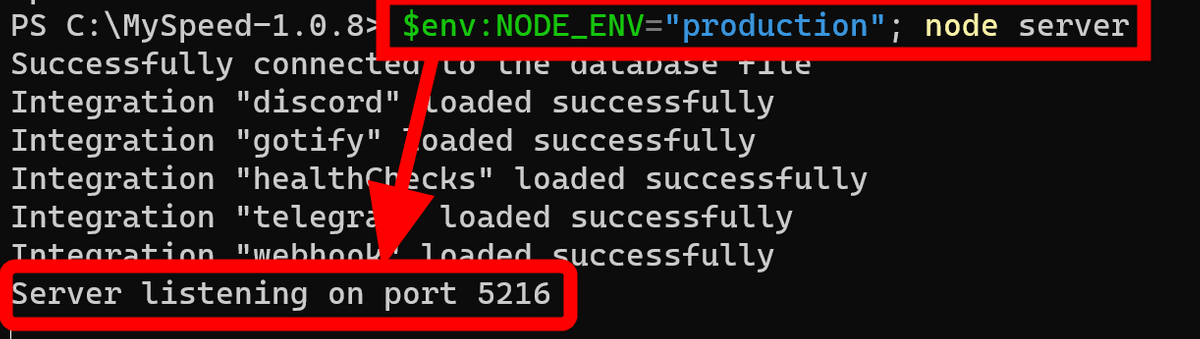
Next, enter '$env:NODE_ENV='production'; node server' to start MySpeed. If 'Server listening on port 5216' is displayed, startup is complete.
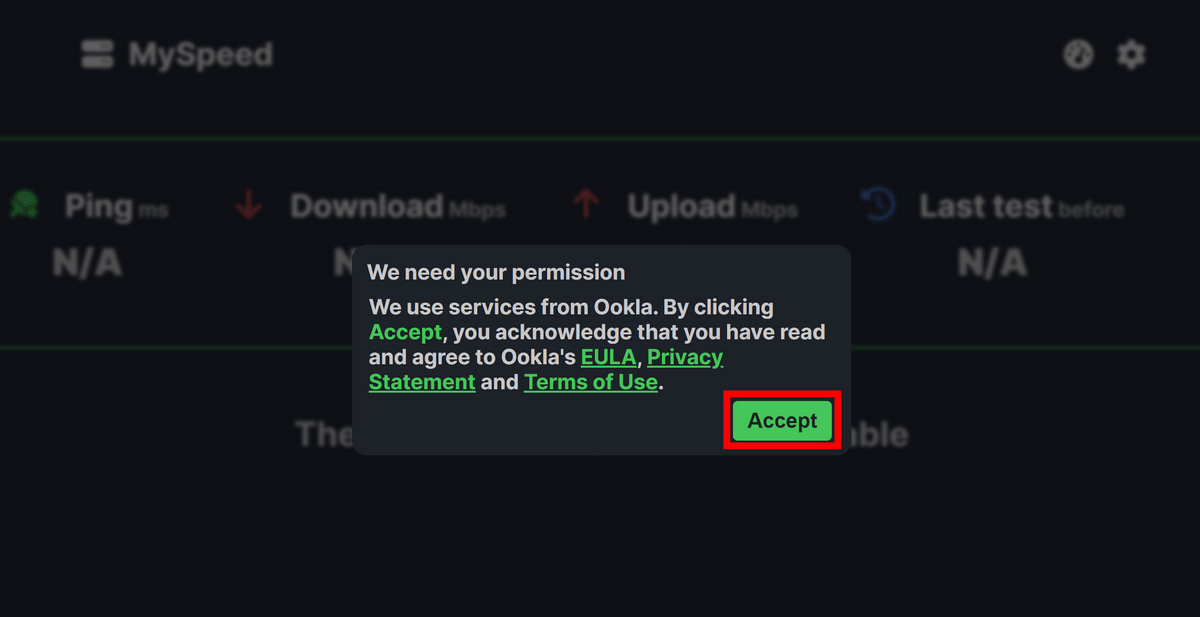
When you access 'http://localhost:5216', the MySpeed screen will be displayed. You will be asked to agree to the terms of use, so click 'Accept'.
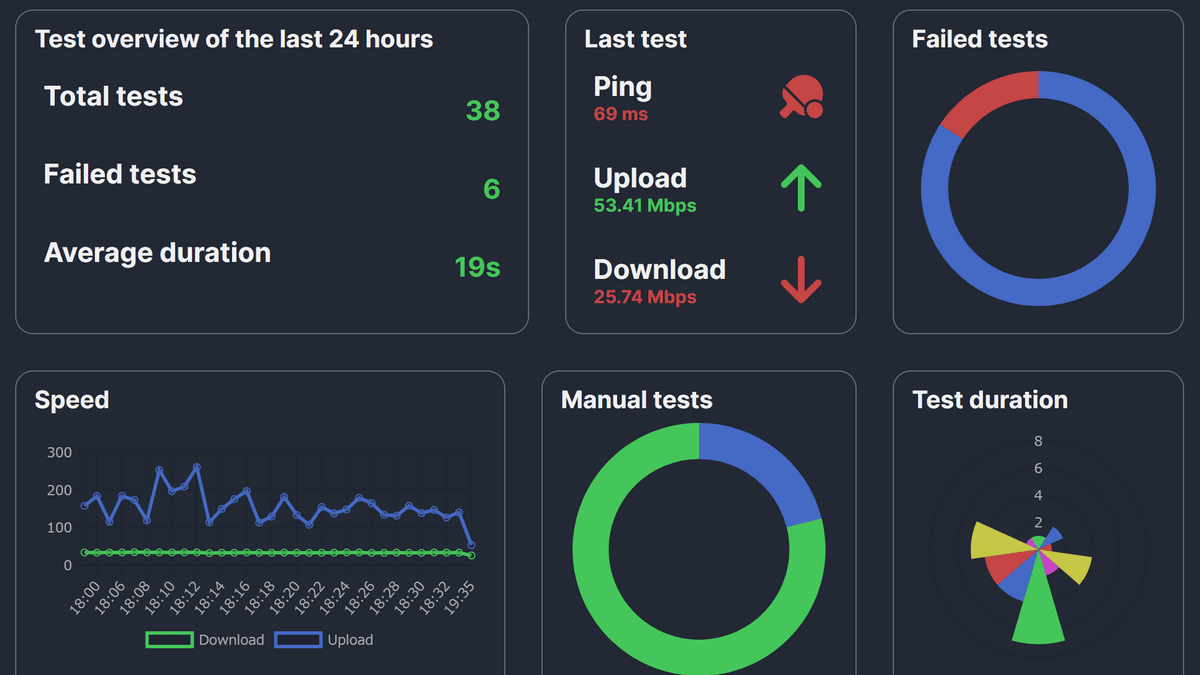
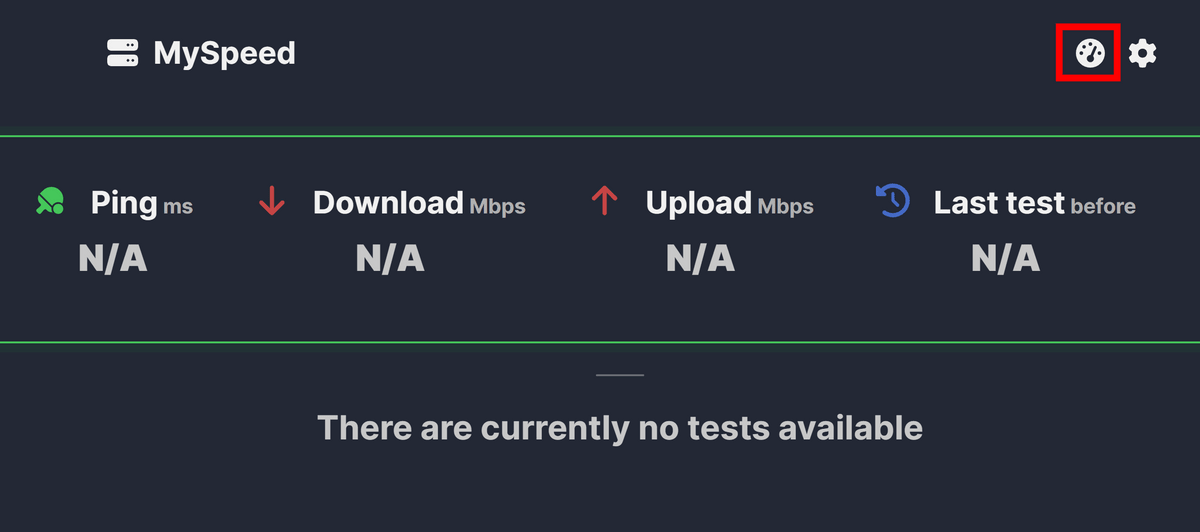
The screen immediately after startup looks like this. Click on the speedometer symbol in the upper right corner to perform a speed test.
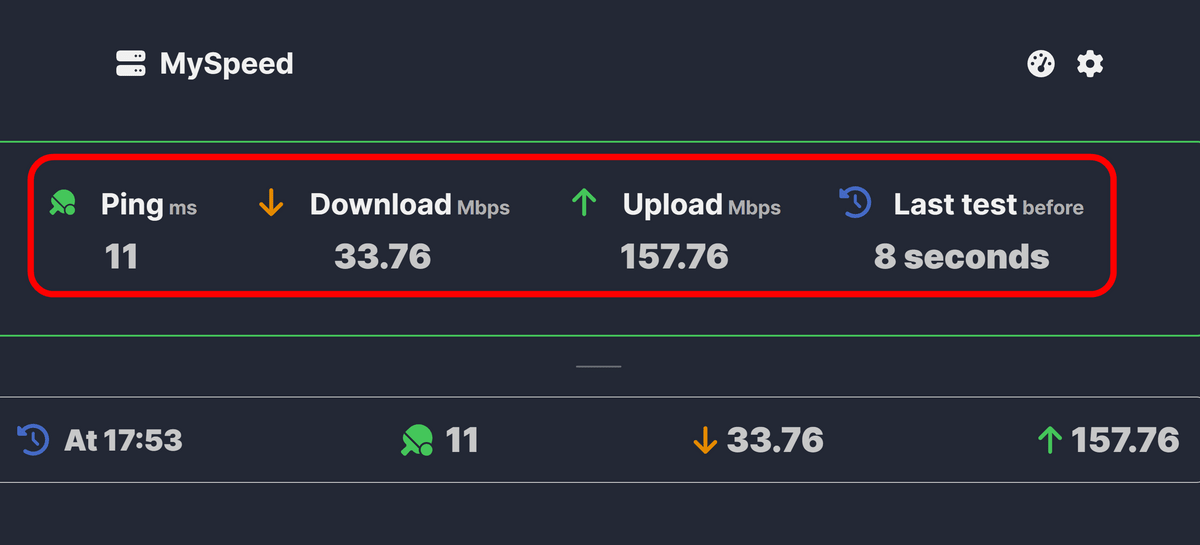
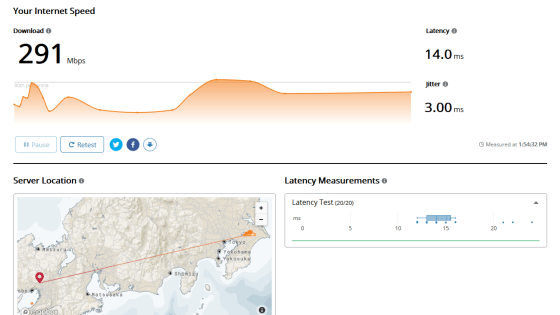
The speed test has been completed, and 'Ping', 'Download speed', 'Upload speed', and 'Test time' are displayed. Ping and Upload are displayed in green indicating 'good', but Download speed is displayed in yellow. In addition, this speed test was conducted on a line subscribed to Nuro Hikari's 2G plan.
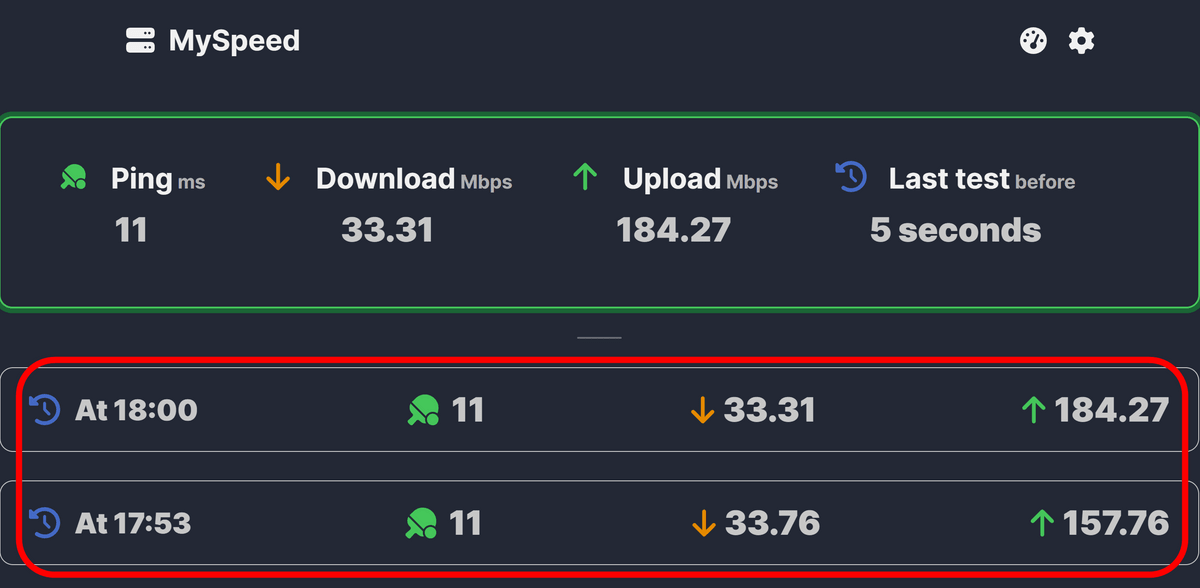
In addition to manual testing, the standard settings include automatic testing every hour. The test results will be recorded at the bottom of the screen.
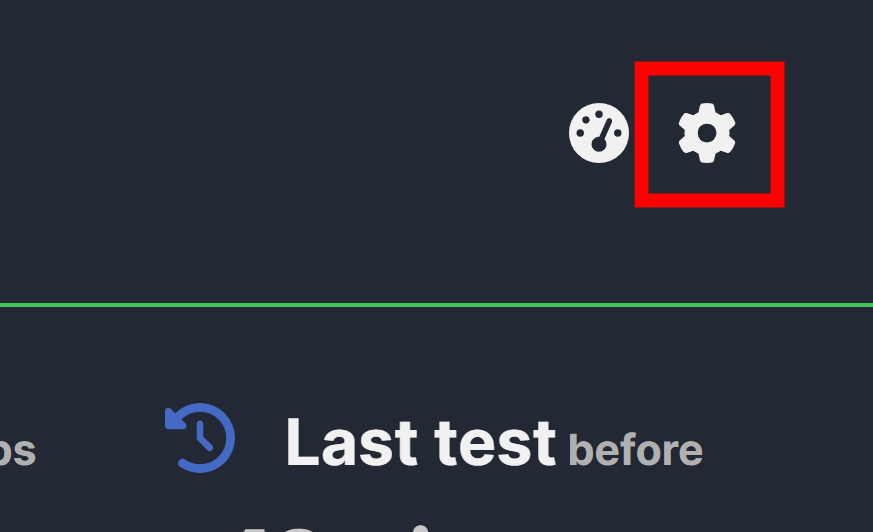
Click on the settings mark at the top right.
Then a menu was displayed where you can change various settings.
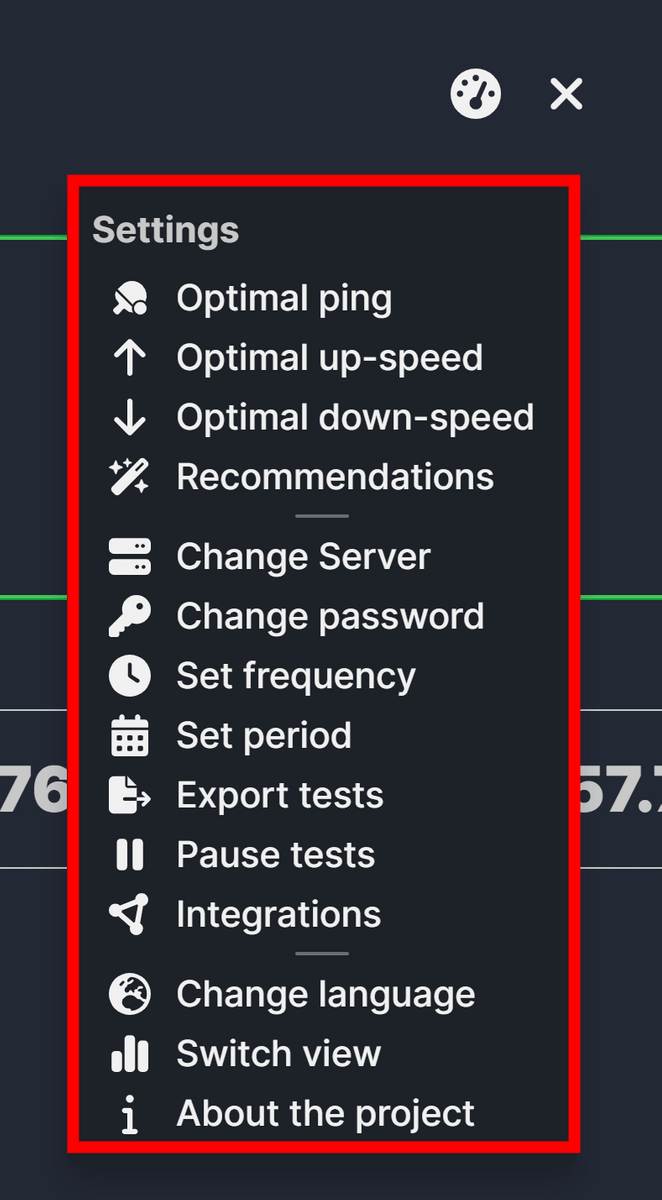
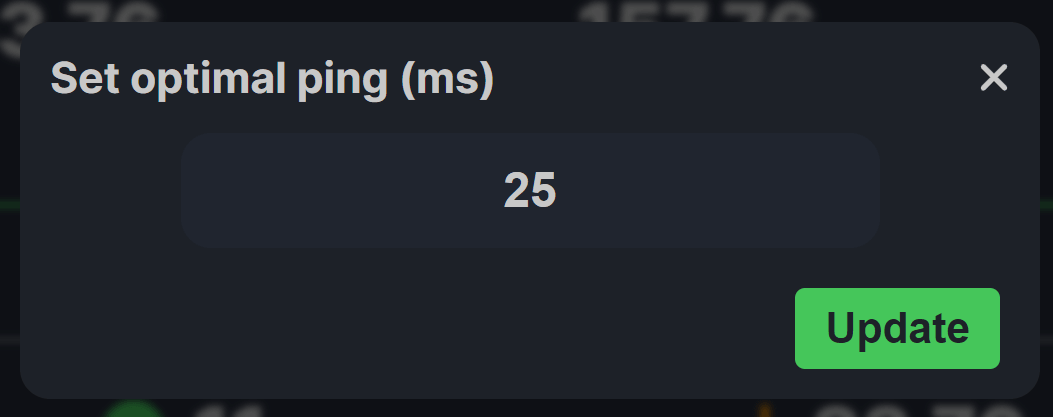
The three 'Optimal~' are threshold settings for displaying in green to indicate 'good'. The initial value for Ping is 25, and anything less than 25ms is considered good.
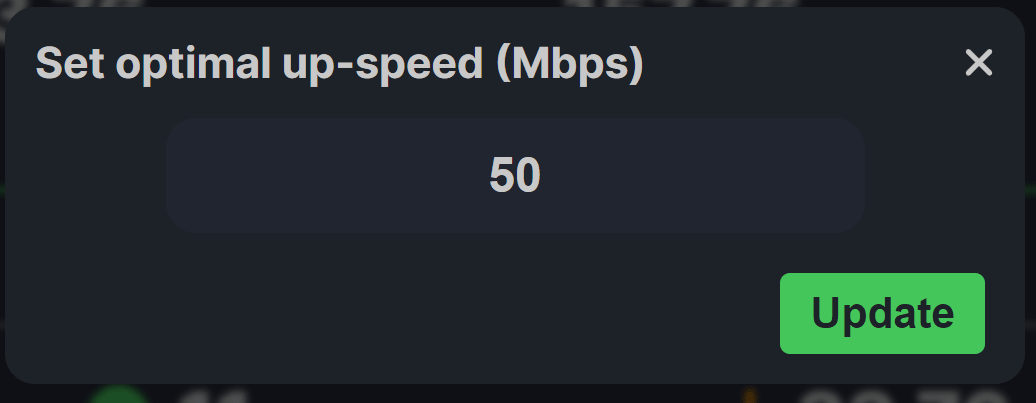
The initial upload speed setting was 50Mbps.
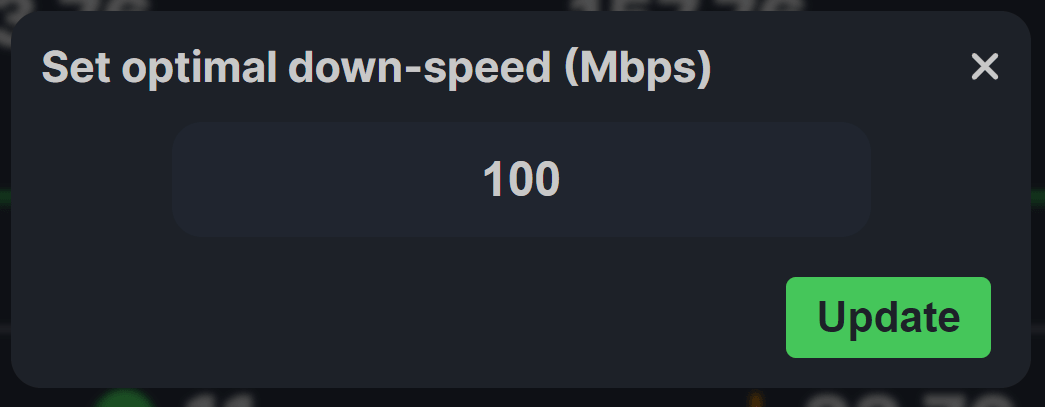
Downlink speed is 100Mbps. In the first speed test, the descending speed was slower than this setting, so it was displayed in yellow.
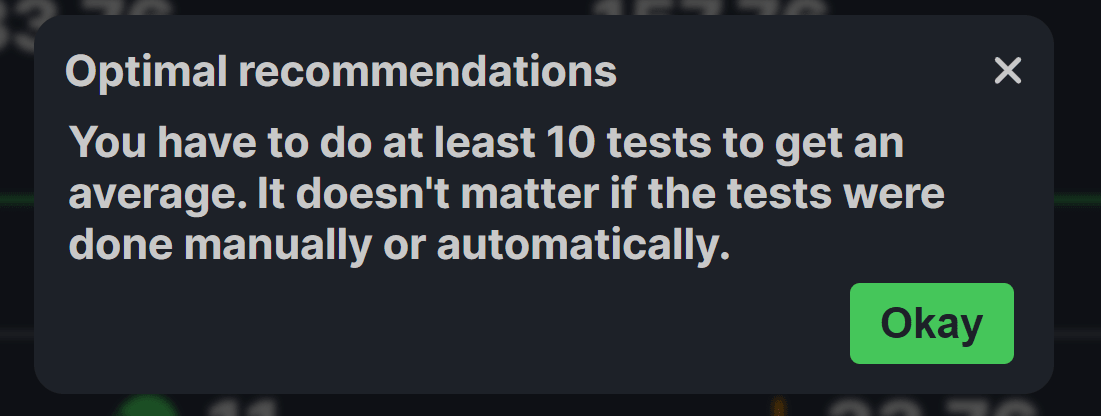
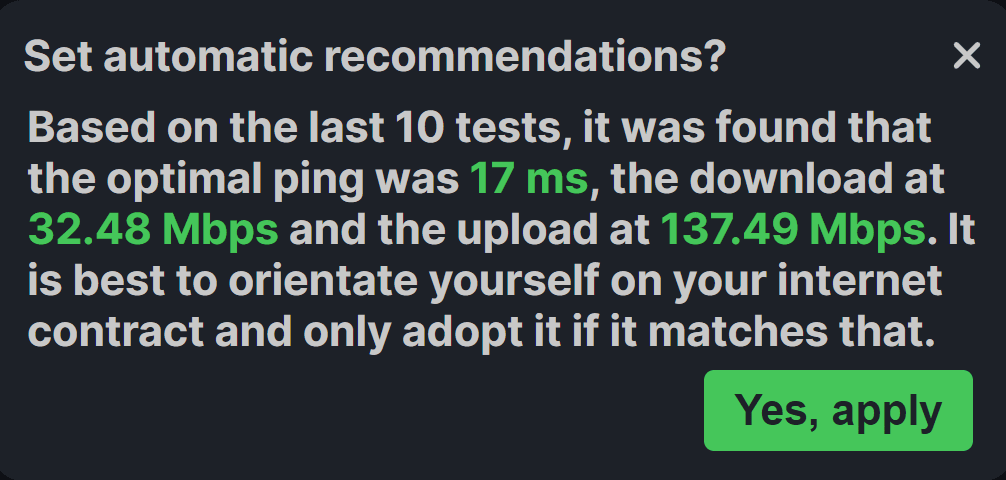
'Recommendations' is supposed to display recommended values for the three Optimal values, but it only advises that it is better to test 10 times or more and take the average.
When I tried displaying it again after testing 10 times, the recommended value was displayed this time.
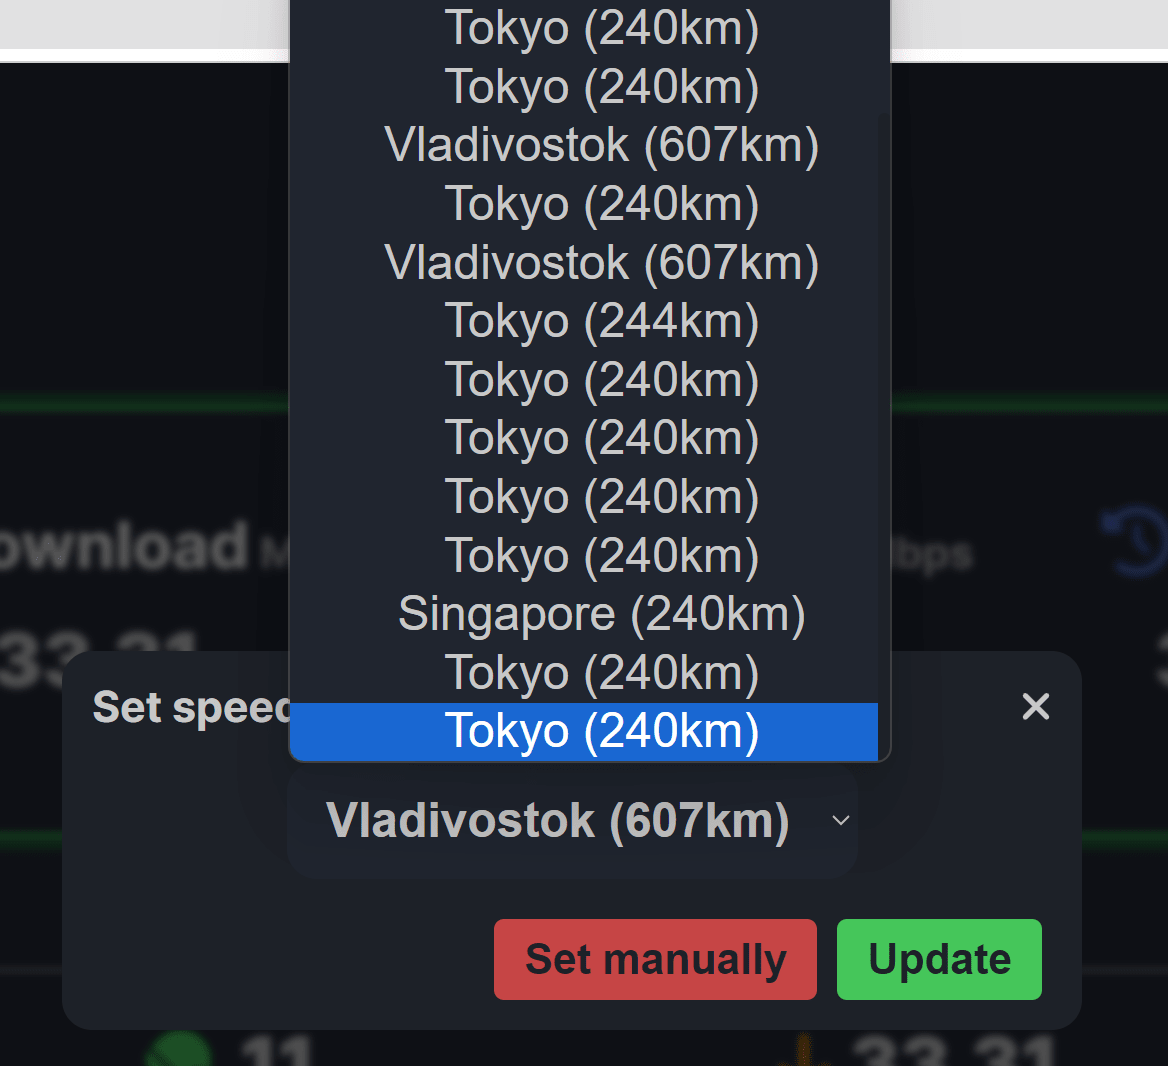
'Change Server' allows you to manually set the server that will perform the speed test.
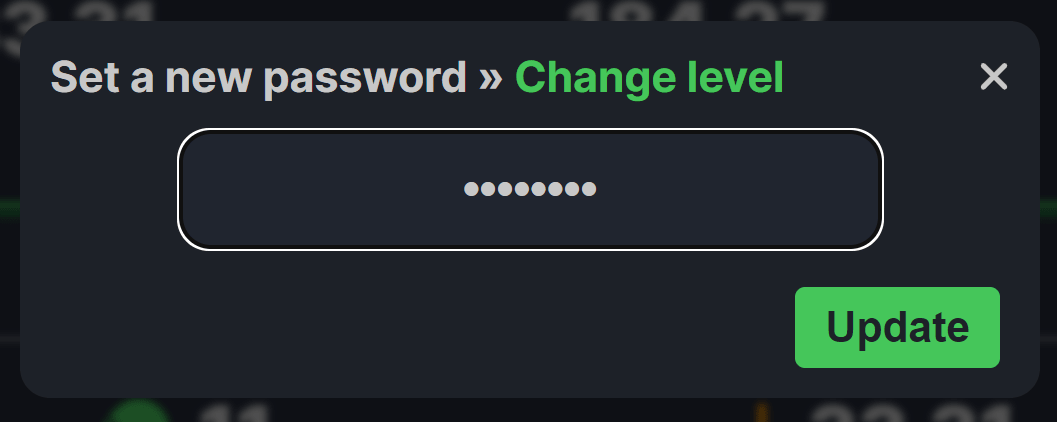
You can set a password with 'Change password'.
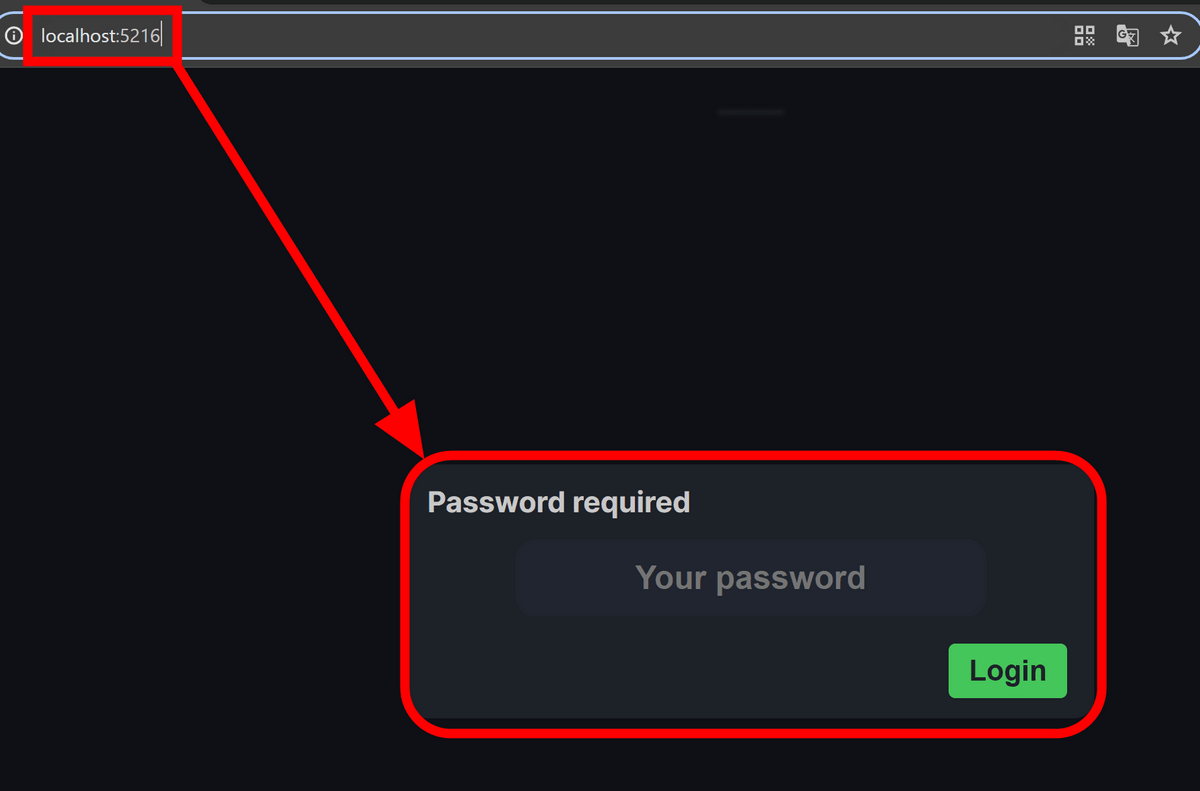
Once you set a password, you will be required to enter the password when accessing the dashboard.
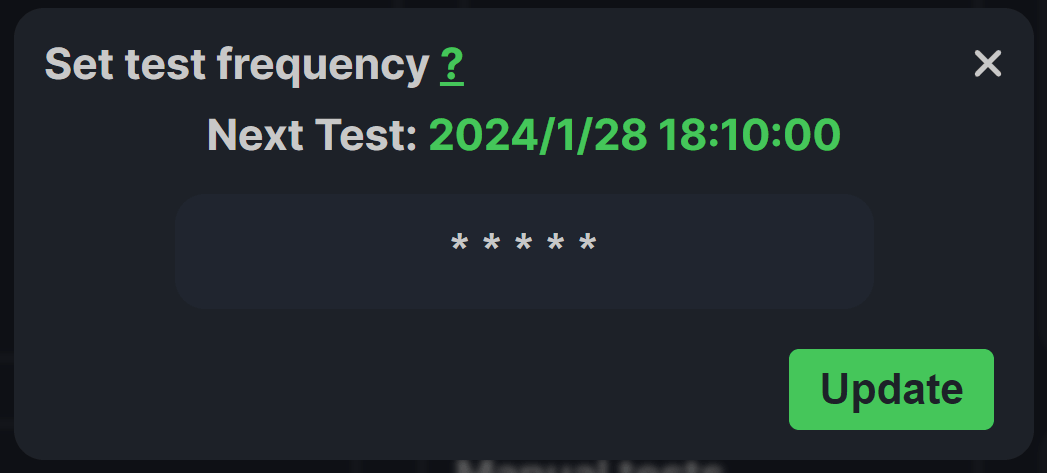
'Set frequency' allows you to set how often the speed test will be performed.
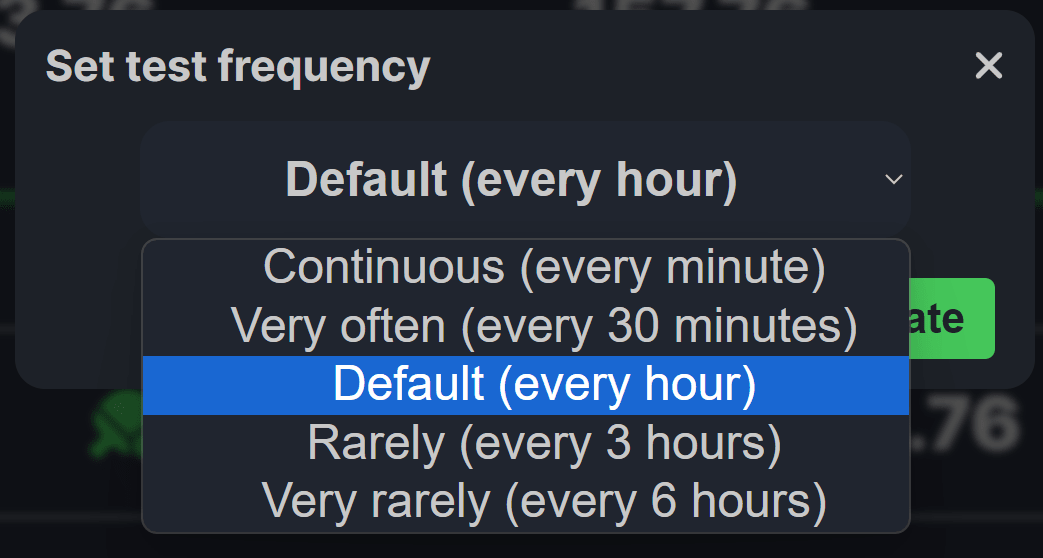
In addition to the 'every minute,' 'every 30 minutes,' 'every hour,' 'every three hours,' and 'every six hours' provided as templates, you can also use the same notation as
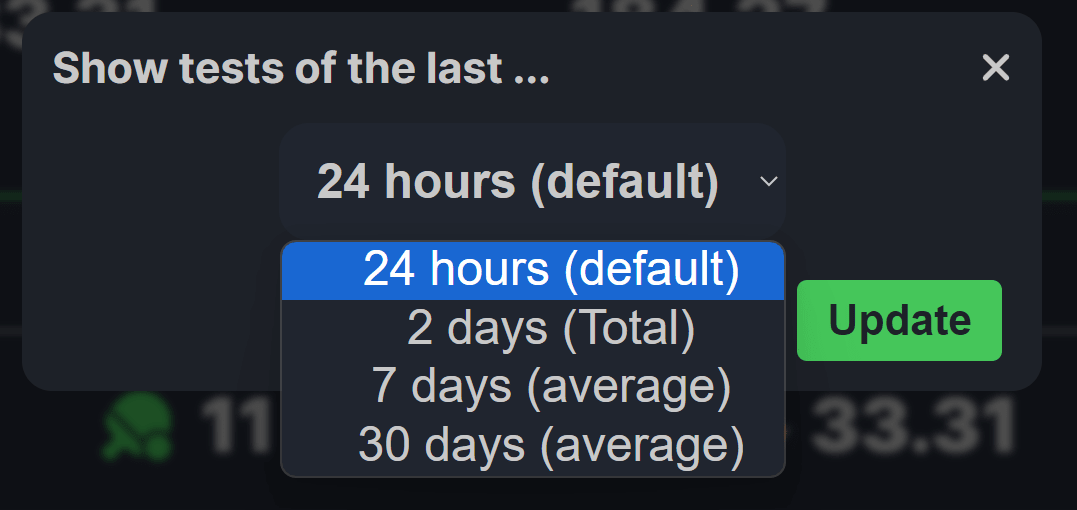
'Set period' allows you to select the period for saving test results. You can save up to 30 days of data, but if you set it to 7 days or 30 days, only the average value will be saved.
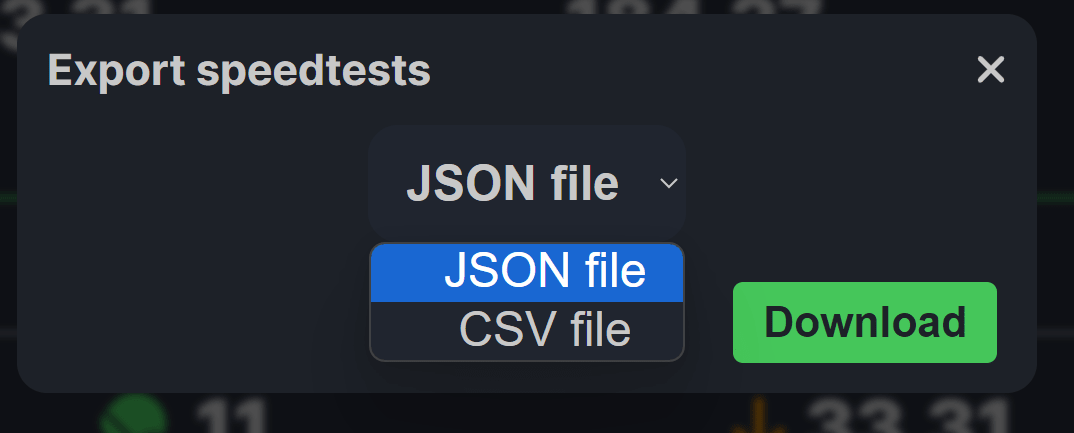
'Export tests' allows you to export test results in JSON or CSV format.
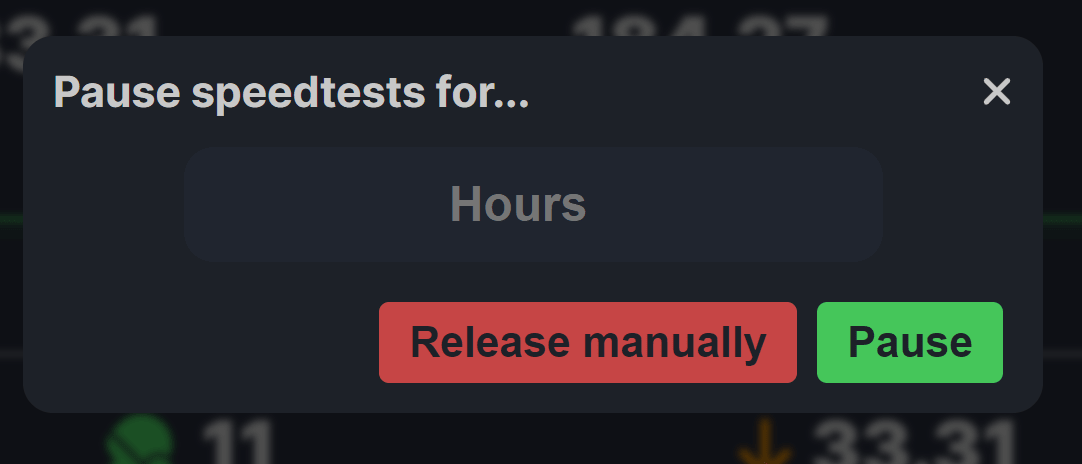
'Pause tests' allows you to stop the test for a certain period of time.
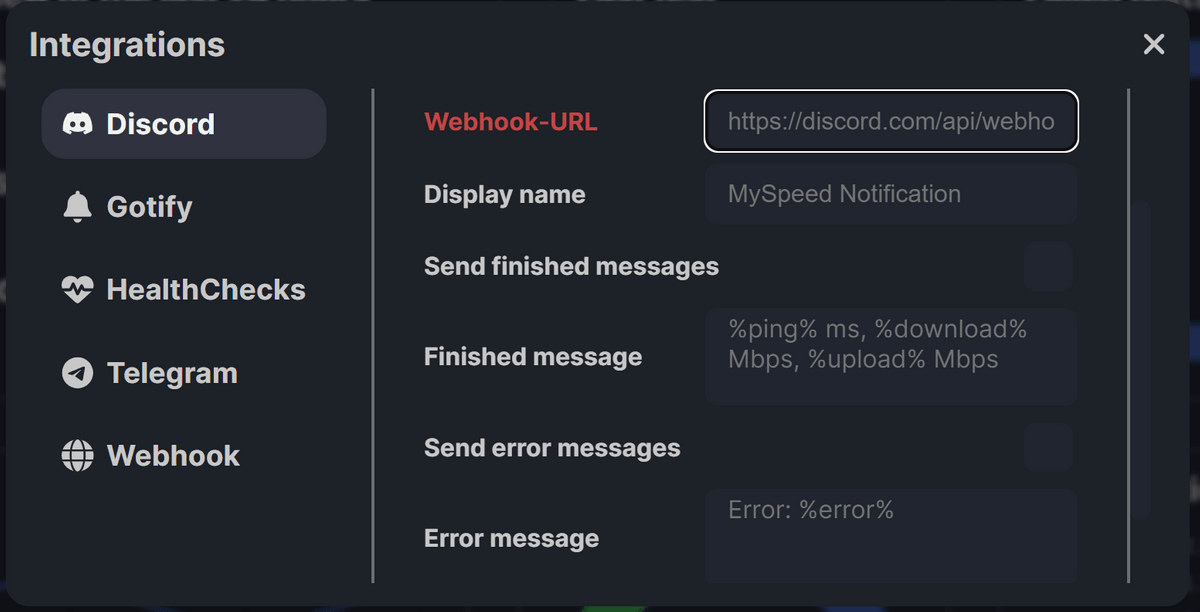
'Integrations' allows you to set up notifications to be sent to apps such as Discord, Gotify, HealthChecks, Telegram, etc. Additionally, you can send notifications to any app that supports webhooks.
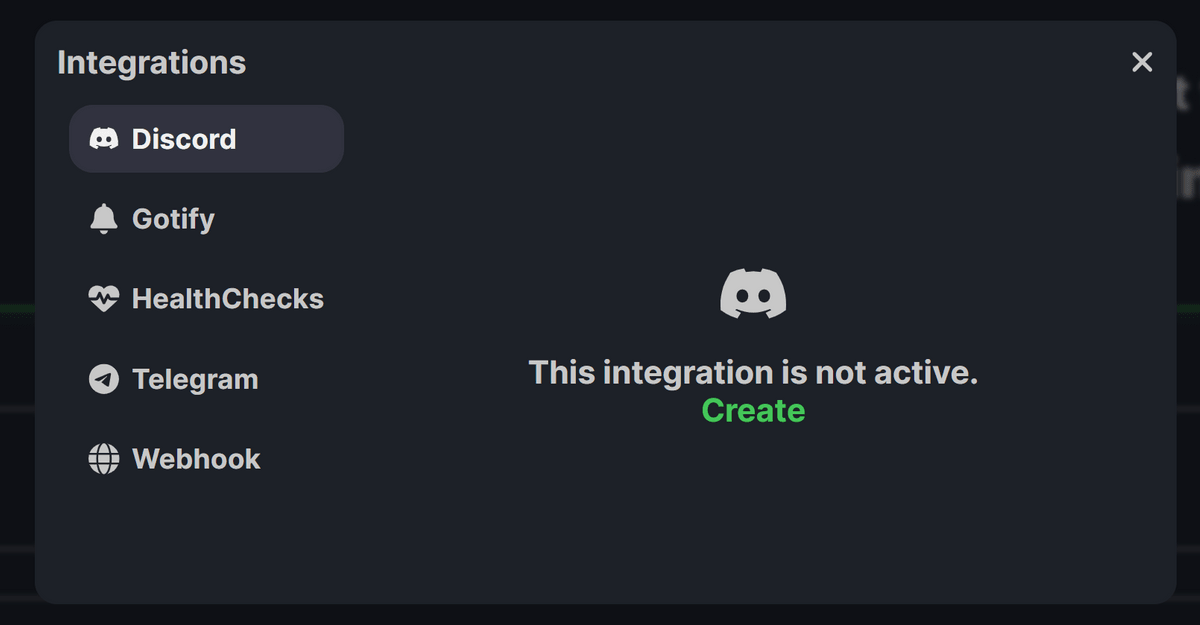
Notifications occur on test successes and errors. You can also customize your message.
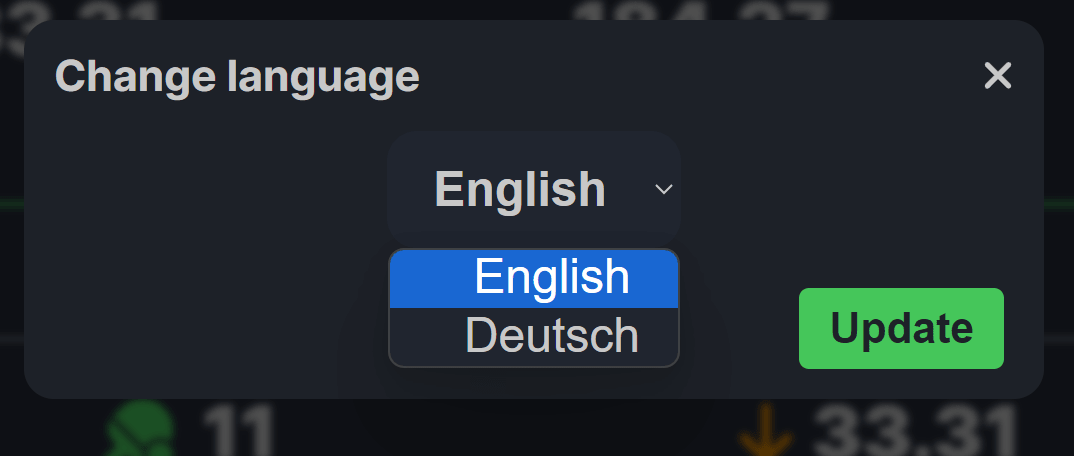
You can select English or German in language settings.
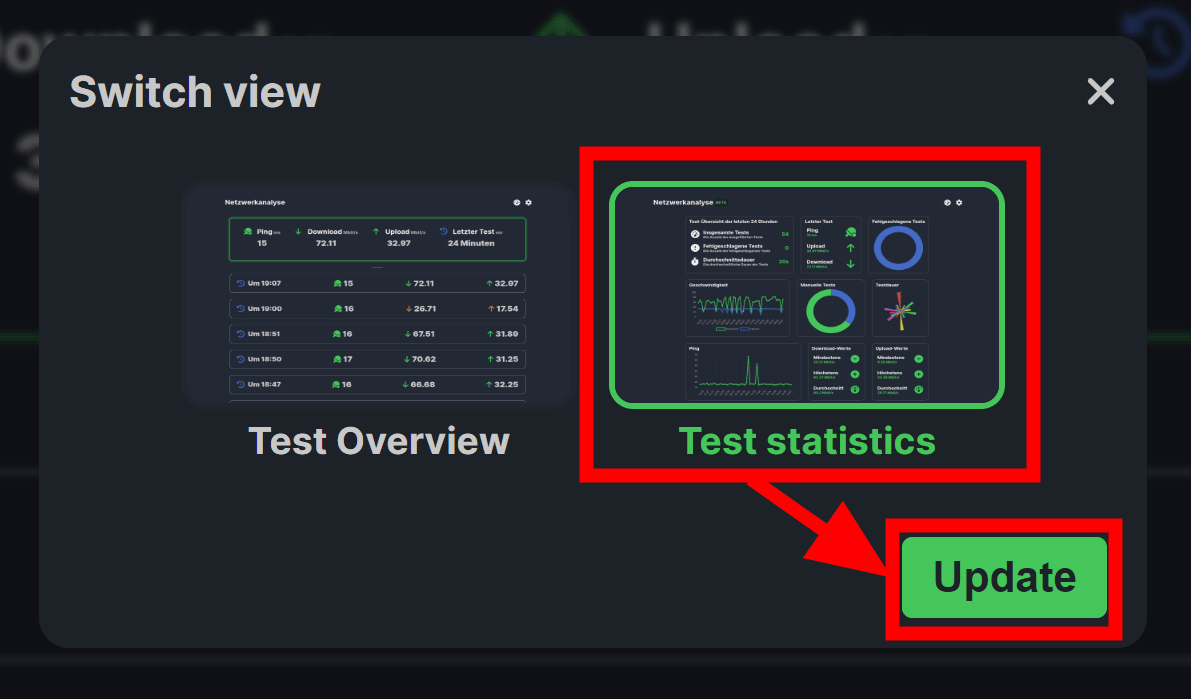
In 'Switch View', you can select the 'Test statistics' screen in addition to the initial 'Test Overview' screen. Select Test statistics and click Update.
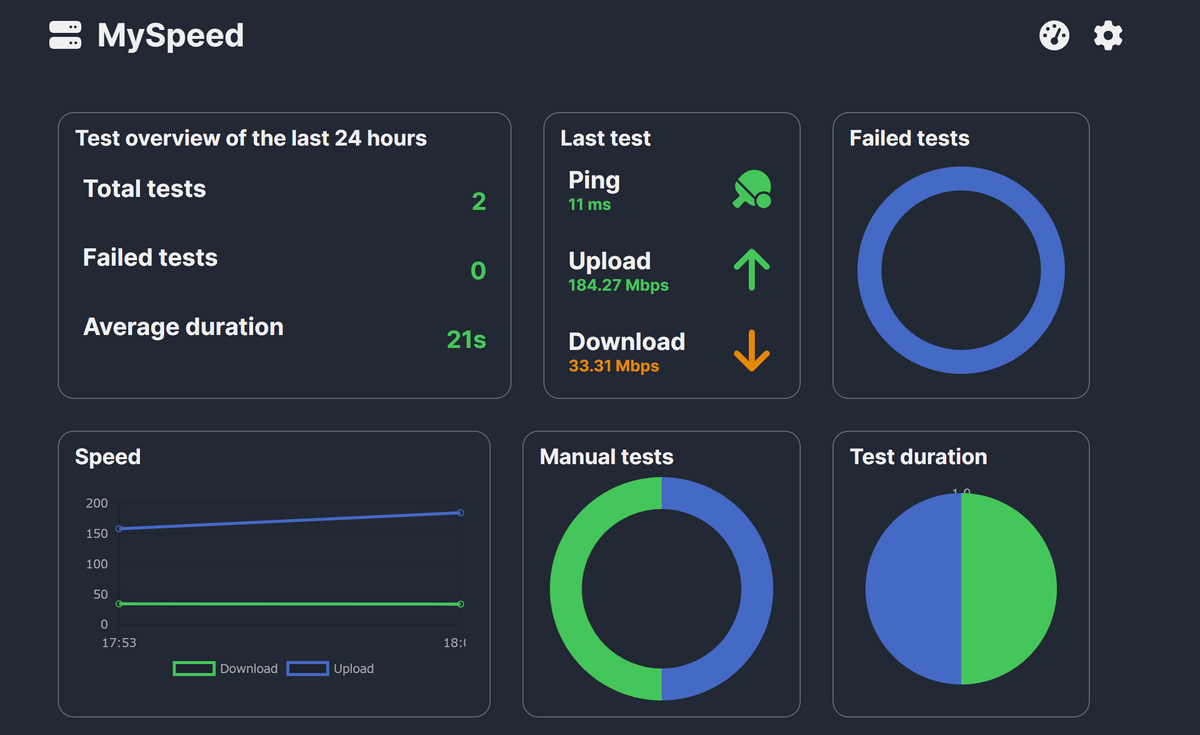
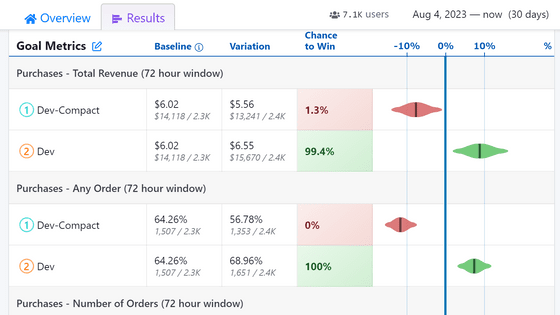
The screen now looks like this. Test results are displayed in easy-to-understand graph format.
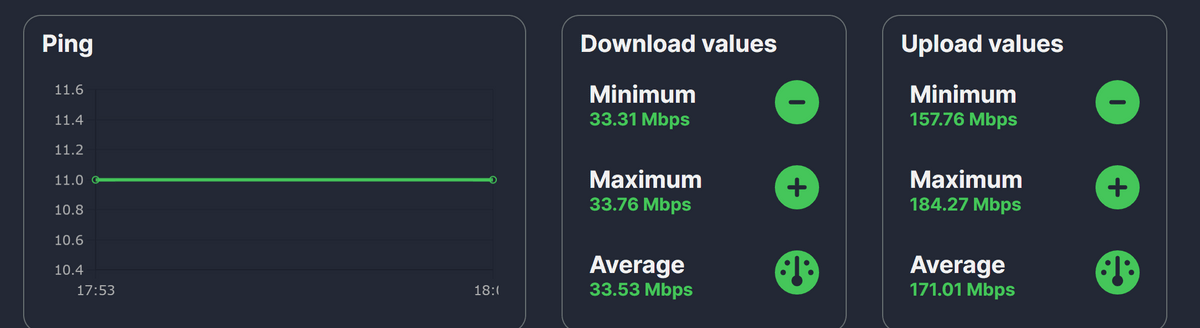
The transition of Ping and the maximum, minimum, and average values of download speed and upload speed are also displayed.
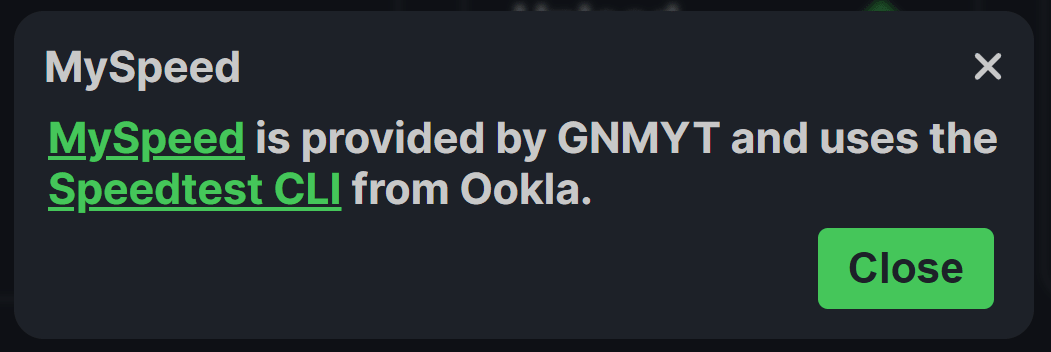
The last 'About the project' shows that the creator is 'GNMYT' and that the app uses Ookla's 'Speedtest CLI'.
◆Forum now open
A forum related to this article has been set up on the GIGAZINE official Discord server . Anyone can write freely, so please feel free to comment! If you do not have a Discord account, please create one by referring to the article explaining how to create an account!
• Discord | 'What is the line speed at home? Does it change depending on the time?' | GIGAZINE
https://discord.com/channels/1037961069903216680/1201465297857691688
Related Posts:

in Software, Review, Web Application, Posted by log1d_ts