Cloudflare introduces a speed test site that can measure the speed and delay of the net quickly and in detail
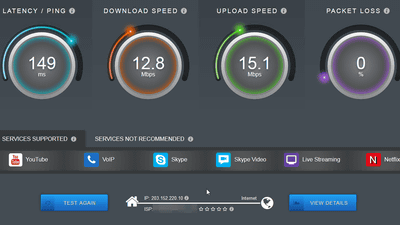
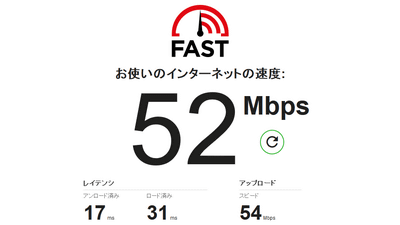
There are Google's 'Internet speed test' and Netflix's '
Speed
https://speed.cloudflare.com/
About Speed
https://speed.cloudflare.com/about/
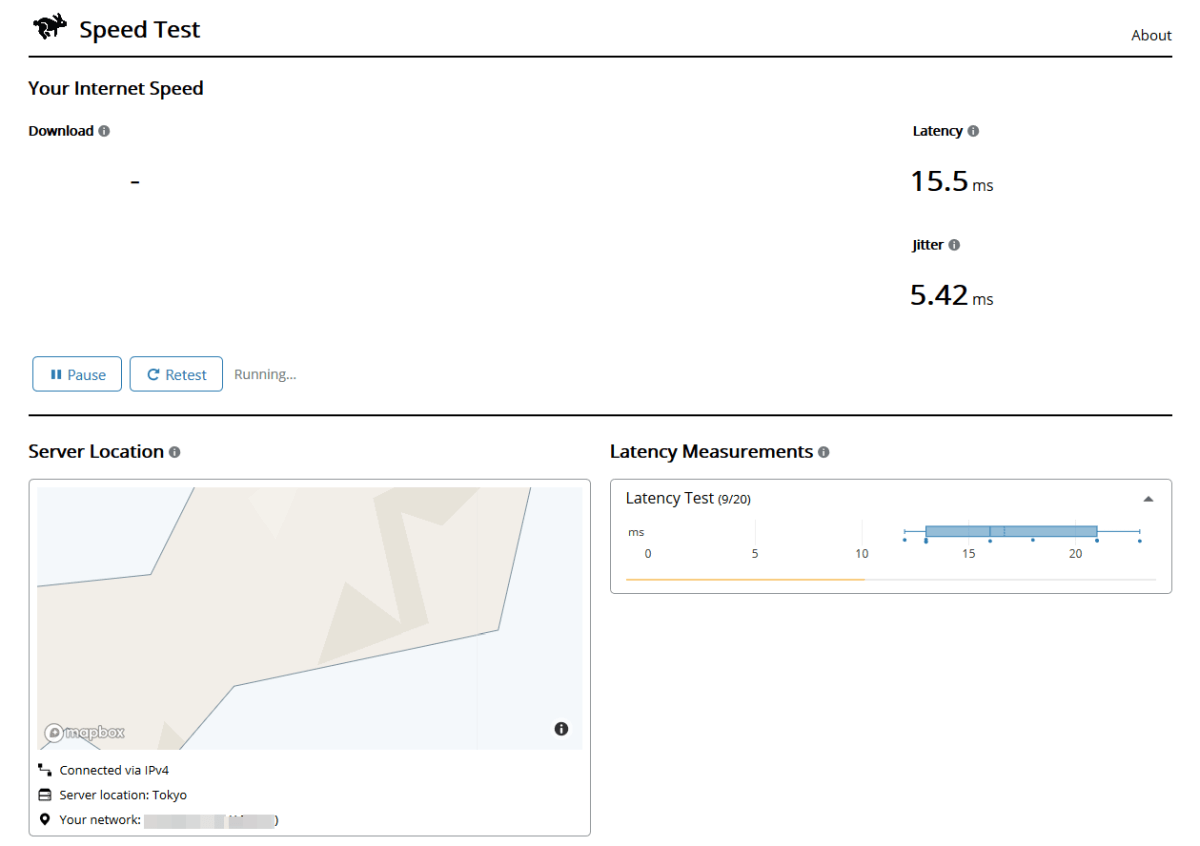
Immediately after accessing 'speed.cloudflare.com', the line speed of the Internet you are using starts to be measured.
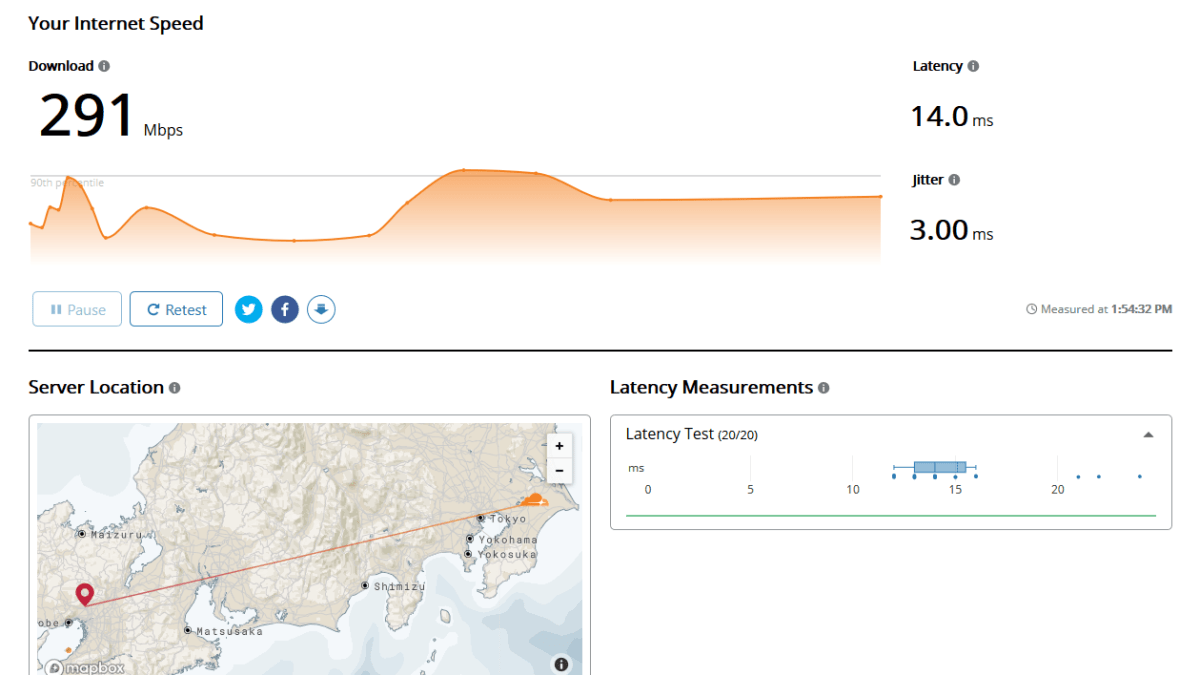
After a while, graphs and maps will also be displayed. At the time of writing the article, the measurement target is only the downstream speed, the downloaded file size is changed and tested several times, and the 90th
After waiting about 10 seconds, the measurement result was displayed.
In the graph, the vertical axis is the line speed, each test result is plotted horizontally in the orange area, and the 90th percentile value is displayed as a gray line. Since the test result is the 90th percentile value, it is easy to see that it is below the measurement result in many test times and that the measurement result is not the maximum value.
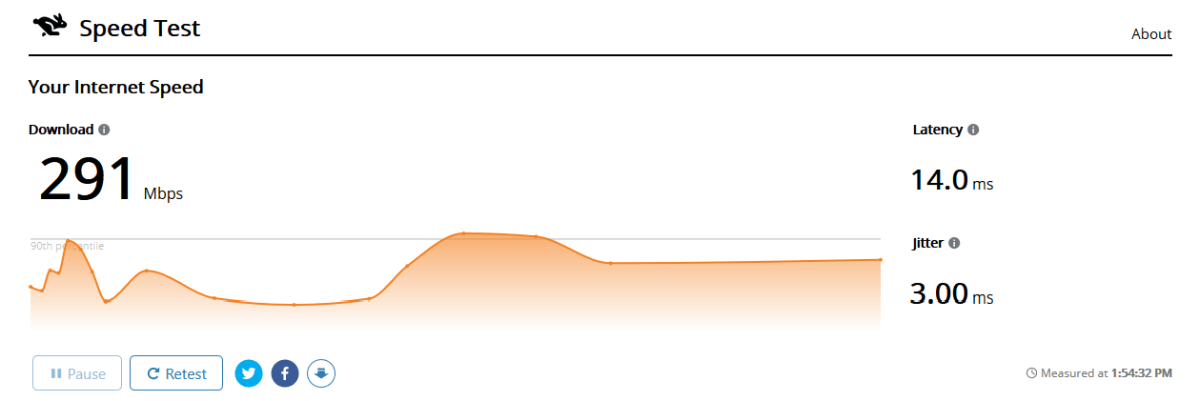
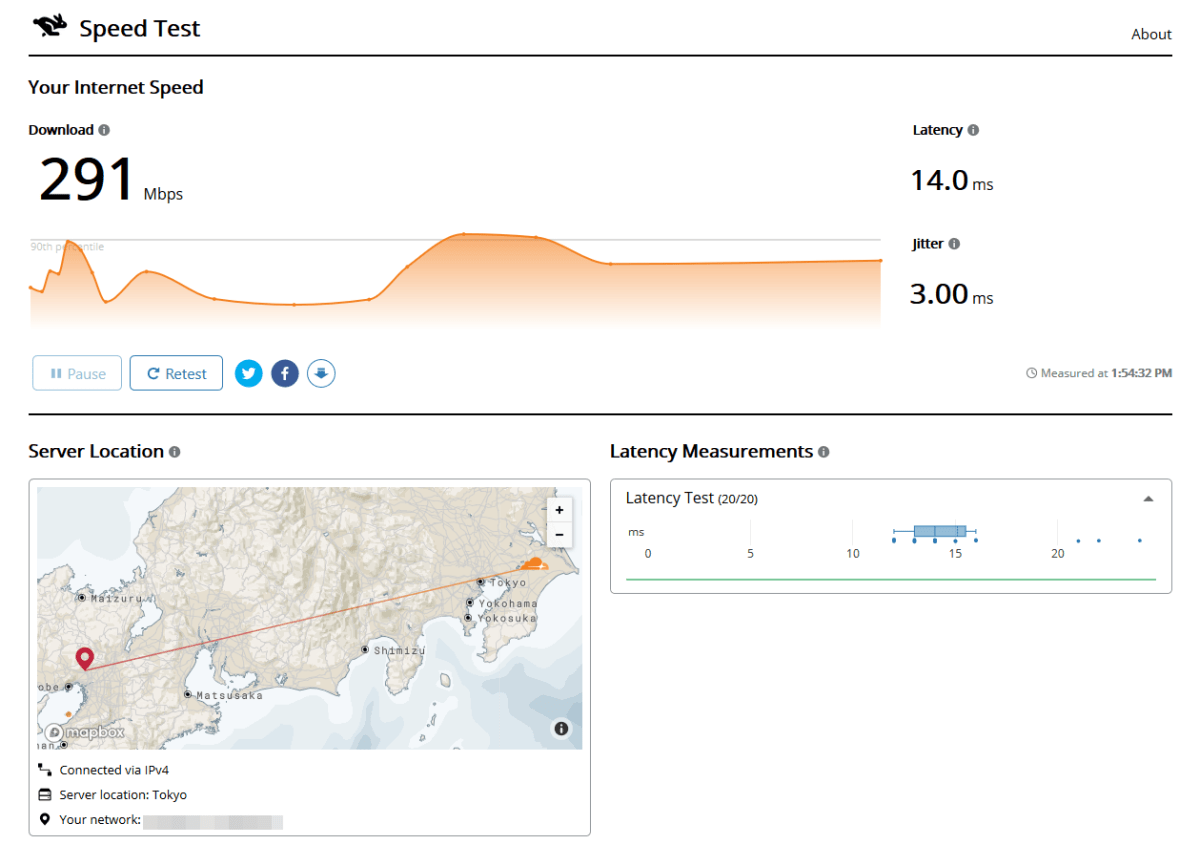
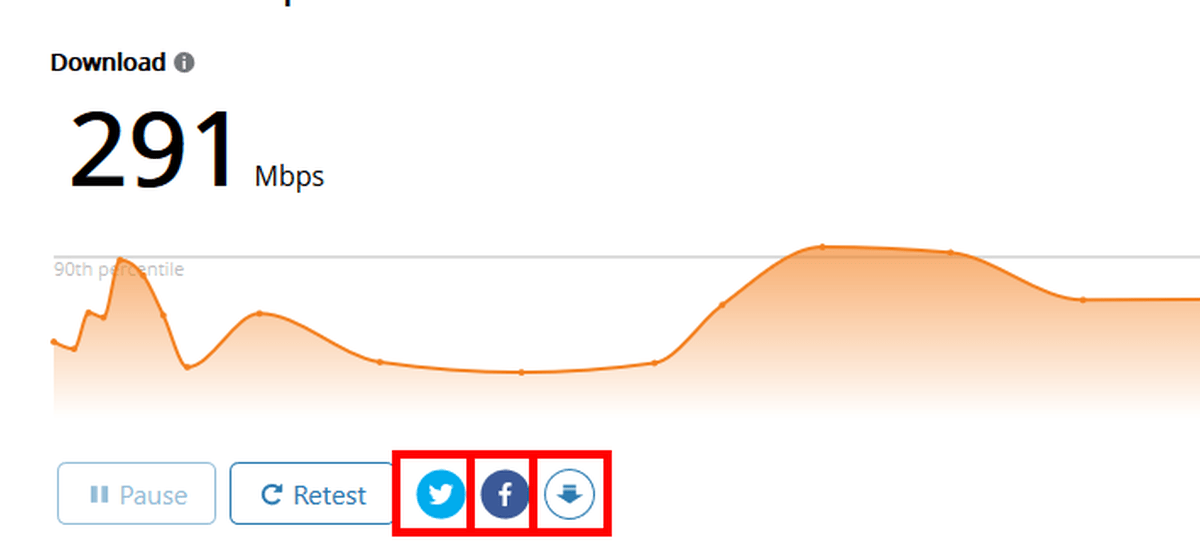
It is also possible to share the measurement results on Twitter or Facebook and output the results in CSV.
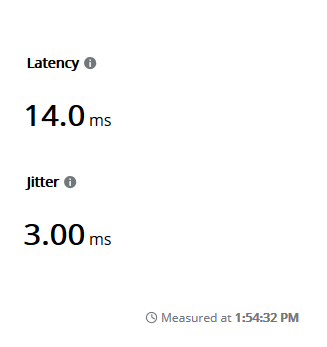
'Latency' on the right side of the graph shows the 'delay' of communication, which is how long it took for your computer to send data to the server and receive a response. It is an important index for online games, etc., and the smaller the size, the better. 'Jitter' is 'fluctuation' and represents the dispersion of delay values. The average value of the differences in the delay values of each successive test is output.
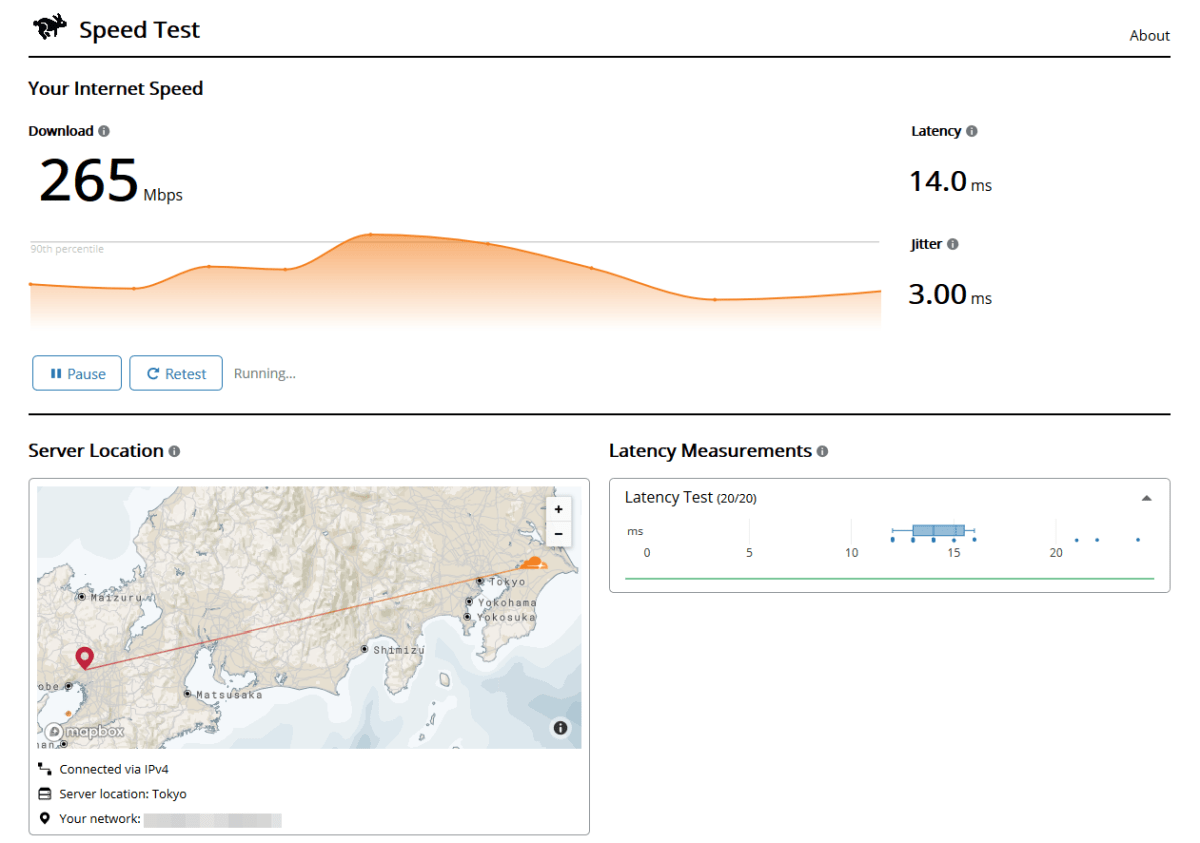
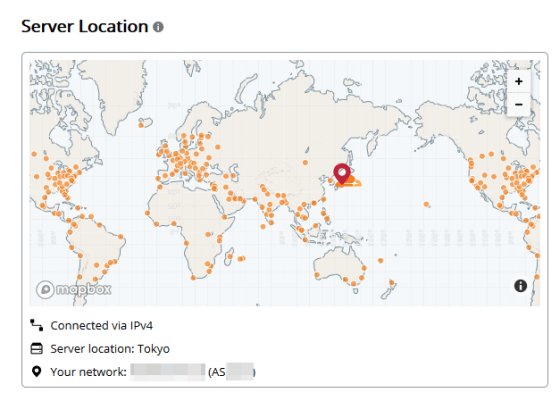
The map displayed with the graph shows the locations where the tests were conducted and the approximate locations of Cloudflare's server locations used for the measurements. Below the map is the IP version, server location, your global IP address and your Internet provider's
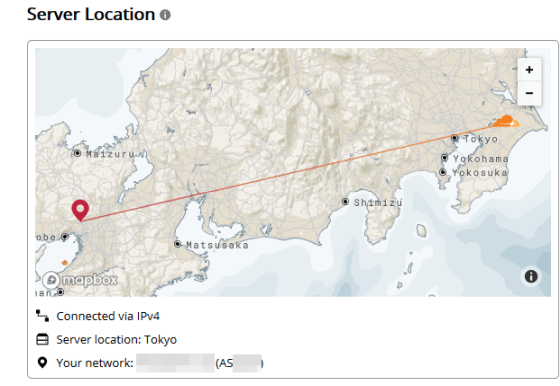
You can also expand the range of maps displayed to see the locations of Cloudflare server locations around the world.
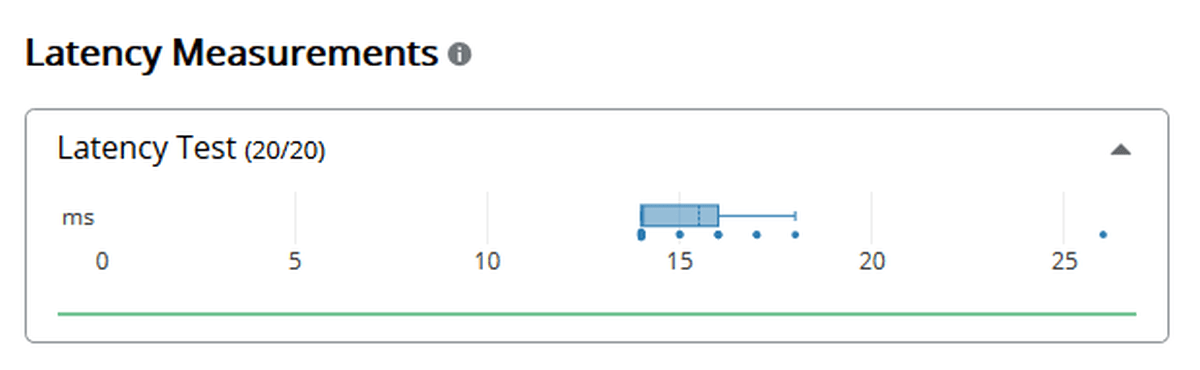
'Latency Measurements' is the time it takes for an HTTP request to reach the server. The measurement results are plotted as dots, with a thin bar between the maximum and minimum excluding outliers and a thick bar between the 25th and 75th percentiles. The vertical solid line shows the median value, and the vertical dotted line shows the average value.
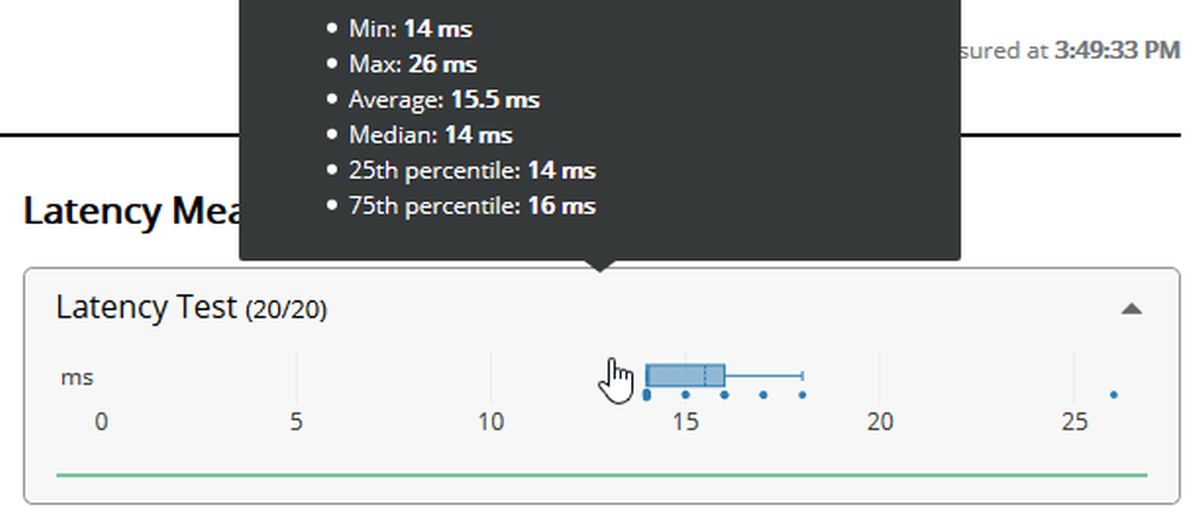
You can also check the detailed values by moving the mouse cursor to the graph.
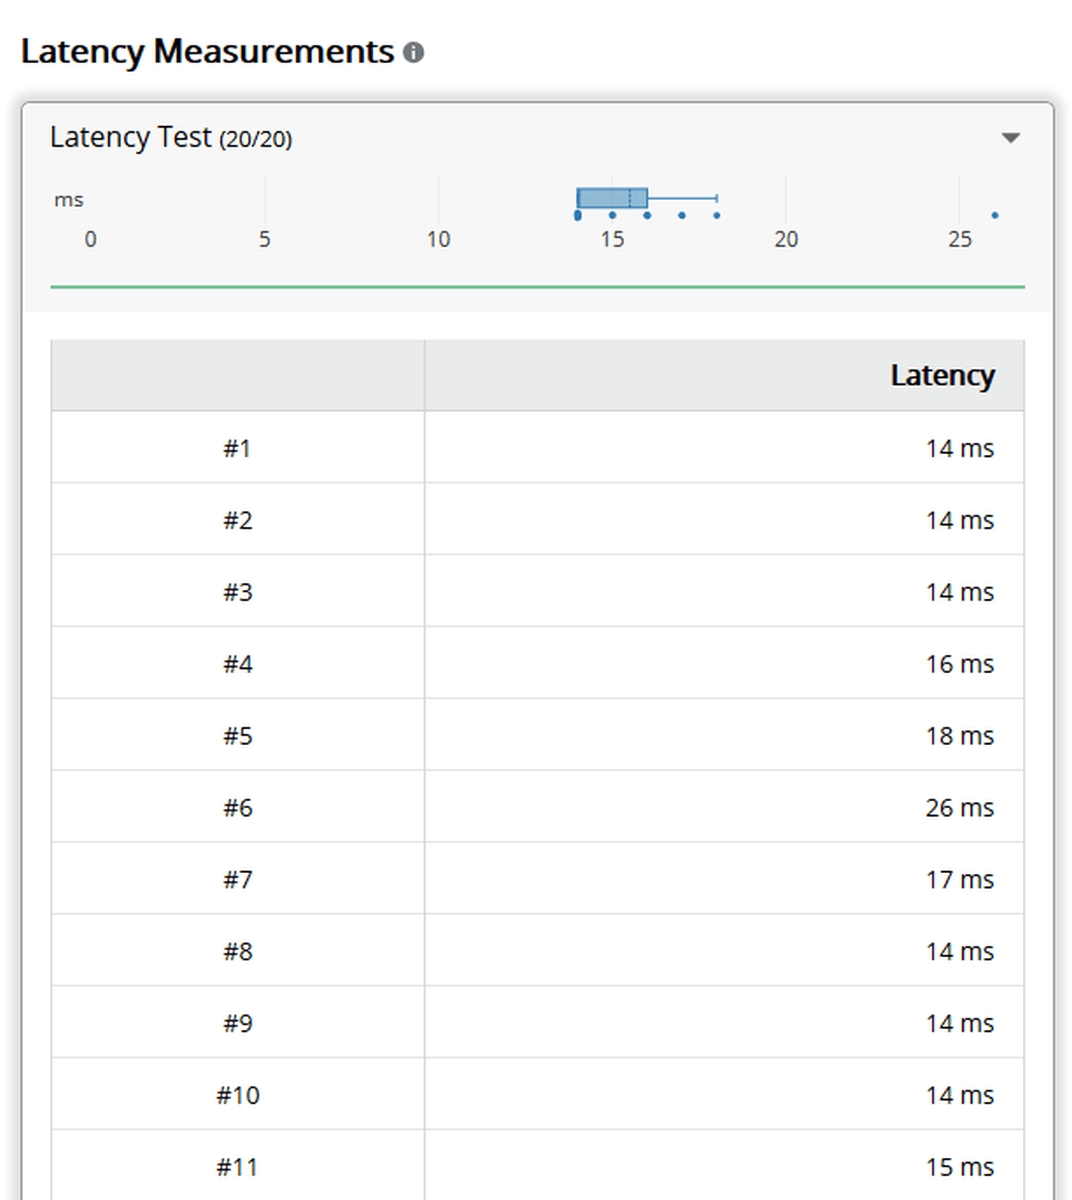
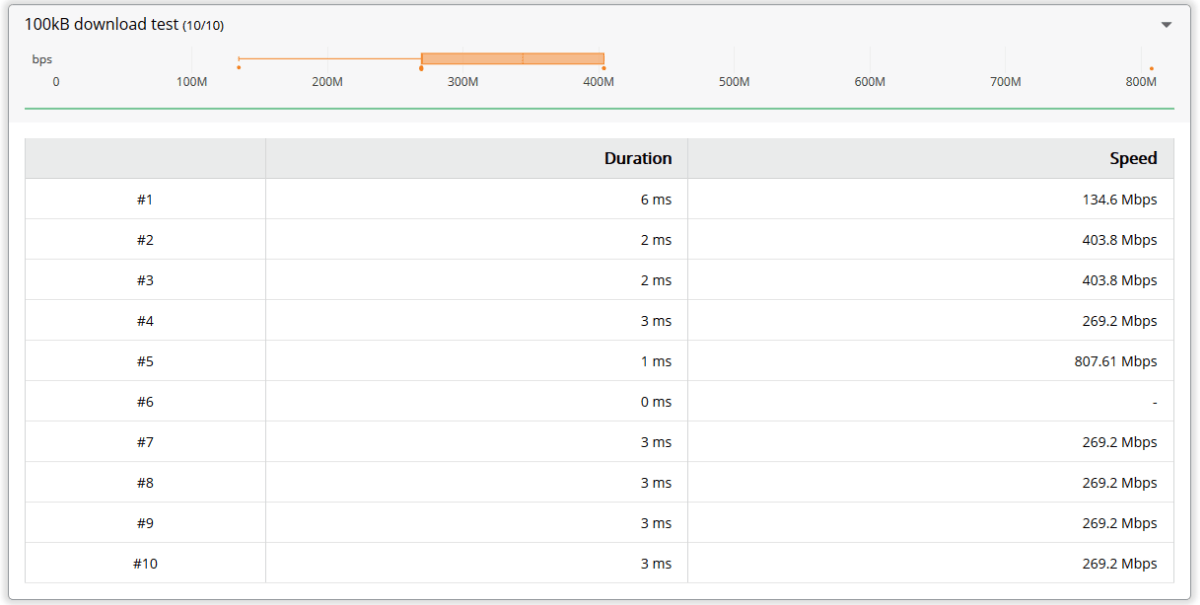
You can view the data for each test individually by clicking the graph.
By scrolling down the page, you can check the measurement results collectively for each downloaded file size. The way to read the graph is the same as 'Latency Measurements'.
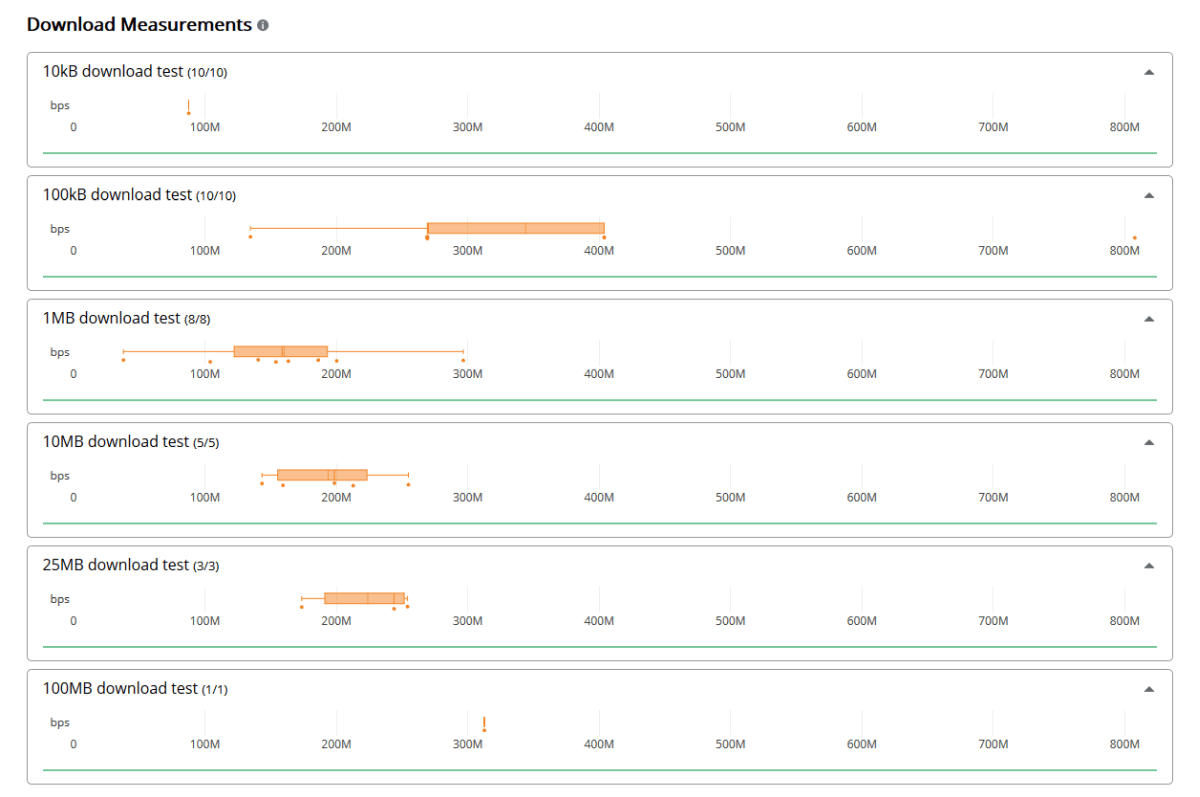
If you click each graph, you can see the data of each test individually like “Latency Measurements”.
speed.cloudflare.com is deployed by Cloudflare Workers in 180 city data centers. Cloudflare commented, 'We follow the mission of building a better internet and give more choices to users,' as to why we created speed.cloudflare.com among many other speed testing sites.
Related Posts:


in Web Service, Review, Posted by darkhorse_log