Google publishes "Data Gif Maker" that allows you to create a moving graph by simply adding item names and numbers

A Web tool that can create animation graphs that can effectively appeal data contents during material creation and presentation "Data Gif MakerGoogle launched it.
Make your own data gifs with our new tool
https://www.blog.google/topics/journalism-news/make-your-own-data-gifs-our-new-too/
Using Data Gif Maker, it is possible to create a moving graph as follows. What you can create is a so-called "100% stacked graph" of a bar chart, showing how animation seems as if two elements are intertwined.

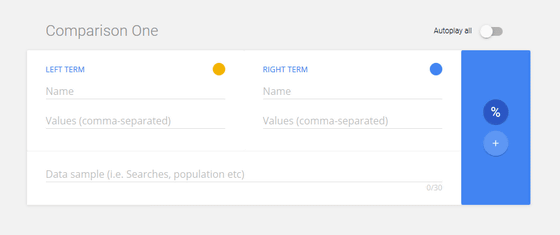
To create a graphThis edit pageIt is possible to do from. When you access the page, the following input form is displayed.

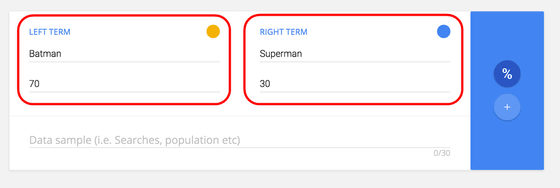
First, enter the item name in the upper row of the text box on the left and right, and the numerical value in the lower row. At this time, you can also type in Japanese characters.

Next, choose the color of the graph. You can choose colors from the four colors red, blue, yellow and green that Google uses for logos and so on.

Enter the contents indicated by the graph ... ...

If you click "LAUNCH COMPARISON", the moving graph will be displayed in a separate window. Also, clicking "DOWNLOAD AS GIF" allows you to download GIF files. In that case, it is possible to select two kinds of resolutions, "Hi" and "Low".

It is possible to easily create a moving graph. The server was crowded at the time of writing the article.

Related Posts:
in Web Application, Posted by darkhorse_log


