"TamoSoft Throughput Test" to measure and graph the throughput between the server and the client in real time
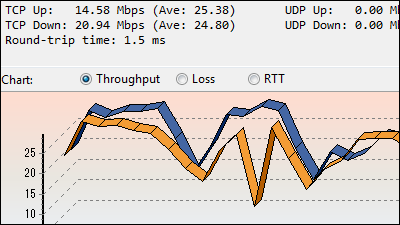
Such as video / audio / mail / data transferQoSIn order to confirm the throughput data, when checking how the throughput data is not numerical data, free software that can visually check the graph and check it is "TamoSoft Throughput Test"is. Installation and setting operation explanation from the following
Network Analysis Tools & Security Software by TamoSoft
http://www.tamos.com/download/main/index.php
◆ Installation
Click "arrow button" of Throughput Test 1.0 at the bottom of the above site.
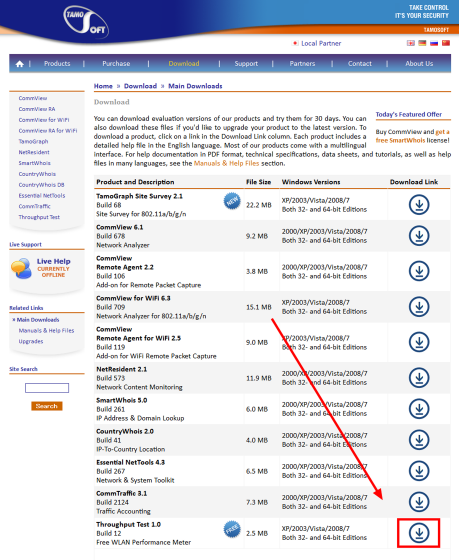
Download the downloaded ZIP fileExplzhExtract it with etc, and start the downloaded "setup.exe".

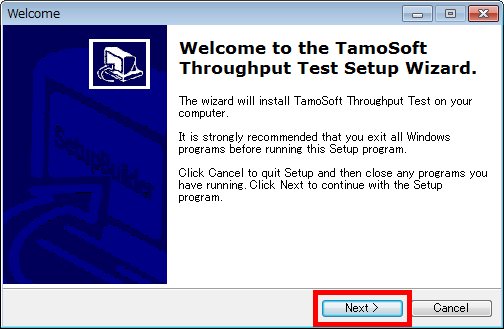
Click "Next".
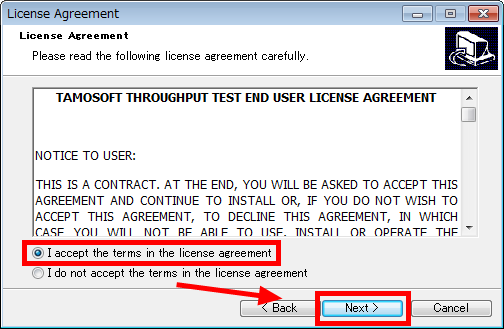
Please check "I accept the terms in the license agreement" and click "Next".
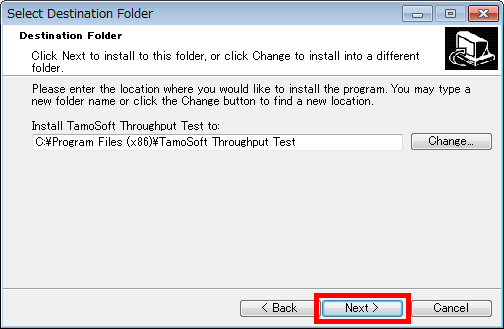
Click "Next".
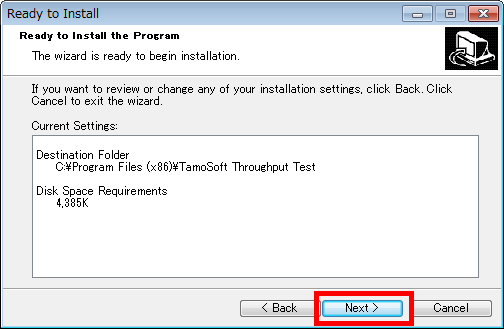
Click "Next".
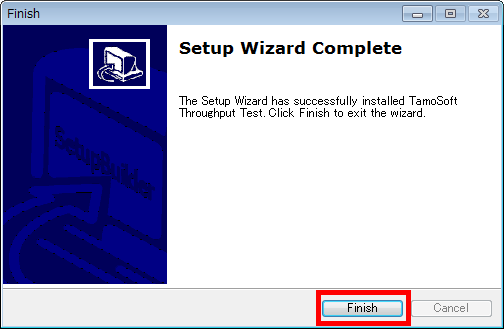
Click "Finish".
◆ Setting and operating method
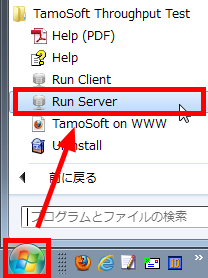
First, to set up the server side, click "Run Server" from "Start button".
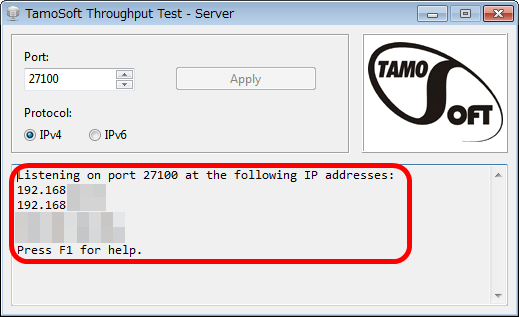
The setting screen is displayed, and when the IP address is displayed next, the setting on the server side is completed.
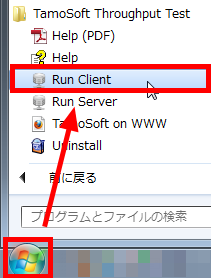
Next, when setting the client side, click "Run Client" from "Start button".
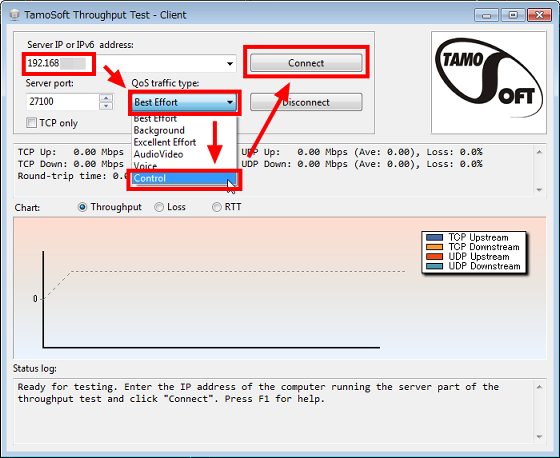
As the setting screen is displayed, enter "server IP address" displayed on the server side, select "Control" here for QoS traffic type, and click "Connect". The choices of QoS traffic type are Best Effort (normal time unrelated to QoS), Background (during backup), Excellent Effort (during important communication such as mail), Audio Video (video streaming), Voice (audio streaming), Control Data transfer).
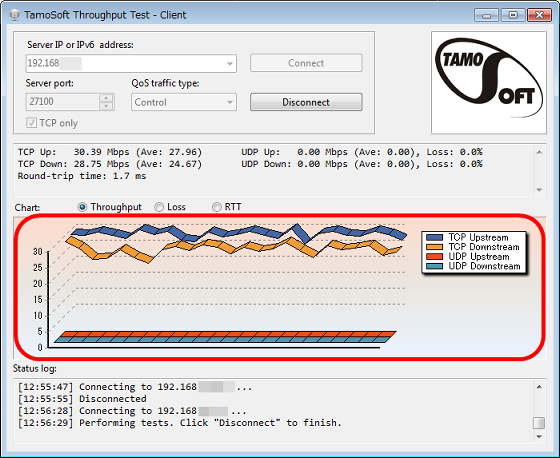
Then, measurement of throughput on the server side and the client side began, and the measured values are graphed.
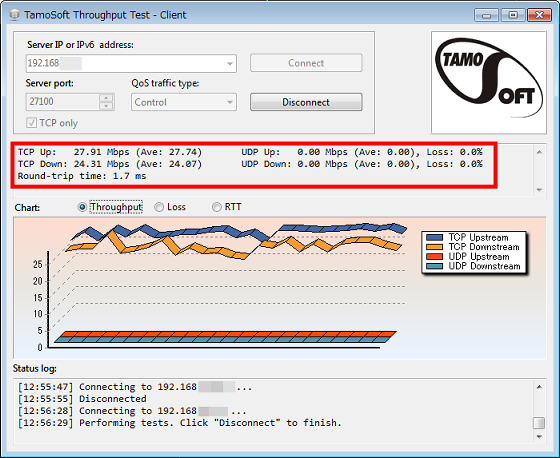
Of course, TCP · UDP · Loss figures are also displayed.
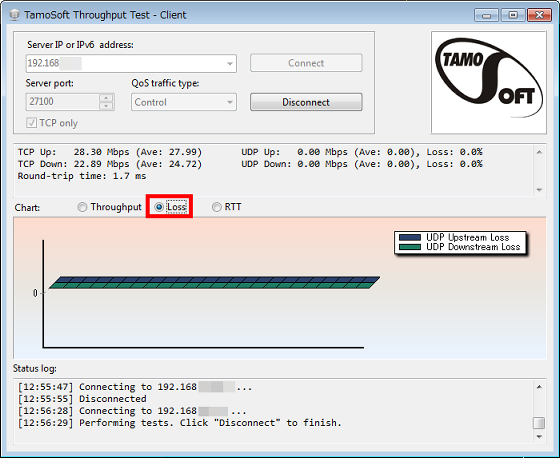
To see how much loss you have, click "Loss".
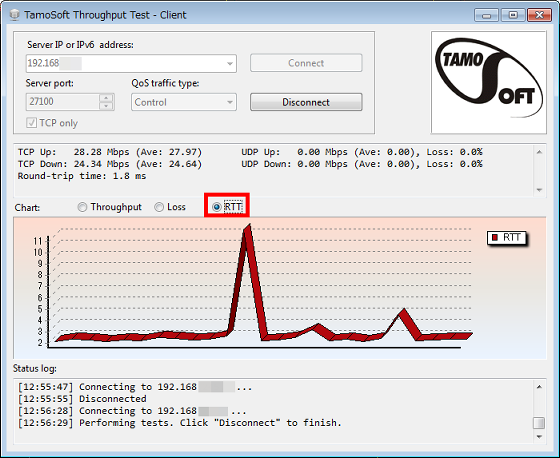
RTTTo check, click "RTT".
It is also possible to save the graph, right click on the graph part and click "Save as ...".
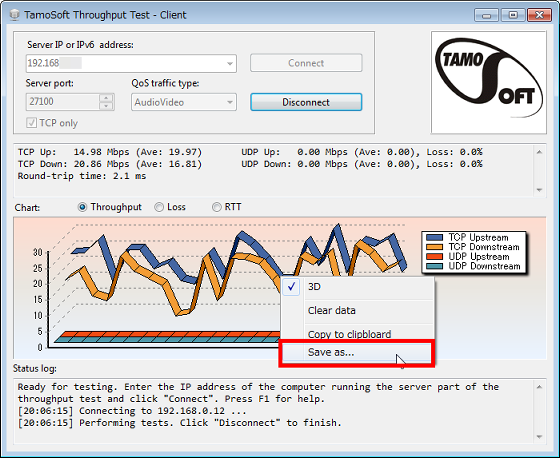
You can save graphs as you see.

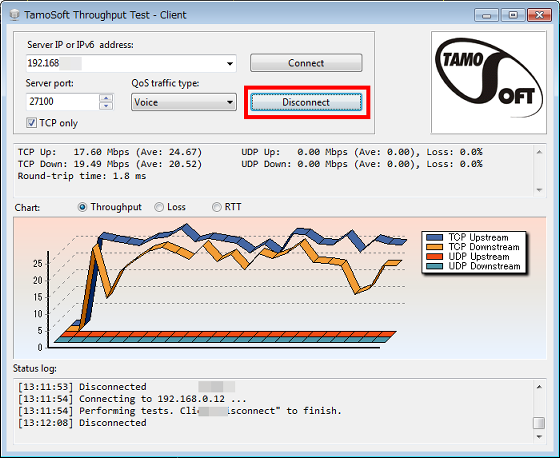
To disconnect at the end, click "Disconnect".
Related Posts:
