Google spreadsheet automatic data analysis function "data search" evolved smarter than machine learning
On June 1, 2017, Google introduced the "spreadsheet", a free spreadsheet application provided by the company,Data searchAnnounced that it added a natural language support function using machine learning technology to the function.
Visualize data instantly with machine learning in Google Sheets
https://www.blog.google/products/g-suite/visualize-data-instantly-machine-learning-google-sheets/
Google Sheets now uses machine learning to help you visualize your data | TechCrunch
https://techcrunch.com/2017/06/01/google-sheets-now-uses-machine-learning-to-automatically-visualize-your-data/
"Data search" is implemented in Google Spreadsheet, Google Docs, Google Slides, automatically analyzing the data contained in the document to suggest the optimal format, automatically graph It creates us. The new function of this time is to create a graph by simply inputting a natural language such as "sales prediction and real number of sales in line graph".
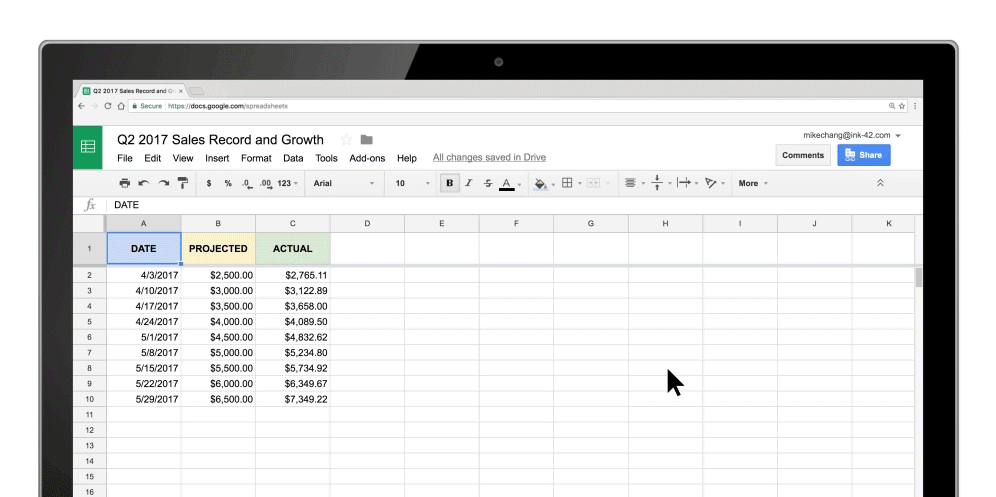
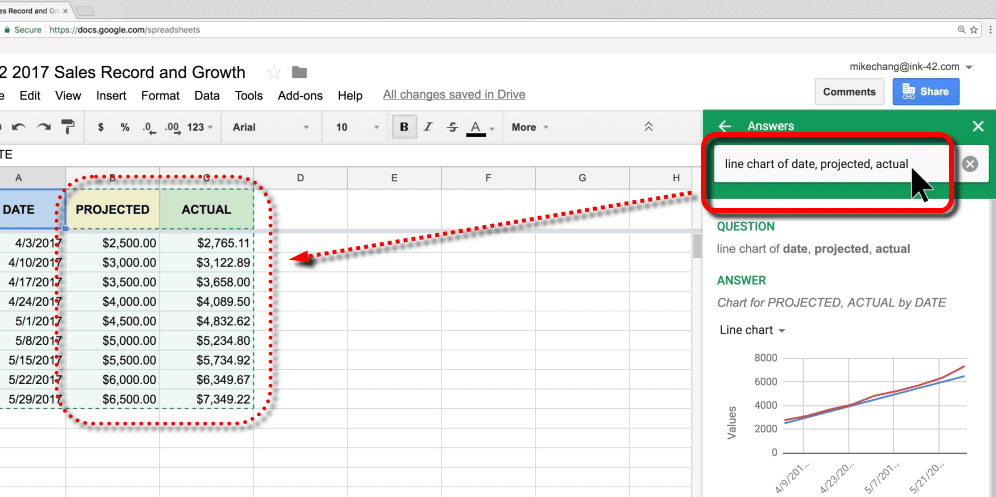
As an illustration, first the data corresponding to the cells written as "DATE (date)", "PROJECTED (expected number)" "ACTUAL (real number)" are entered in the sample spreadsheet.
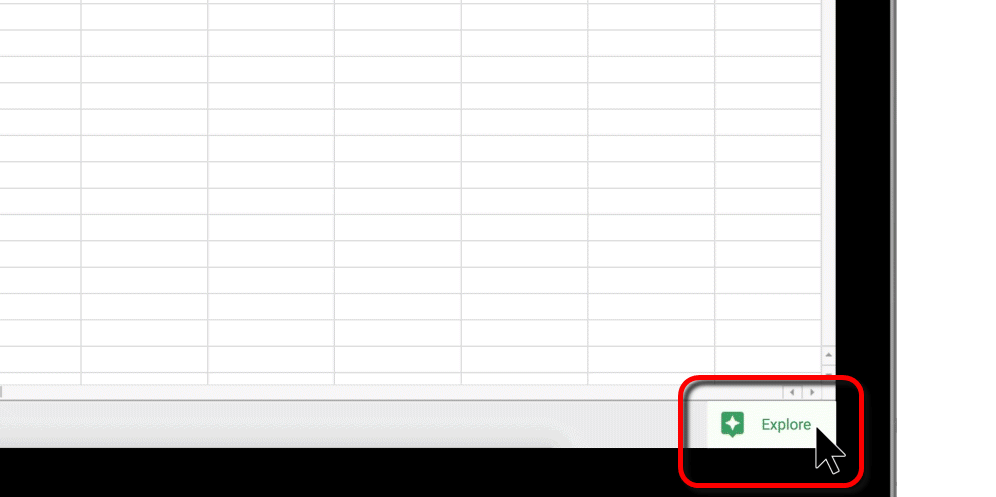
Click "Explore (data search)" in the lower right of the seat ......
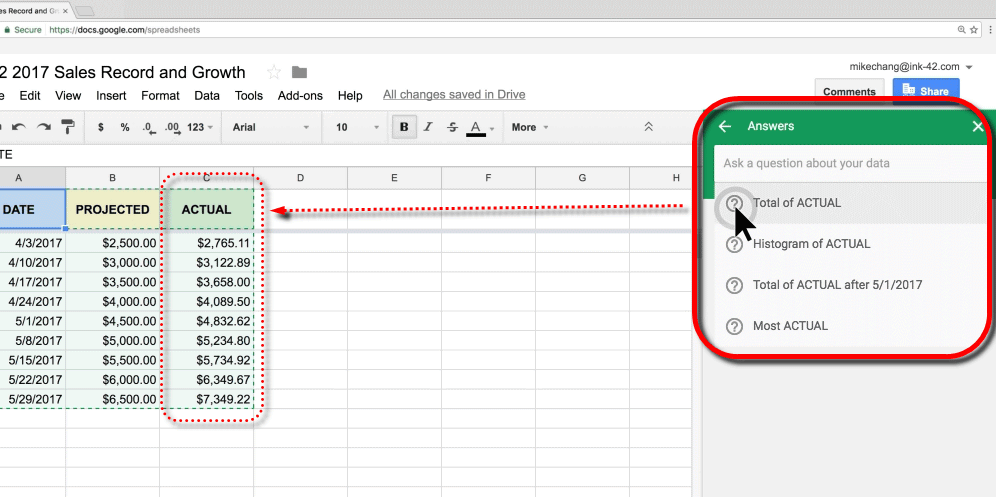
The tab of "Answers" is displayed, and the items which are likely to be candidates are displayed in it. Click on the item "Total of ACTUAL (sum of real numbers) ... ....
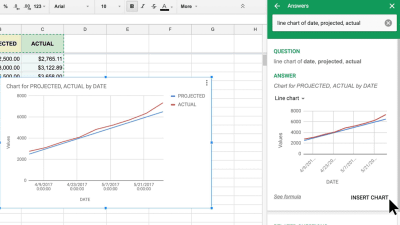
Just by entering "line chart of date, projected, actual (date, estimated number, real line graph)" in the above search window, it is possible to create a graph.
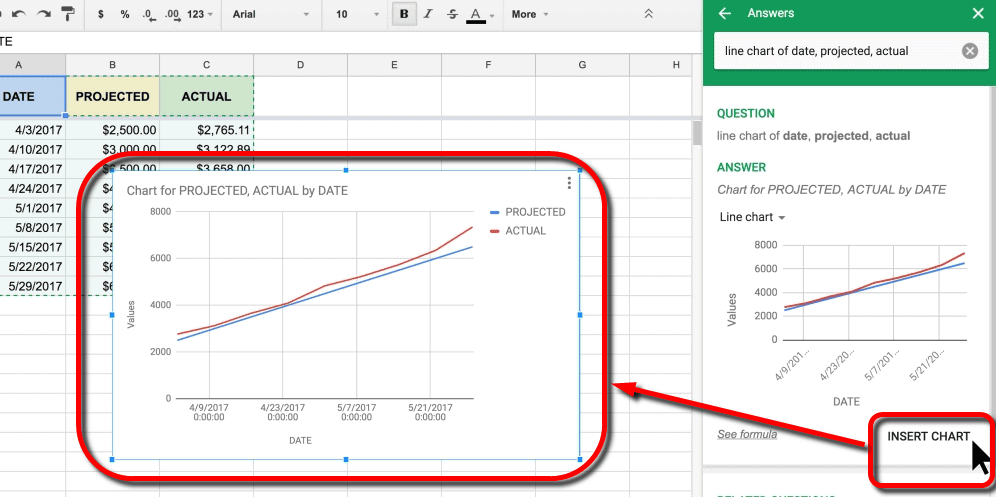
Finally, click "INSEART CHART (Insert graph)" to display the completed graphAdd in documentIt is possible to do. Previously, we needed to designate the range using the graph tool, but if you use the new function you just type the contents of the graph you want to create in words, then the Google spreadsheet will automatically It will take over work.
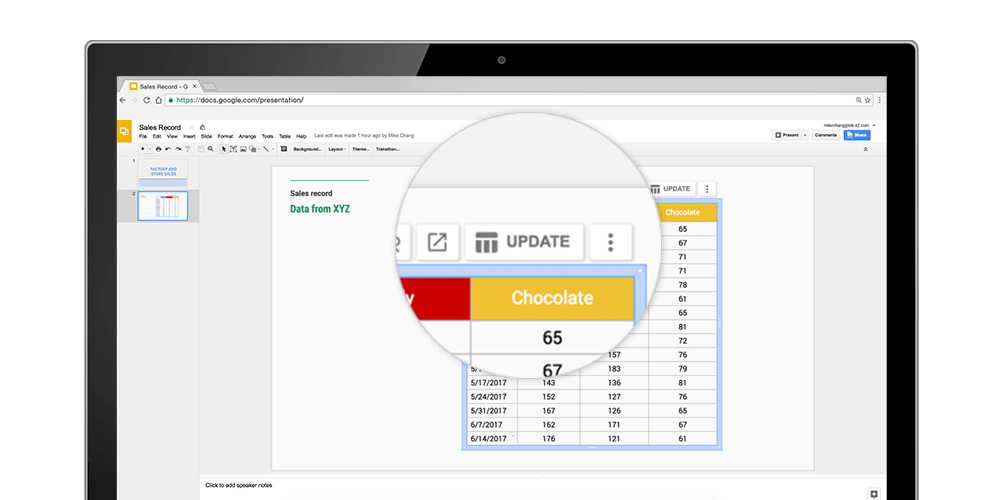
In addition, the data update function spread across spreadsheets, documents, and slides has also been enhanced. Even if you add a graph created with a spreadsheet to a slide, you can change it to a graph reflecting the latest data simply by clicking "UPDATE" (update) displayed on the graph.
Besides this, new functions include a page layout adjustment function when printing a created document, and function functions such as "GAMMADIST" "F.TEST" "CHISQ.INV.RT." Are implemented about. At the time of article creation, although it could not be confirmed that the Japanese version was available, it seems that it will gradually become available.
Related Posts:

in Web Application, Posted by darkhorse_log