Free application "Wi-Fi congestion checker" which can understand congestion status of wireless LAN access point at a glance

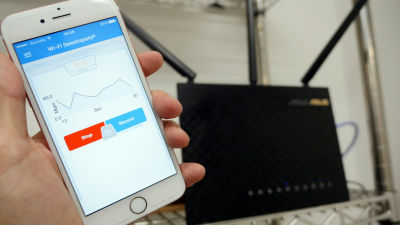
There are many terminals around the world that connect to the net via Wi-Fi (wireless LAN), such as personal computers, smart phones, tablets, game machines and home appliances. However, if there are access points for Wi-Fi and wireless LAN connection here and there, they interfere with each otherCommunication speed slows down,at the worst case,Can not connect to wireless LANCan also happen. An application that can easily check the crowd of wireless LAN at such time is "Wi-Fi congestion checker"is. It is an application dedicated to Android and analyzes radio wave congestion status in 5 stages.
Notice 2013 | Diagnose one's home Wi-Fi (wireless LAN) environment with a smartphone! The weather mark makes it easy to understand the congestion situation! | IODATA eye · data equipment
http://www.iodata.jp/news/2013/information/wi-fi_checker.htm
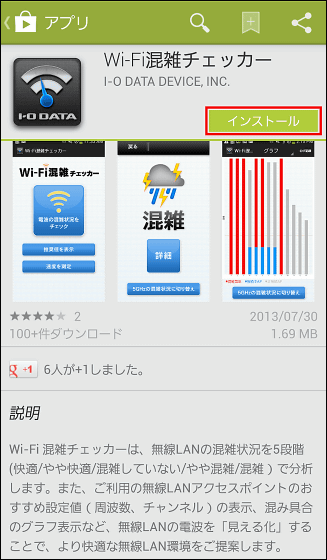
Google PlayInstall Wi - Fi congestion checker from.
Tap to launch.
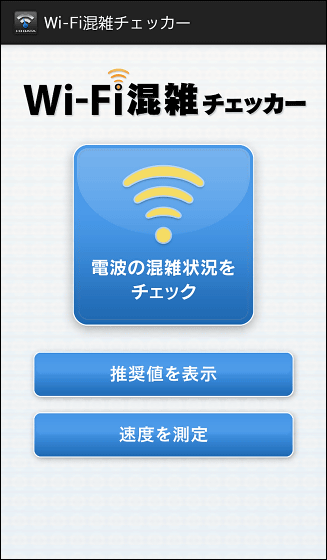
This is a Wi-Fi congestion checker.
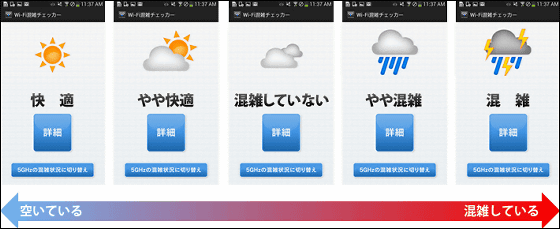
The degree of congestion of radio waves is represented by five weather icons, and the weather of the icon indicates that the better the radio condition is.
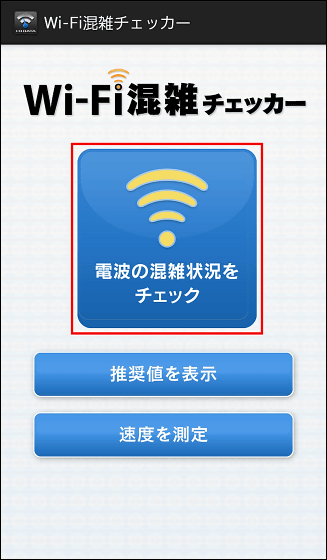
I will decide to actually use it and check the congestion situation of radio waves around me. Tap "Check radio wave congestion status" in the center of the screen.
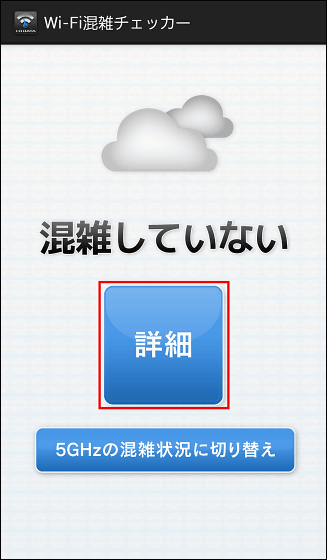
The radio condition of GIGAZINE editing department seems to be "not crowded". Tap "Details" to see details.
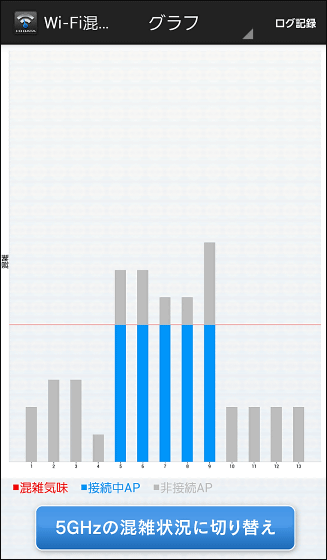
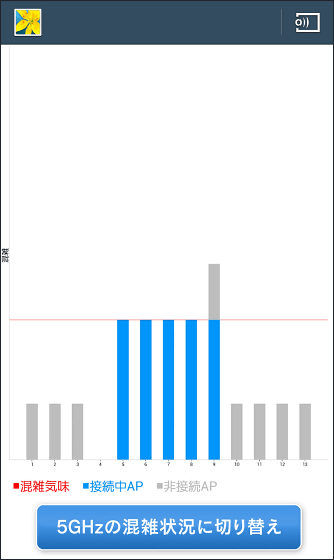
Then this kind of graph is displayed and you can see how many access points of wireless LAN exist in which channel. It is difficult to understand by graph only when "not crowded" ...
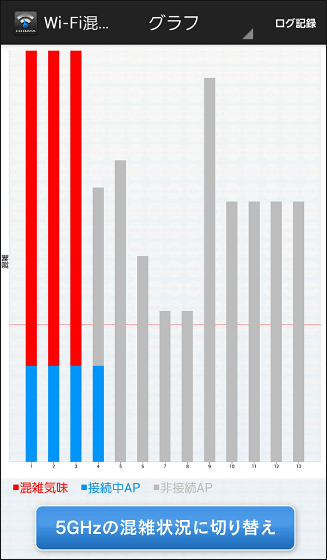
When trying with multiple wireless LAN routers started up, the radio wave condition became "somewhat crowded". When you look at the graph, you can intuitively understand that 1 to 3 channels lining up on the left side are crowded.
It is also possible to save a graph showing radio wave condition. To save, tap "Log record" at the top right of the screen.
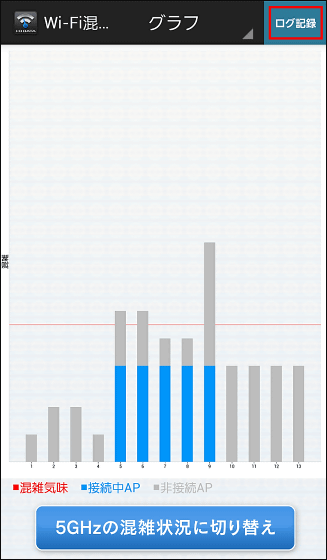
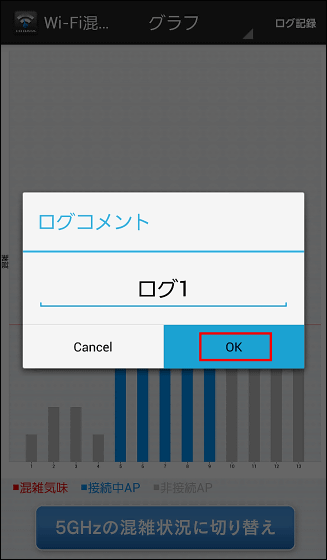
After entering the log comment and tapping "OK" it was saved.
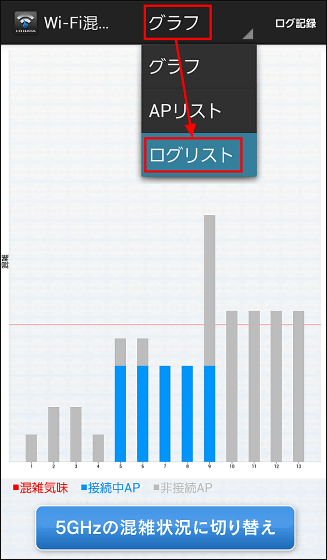
For the saved log, tap "Log list" from "Graph" at the top of the screen.
Since there was a log which I saved earlier, when I tap it ......
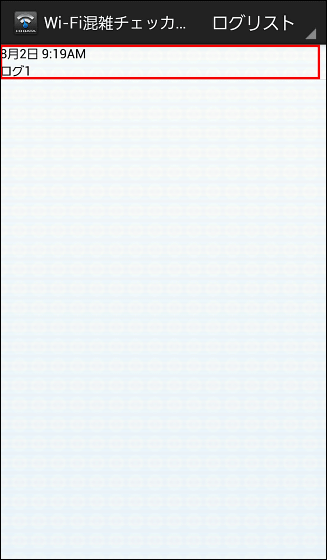
It is saved like this.
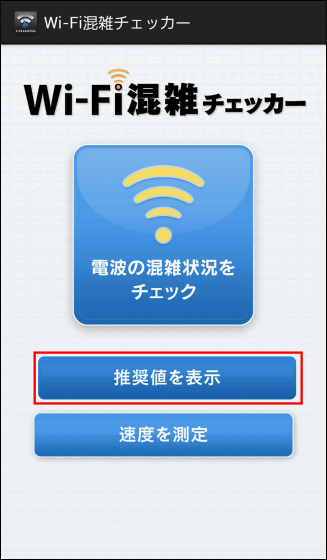
Furthermore, by tapping "Show suggested value" on the top page ... ...
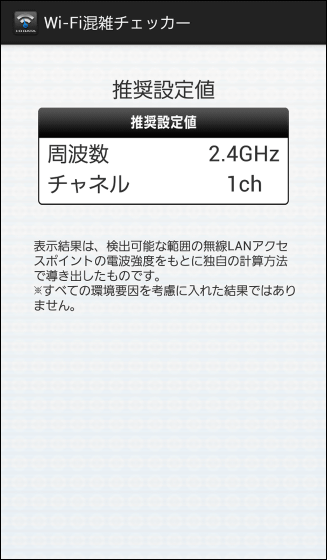
In order to prepare a comfortable wireless environment at the measured place, you can see which frequency and which channel the wireless LAN should be set to. In this case, the frequency is set to 2.4 GHz, and the channel is set to 1 ch.
There are absolutely no difficult settings and so on, it displays graphs in a very easy-to-understand manner, making it an application that makes it possible to use even those who say "I want to investigate but I do not want to do small difficult things".
Related Posts:
