Analyzing wireless LAN congestion and displaying it on a graph "Wi-Spy" real machine review
If the situation that "wireless LAN waves can not be received!", "Communication speed has slowed down" occurs at home or office, the cause may be radio interference. Wireless LAN compatible with PCs and smartphonesIEEE 802.11The radio band used by a / b / g / n isBluetooth,Zigbee,HomeRF, It is also used by audio equipment and it is crowded. Also, interference from nearby cordless phones, microwave ovens, wireless headphones, mobile routers, etc. can also cause slowdowns.
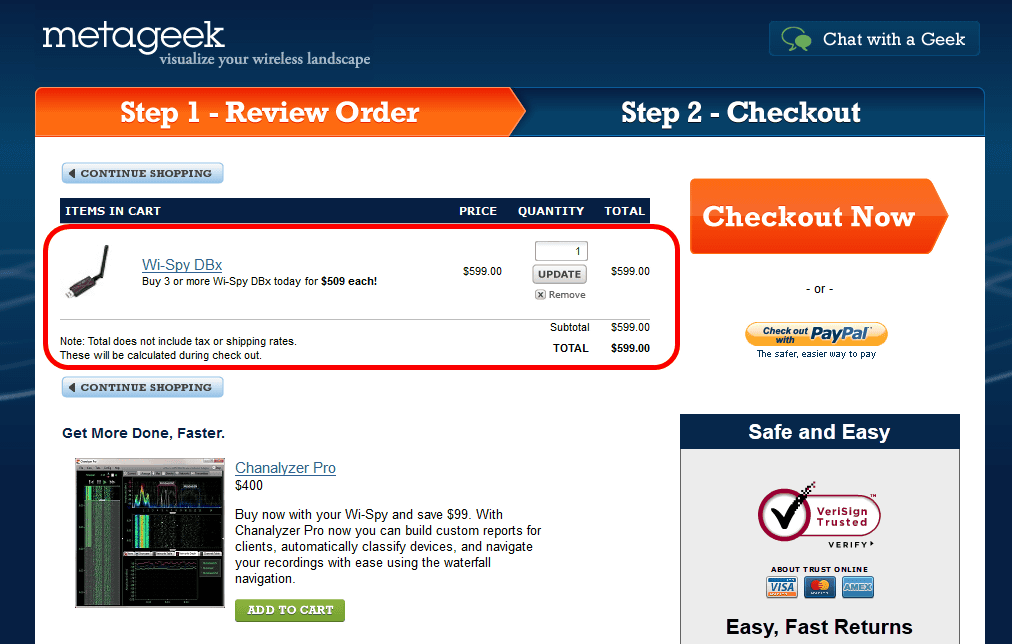
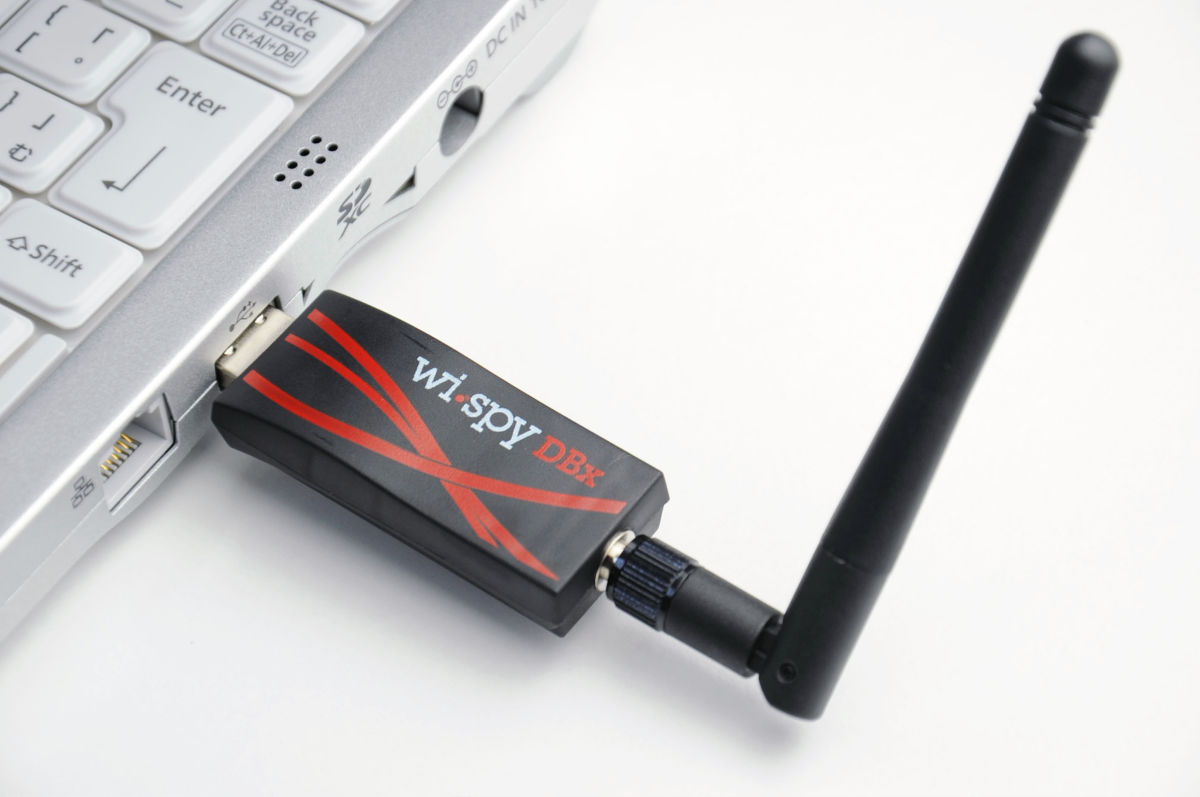
So when installing a wireless LAN it is better to grasp the surrounding radio conditions and choose an installation location with less interference. And in such a case it is convenient for Metageek to sell USB type radio wave analysis device "Wi-Spy DBx($ 599 / about 49,000 yen) ". Radio interference from not only other wireless LAN devices but also household appliances etc can be found so it is convenient.
Wi-Spy Spectrum Analyzer by MetaGeek, makers of inSSIDer | MetaGeek
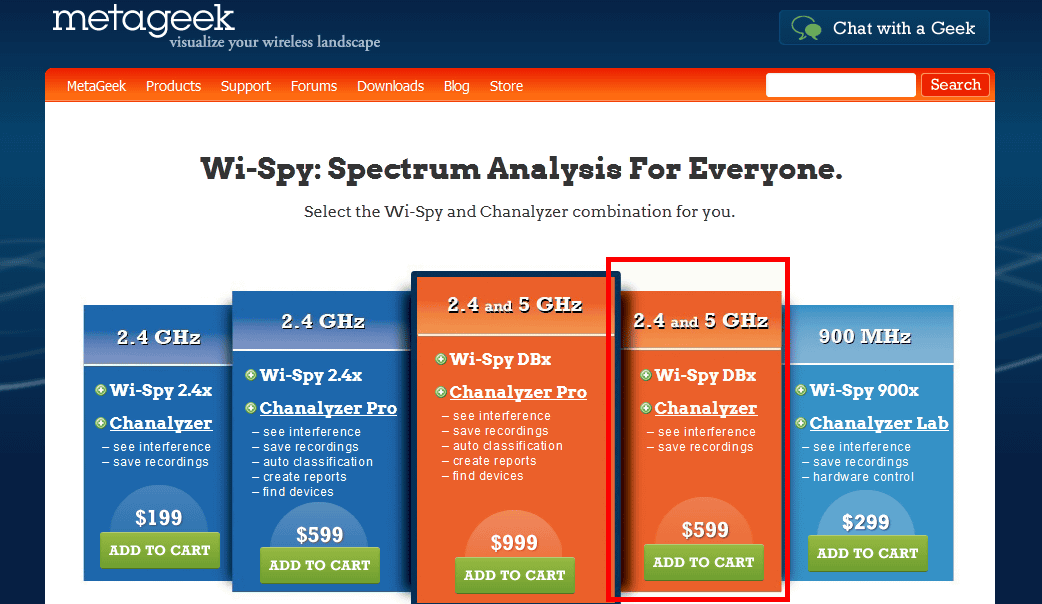
Although it is a site of the United States, we also ship to Japan, and the price including shipping fee is $ 635.32 (about 51,000 yen).
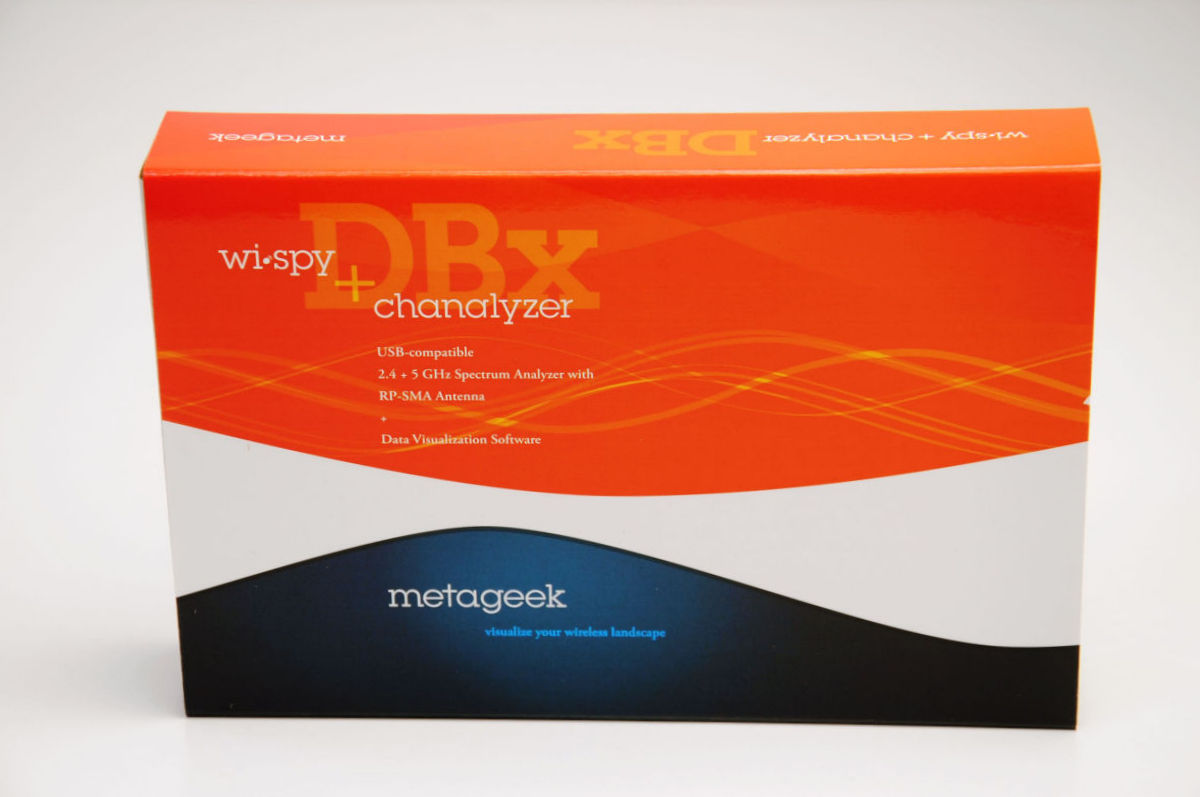
◆ Photo review
Arrived by international post.

The package looks something like this.
When opening with "Pakkatu" there is an antenna used to receive radio waves.
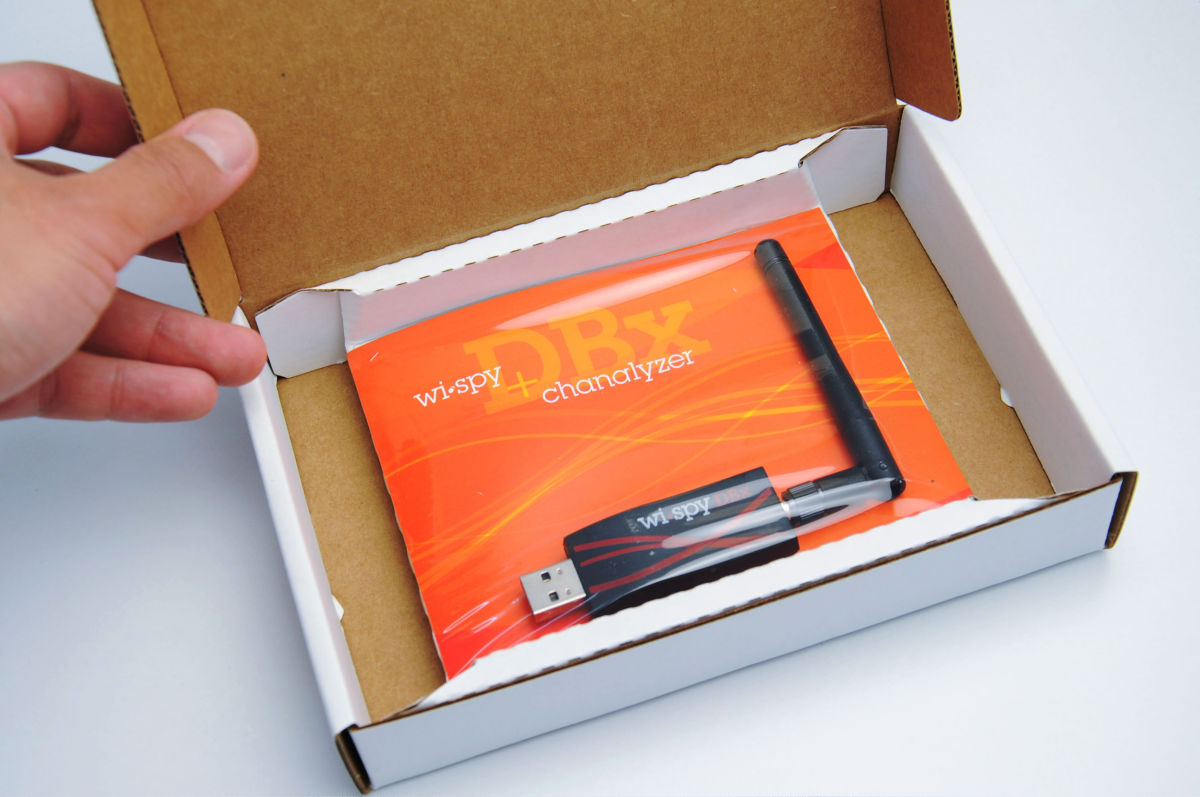
The contents are the paper on which the main body and software installation CD and precaution notes are written.
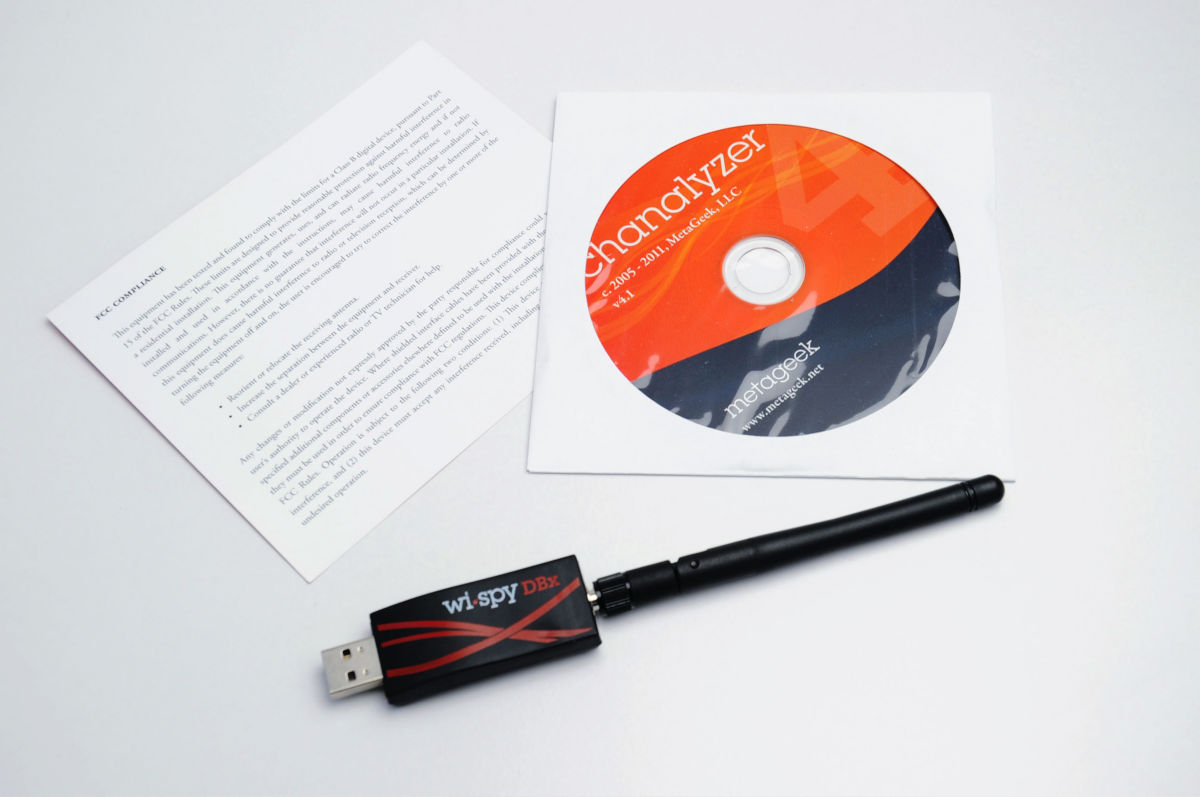
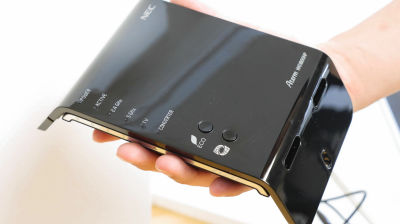
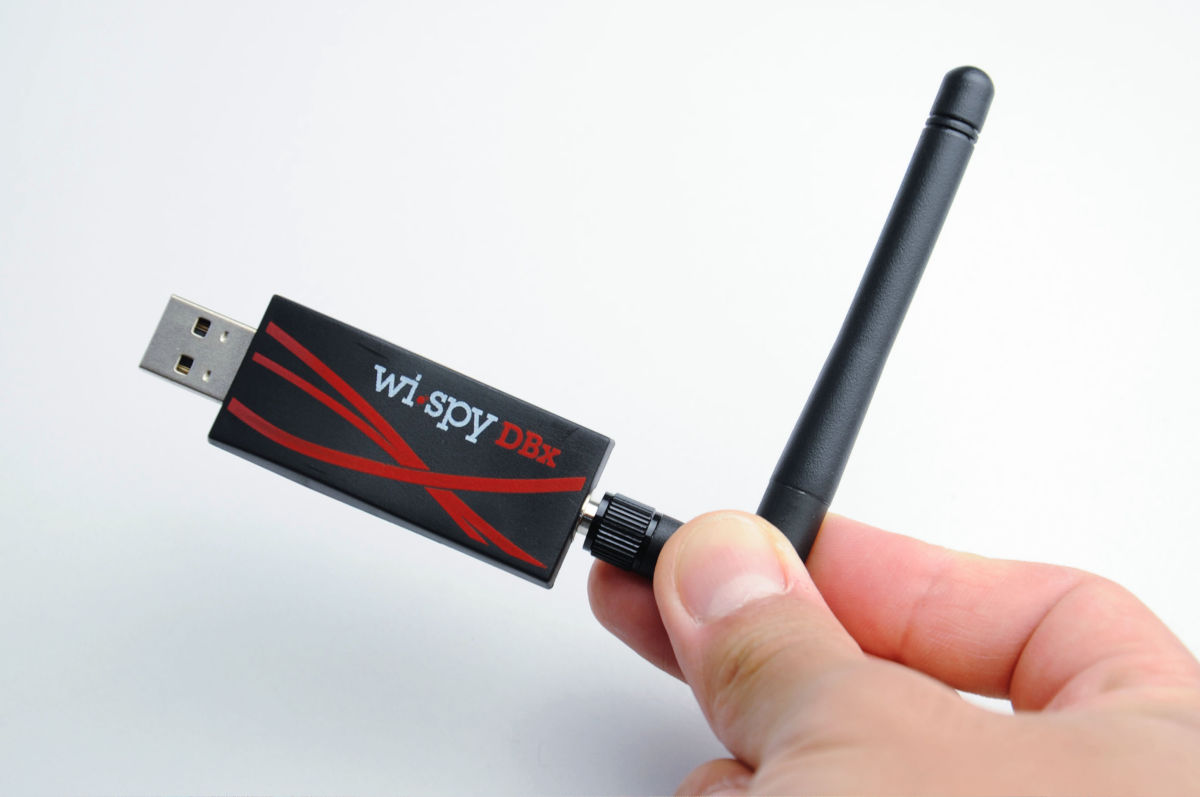
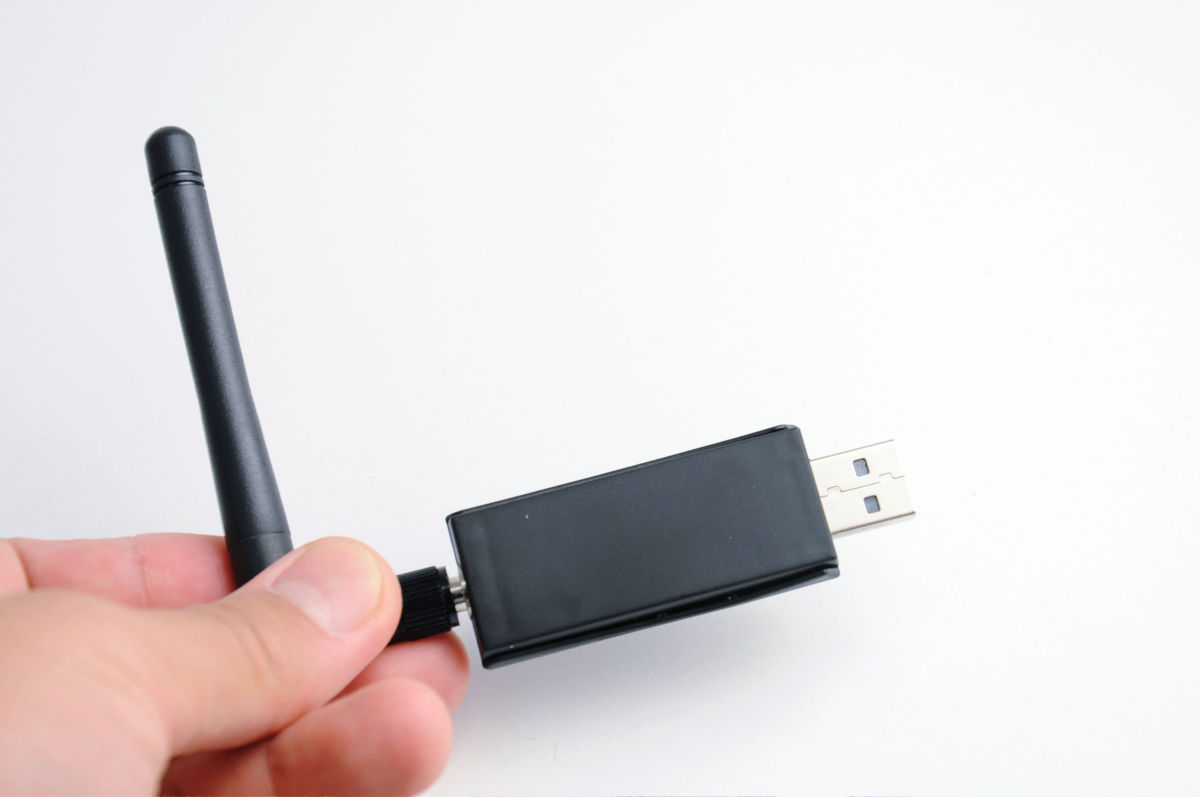
The appearance seems to have caused the antenna to grow in a slightly larger USB memory.
The receivable bandwidth is 2.400 to 2.495 GHz and 5.150 to 5.850 GHz.
Angle can be adjusted in 3 levels of antenna.
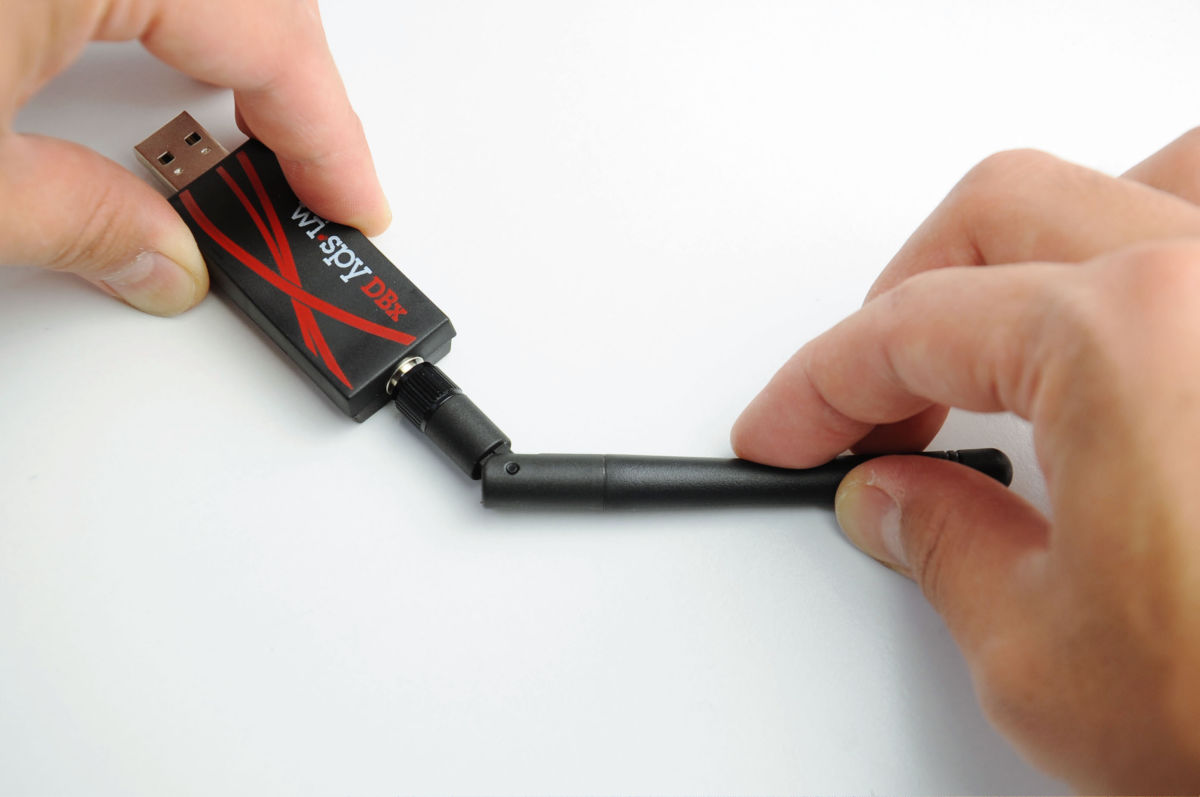
Connect to the USB terminal of the PC and use it as follows.
◆ Installation
To analyze radio waves, special software "Chanalyzer 4"Installation is necessary. You can also get the installer from the included CD, but it is easier to download the latest version from the site of the selling source because it saves the trouble of updating. The corresponding OS is Windows 2000, XP, Vista, 7.
When you access the following page, the download starts automatically.
Chanalyzer 4 Download | MetaGeek

Double-click the installer to launch
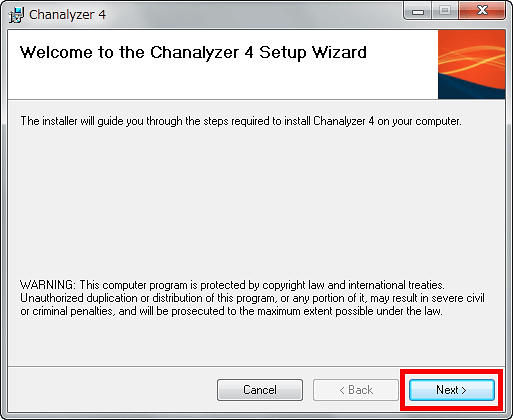
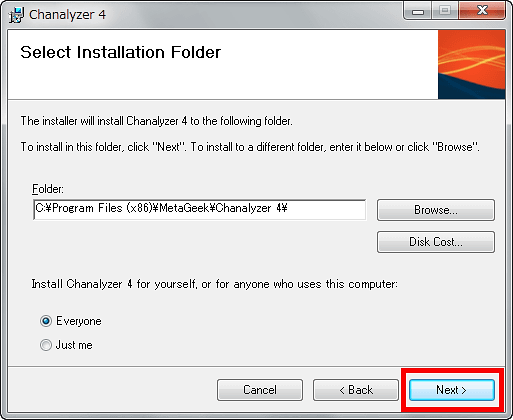
Click "Next"
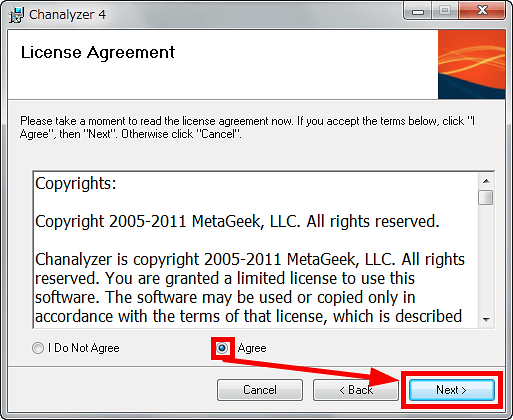
Check "Agree" and click "Next"
Click "Next"
Click "Next"
Installation will proceed automatically as follows
Click "Close" to complete installation
◆ I tried using
By activating "Chanalyzer 4" on a PC connected "Wi-Spy" you can check the surrounding radio conditions in the snow.
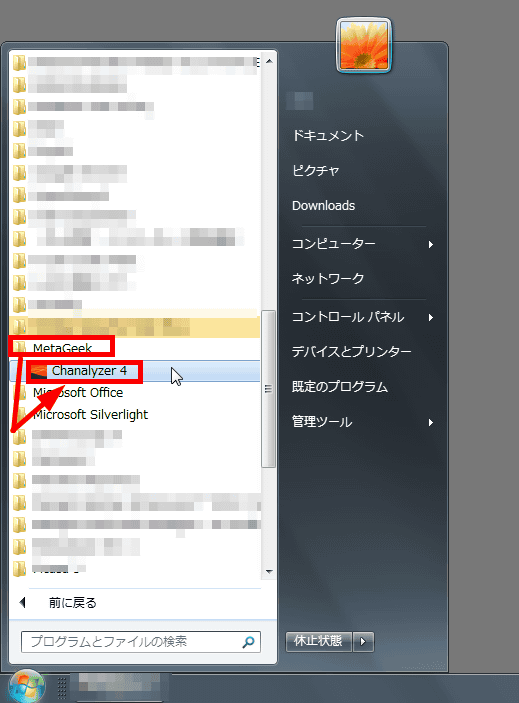
Open "All Programs" from the start menu and click "Chanalzer 4" in the "MetaGeek" folder.
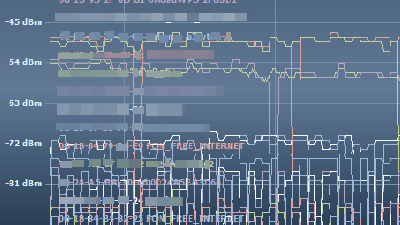
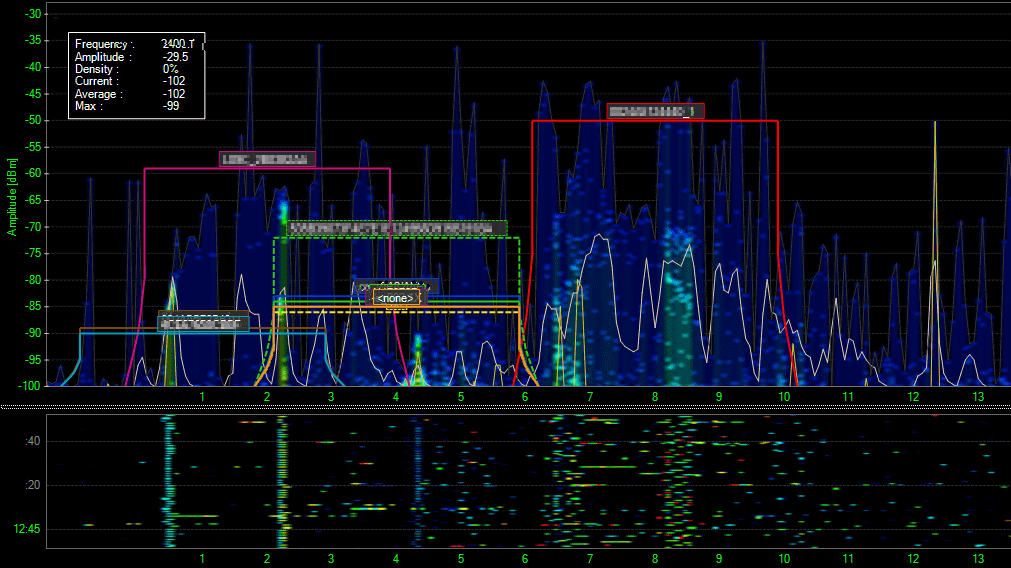
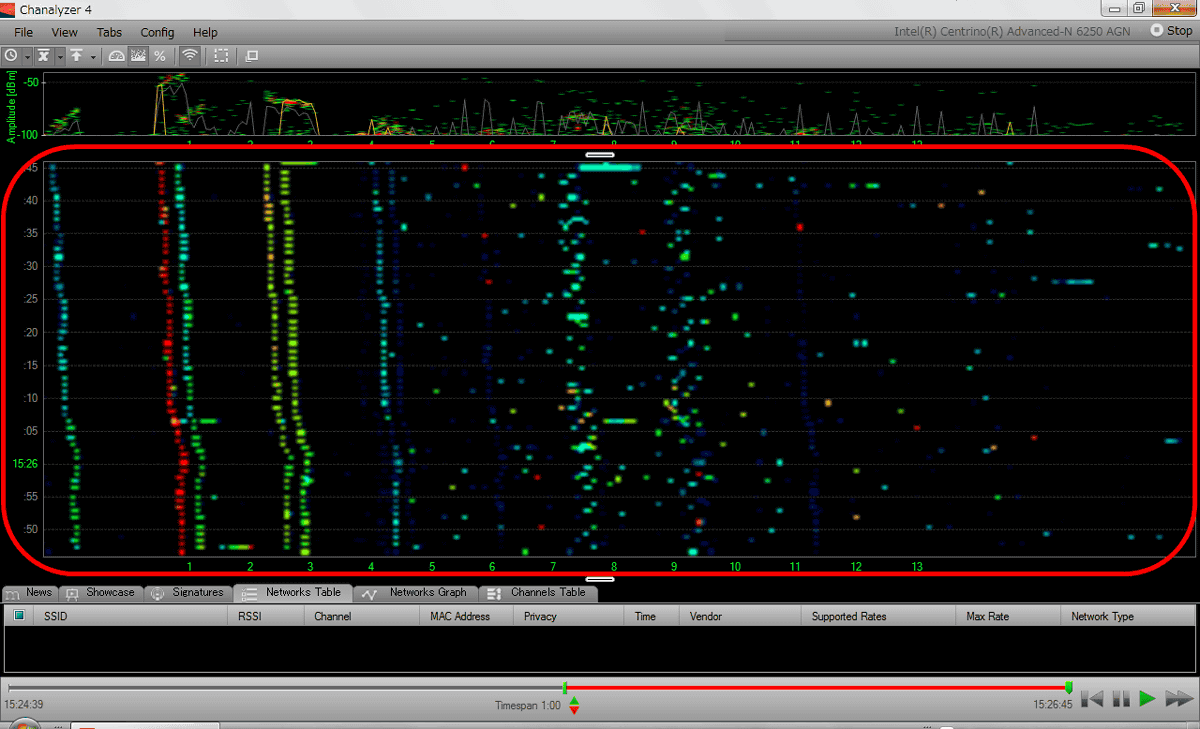
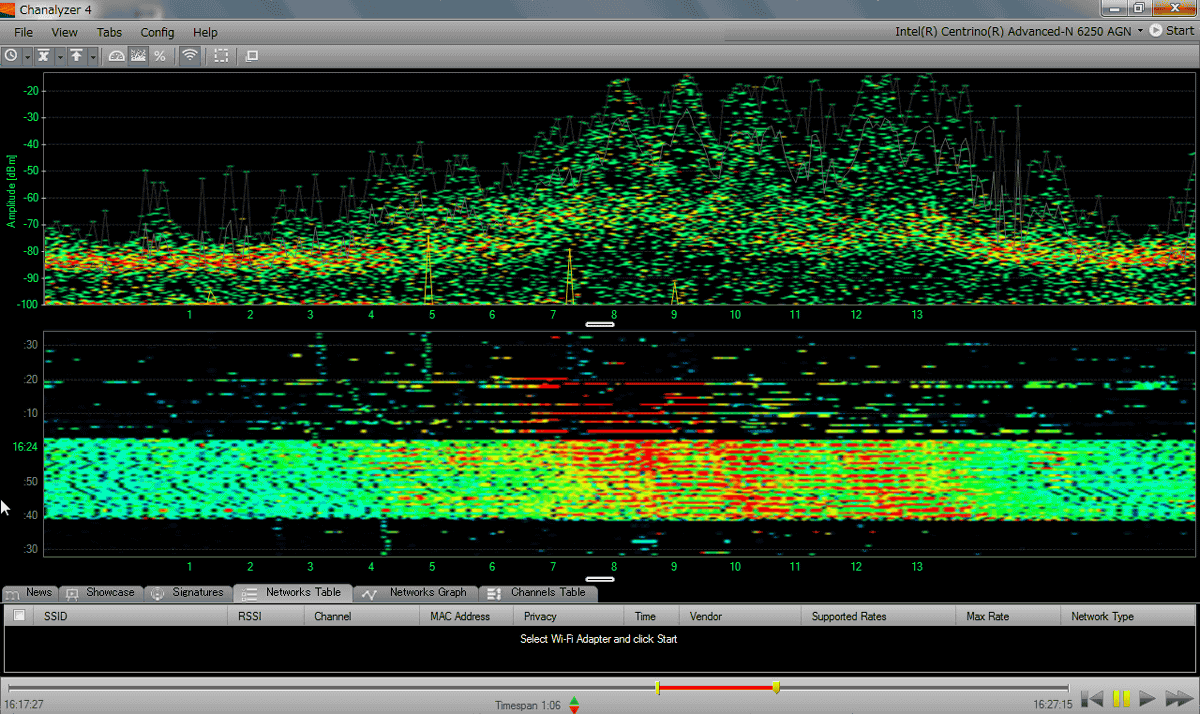
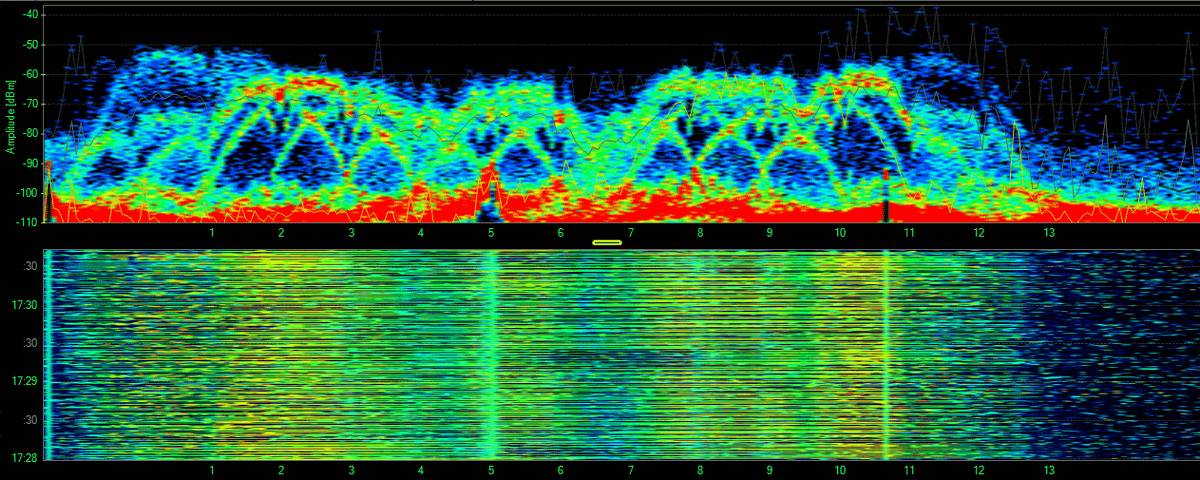
The screen at startup is as follows. The lower row shows the list of access points in the surrounding area.
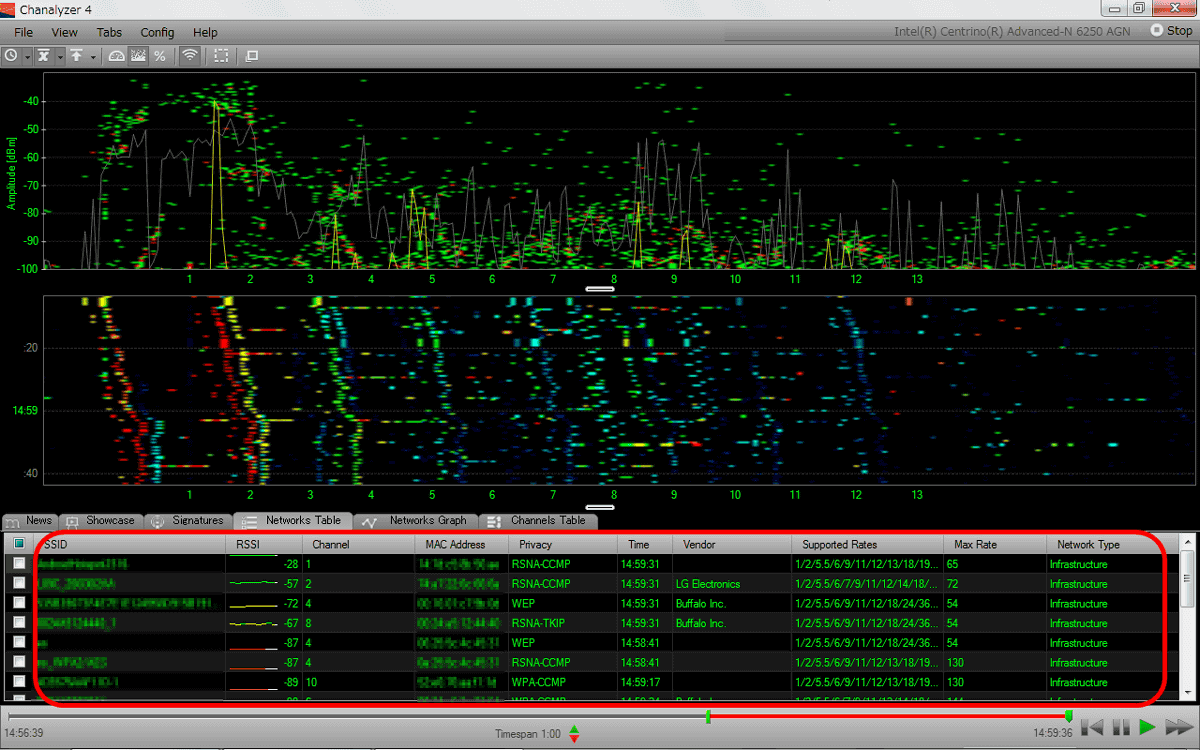
In the upper graph, the vertical axis is the frequency, the horizontal axis is WiFi channel, and the red dot is the place where particularly strong radio waves are detected.
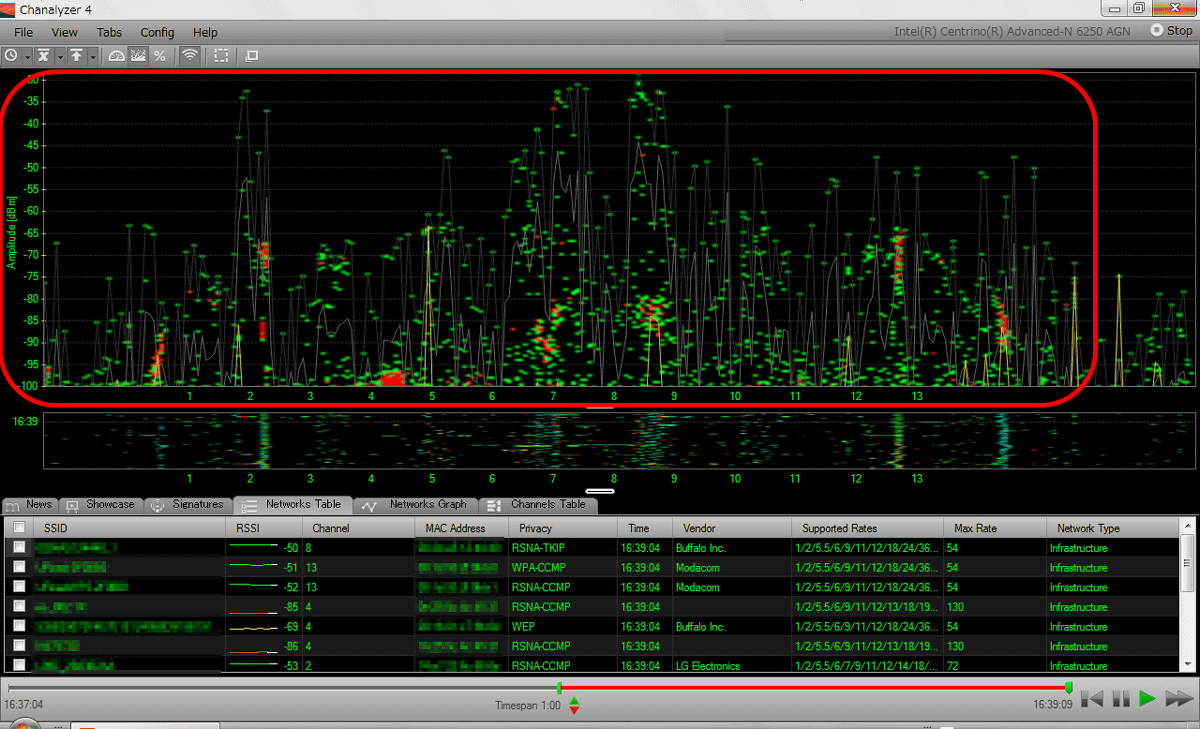
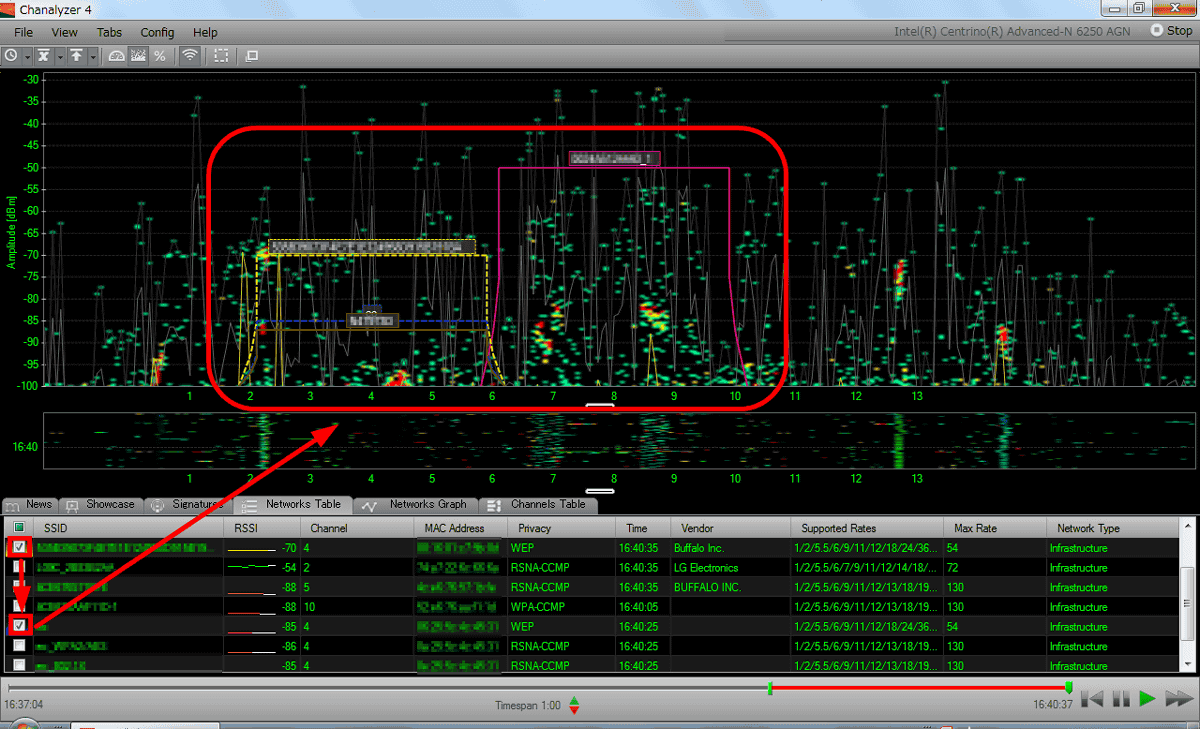
Select the item you want to display from the list of access points and check it, enclose the upper graph and you can see which access point corresponds to which area. In the image below, you can see at a glance that there are relatively few interferences, such as 11 channels, while there are multiple access points using 4 channels.
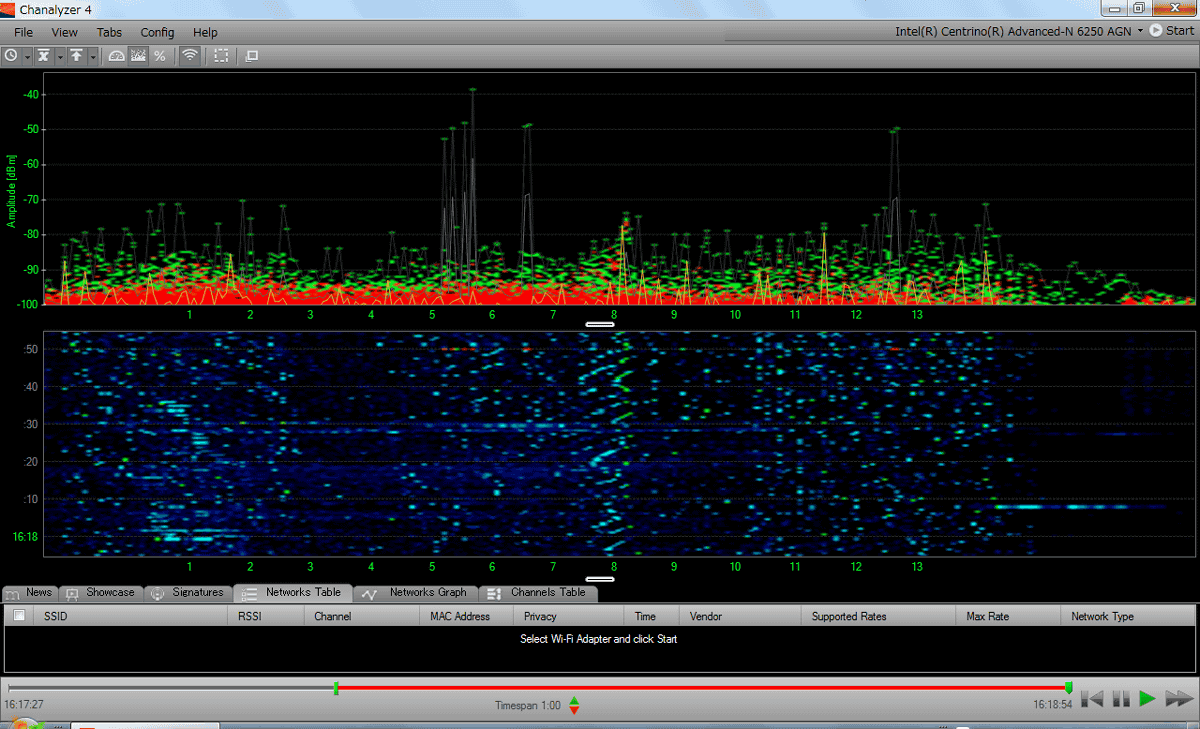
Also, in the lower graph, which channels are detecting strong radio waves in chronological order is displayed. In the image below, you can see that around 6 or 10 to 13 channels are empty.
If you use a cordless phone etc in the vicinity as follows ... ....
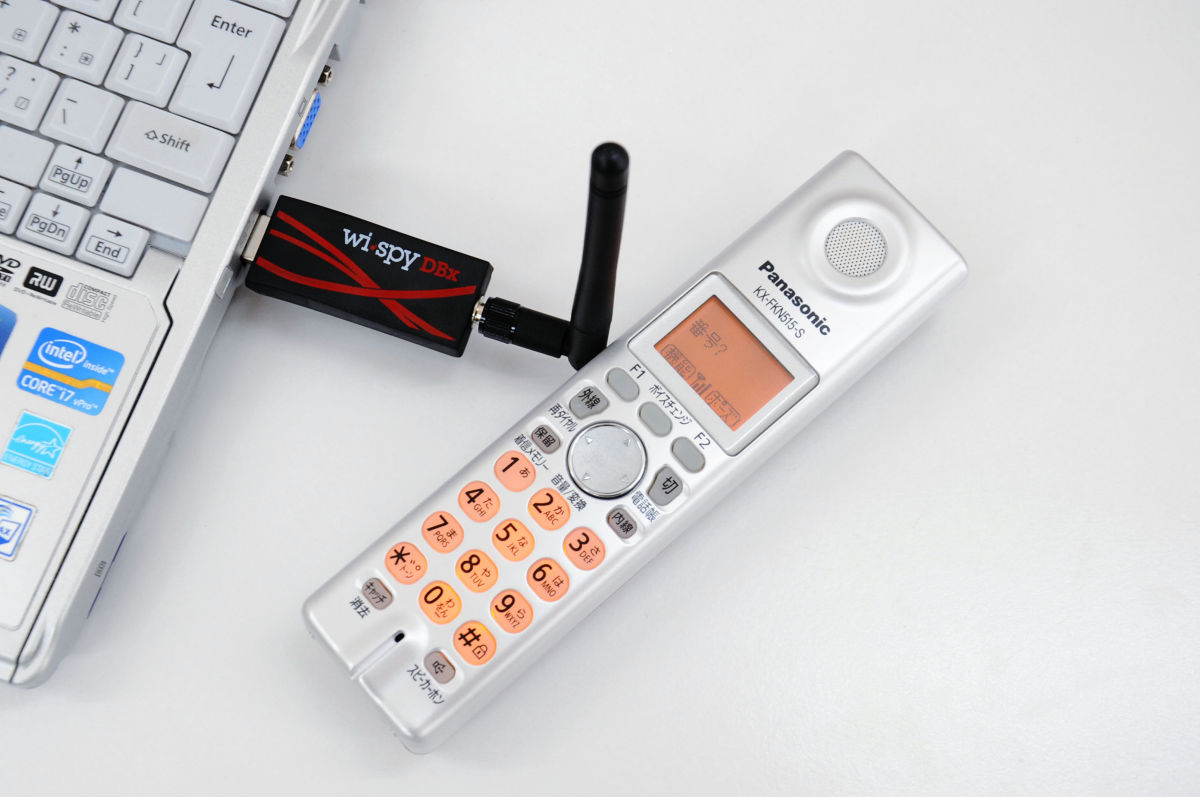
Dots are displayed across almost all channels, indicating that interference has occurred.
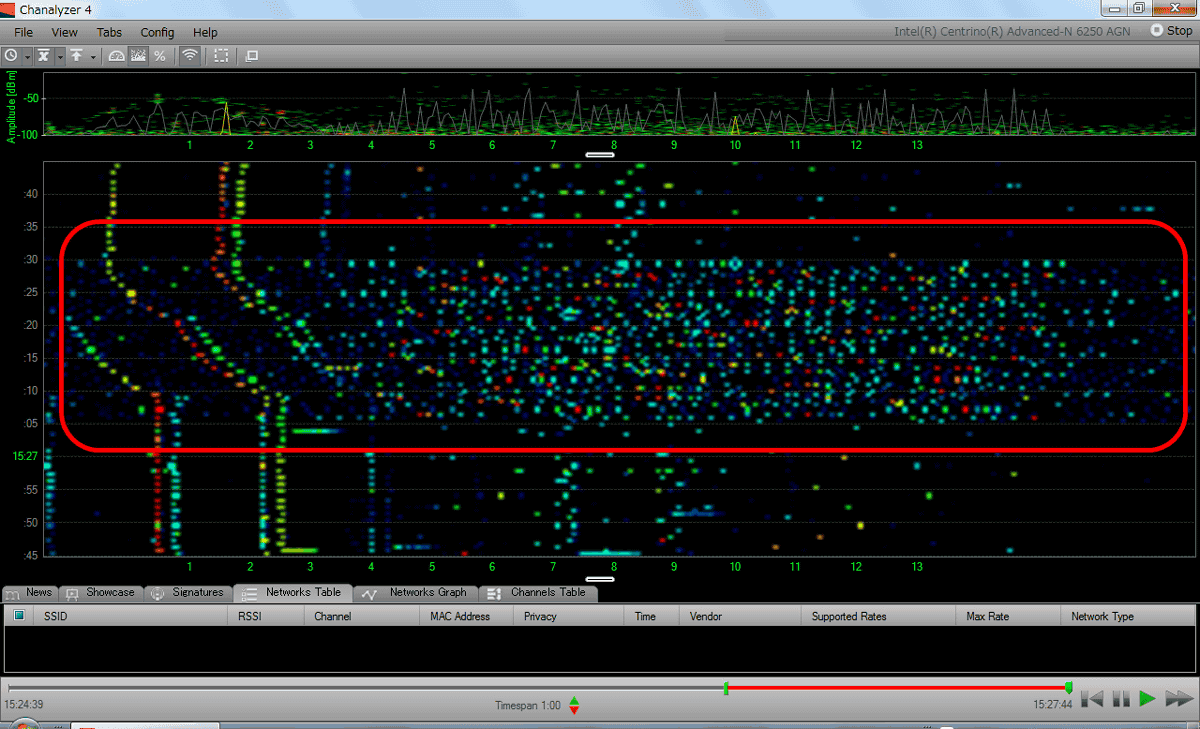
When I try to approach the operating microwave oven ... ....
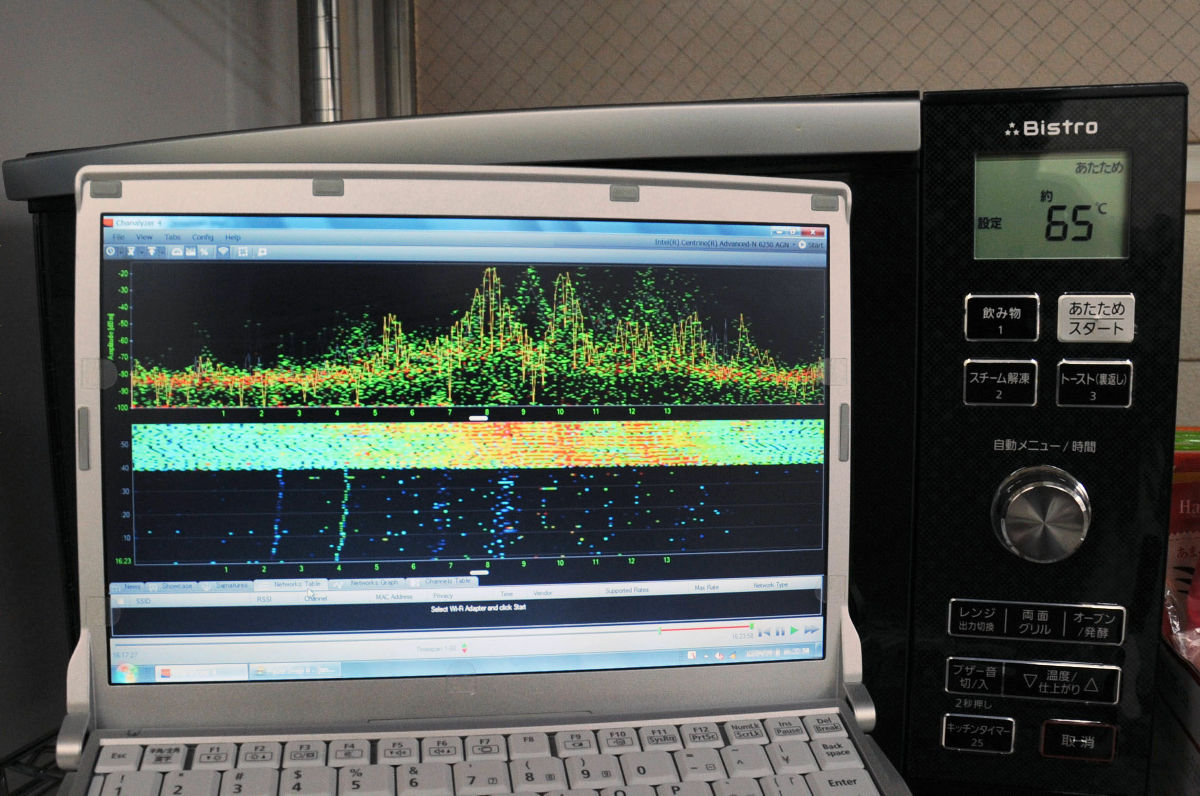
All channels are subject to very strong interference.
By the way, when I got outdoors and measured it ... ....
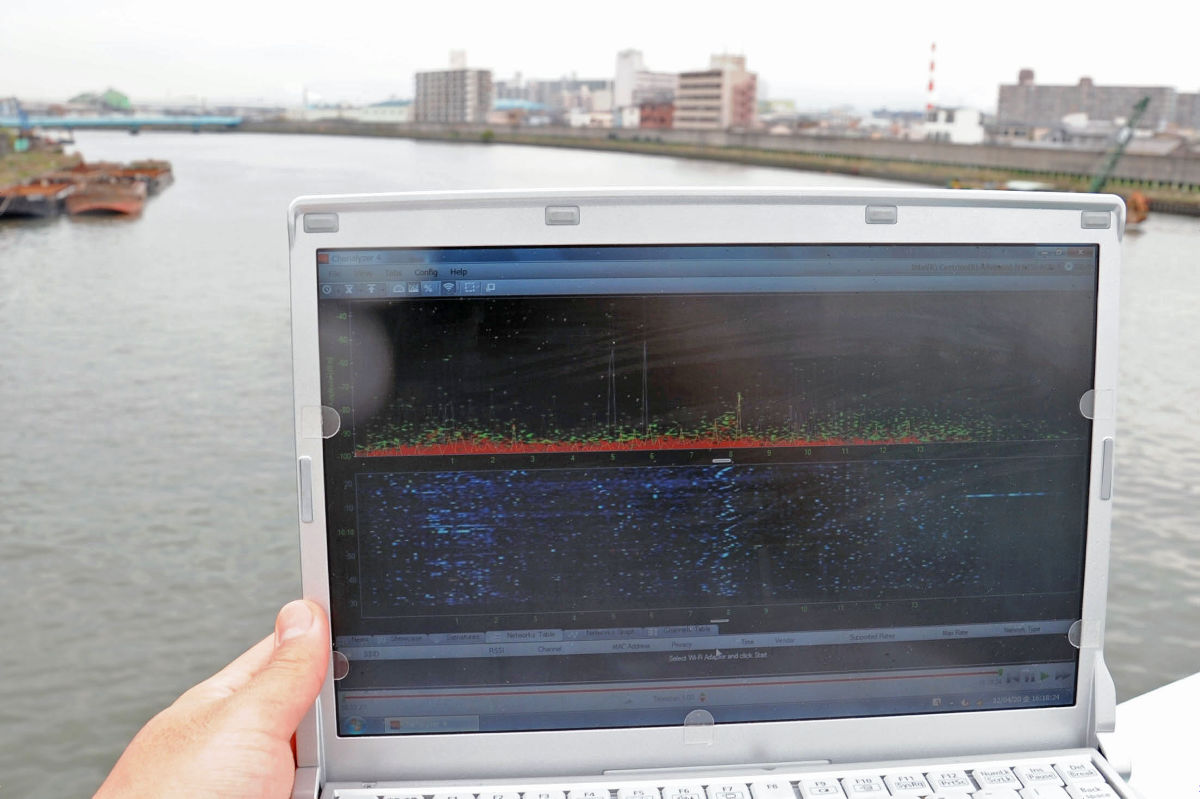
It is not that strong, but you can see that all the channels are picking up the radio waves.
Also, by moving the slider at the bottom of the screen, you can display the graph for any period, so you can specify the time when the radio wave is disturbed retroactively. It will be possible to make predictions such as "Because microwave ovens used for cooking may be due to frequent noise before meals."
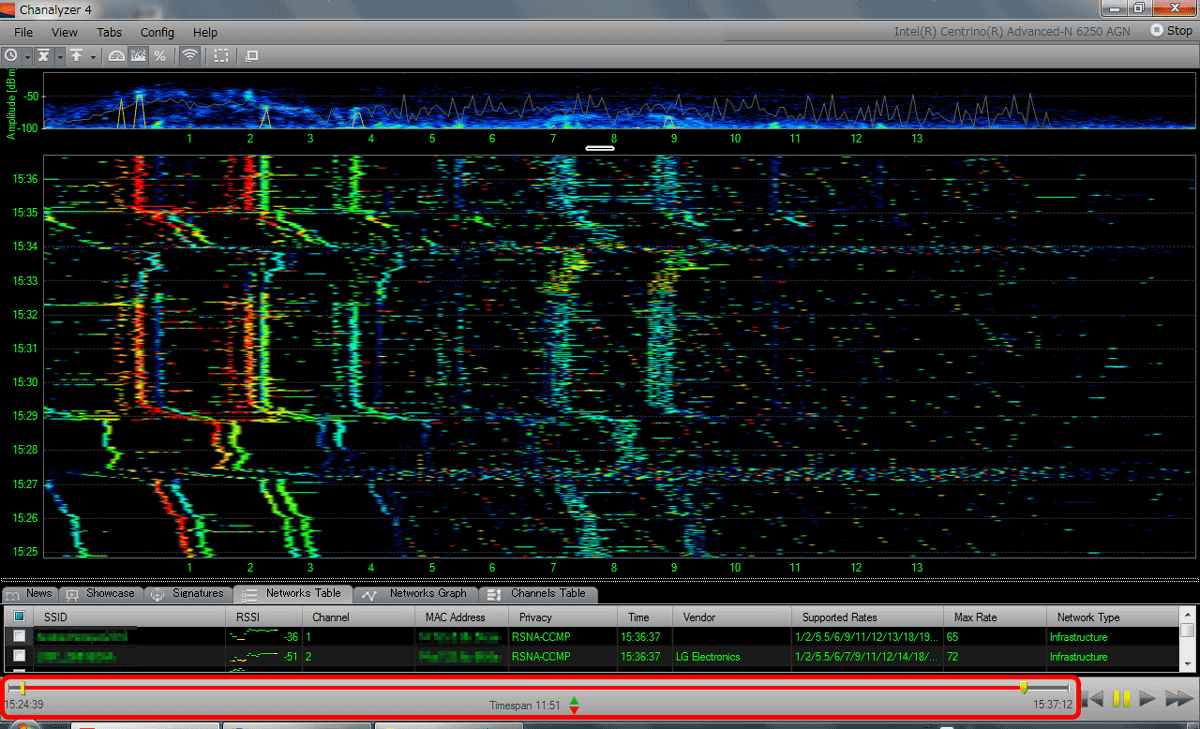
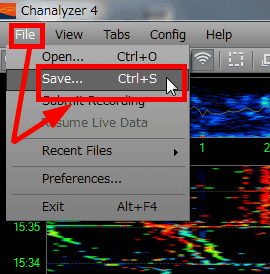
You can save these graphs by selecting "Save" from "File".
Also, in software, samples of typical graphs are recorded, and it is possible to reproduce the data.
The following is a case where a strong wireless LAN is using 6 channels.

When all the channels are crowded, it looks like this.
The version seems to be different, but the movie using "Chanalyzer 4" can be seen below.
Chanalzyer 4 improvements - YouTube
If you want to accurately grasp the condition of radio waves around your home or office when setting up a wireless LAN, please consider purchasing.
Related Posts: