`` Homedale '' that you can see the radio field strength of wireless LAN access points at a glance for free
Homedale is a useful software to check how strong the radio waves of your mobile router and wireless LAN router are. If you use this, you can display the transition of the radio wave intensity as a graph, you can instantly judge whether the radio wave is stable. In addition, it is easy to check for channel interference that causes unstable radio waves. Homedale's operation procedure is as follows.
Homedale :: Wi-Fi / WLAN Monitor-the sz development
◆ Download and launch
Click 'Download Homedale.zip' on the above site.

Unzip the downloaded ZIP file with

◆ How to check the signal strength of wireless LAN access point
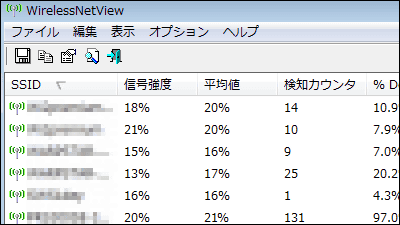
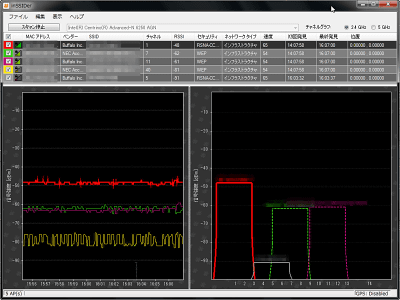
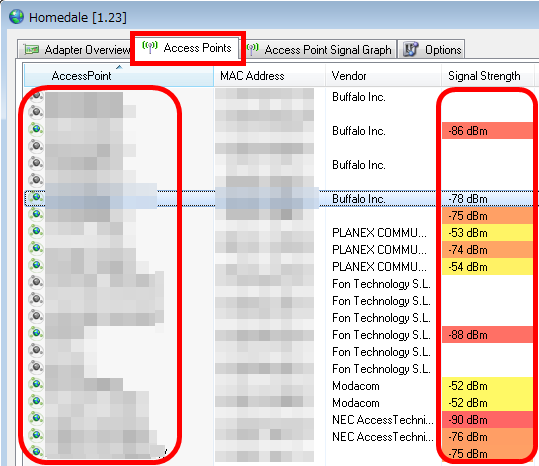
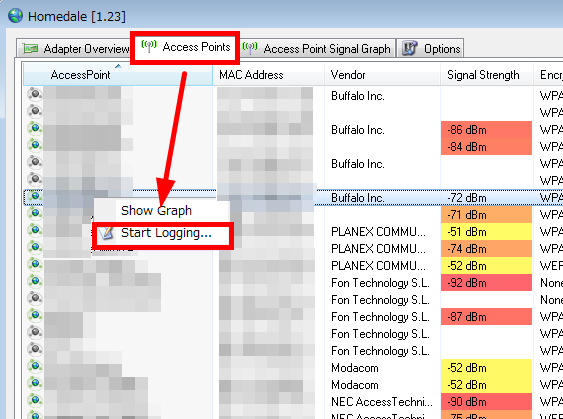
When you click the 'Access Points' tab, the wireless LAN access points are displayed in the left red frame, and the signal strength is displayed numerically in the right red frame. The signal strength is stronger as the value of 'Signal Strength' in the right red frame is closer to 0, and red is weaker.
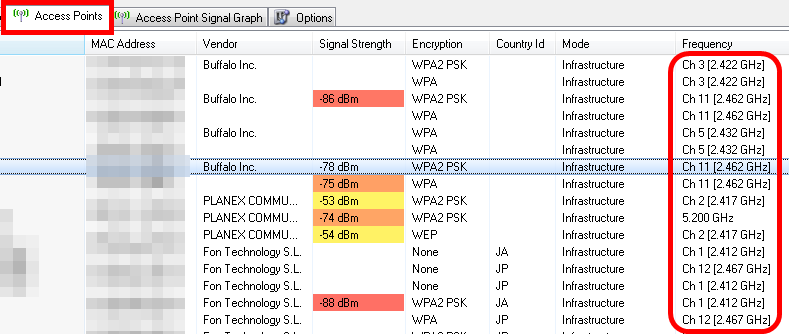
You can check the channel interference from 'Frequency' on the 'Access Points' tab. If there are many channels that are the same as the wireless LAN point that you are using, communication will be unstable.
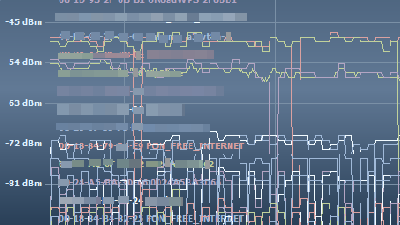
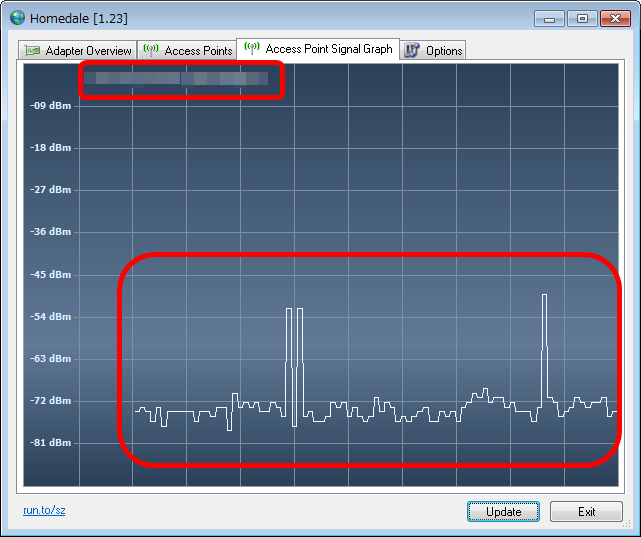
If you want to check the signal strength on the graph, right-click the wireless LAN access point you want to graph on the 'Access Points' tab and click 'Show Graph'.

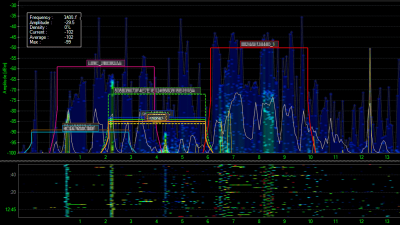
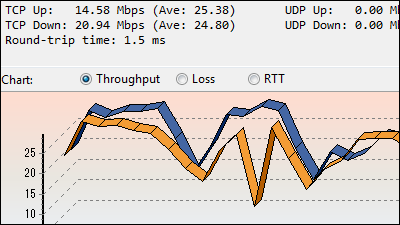
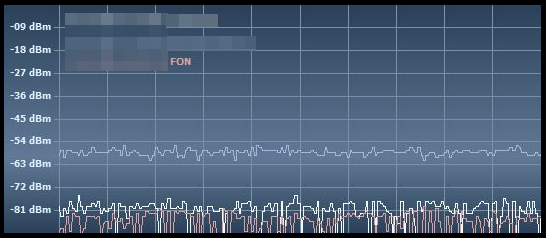
Changes in the signal strength of wireless LAN access points are reflected on the graph at any time.
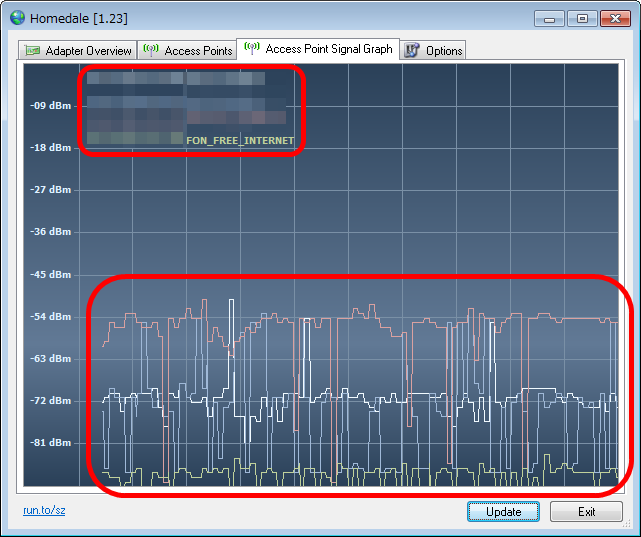
It is also possible to compare the signal strength by adding several wireless LAN access points.
In addition, you can collect the change of the presence or absence of the radio wave of the wireless LAN access point as a log. First, click the 'Access Points' tab, just right click on the wireless LAN access point and click 'Start Logging ...'.
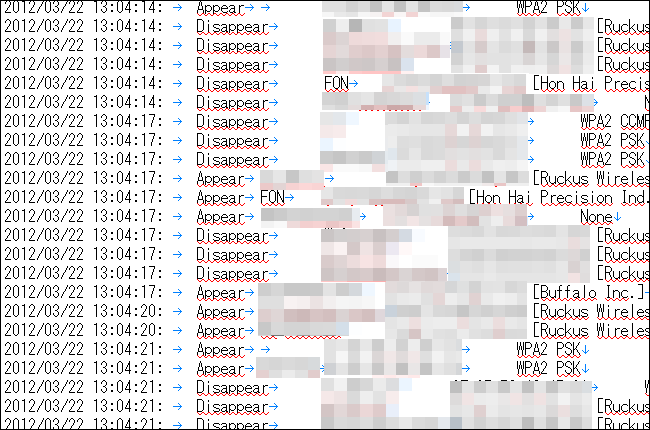
The log is saved in a text file.
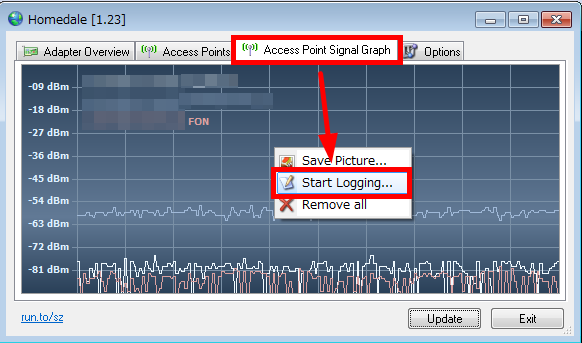
You can also save the signal strength graph display of the wireless LAN access point as an image.
Click the 'Access Point Signal Graph' tab, right-click on the displayed graph screen, and click 'Save Picture ...'.

You can save as follows. You can select and save any of JPEG, PNG, TIF, GIF, and BMP formats.
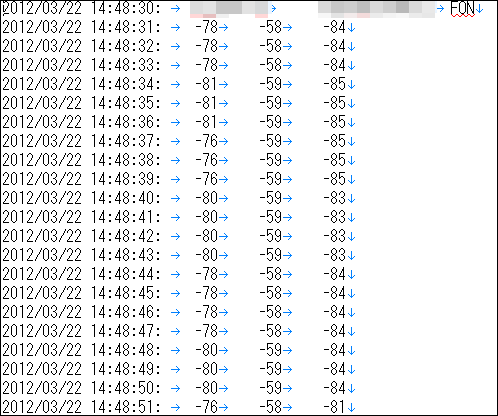
In addition, a log of the signal strength of the wireless LAN access point displayed in the graph can be collected. Click 'Access Point Signal Graph', right-click on the displayed graph screen, and click 'Start Logging ...'.
The log is saved as a text file as shown below.
Related Posts: