Free software 'inSSIDer' that is useful for investigating the cause of unstable wireless LAN 'channel interference'

For some reason, the system that discovers wireless LAN access points, which is installed as standard in Windows, lacks the function to display channels, and as a result, when you notice it, the wireless LAN channels are actually interfering and unstable. Then, the connection is broken, the speed is not increased, and so on.
Some wireless LAN access points will automatically search for a free channel that does not interfere with the surroundings, but if it is not such a device, you need to change the setting manually. This free software 'inSSIDer ' can be used in such cases. It lists the wireless LAN access points in the surrounding area and also displays the channel and signal strength, so it is like 'Is this new access point in the neighborhood making it unstable?' You can tell just by looking at it.
Download and install, how to use, and what is channel interference in the first place? If there is channel interference, which channel should I use? The explanation of such things is from the following.
MetaGeek | inSSIDer --Defeat Slow Wi-Fi
Click the download button from the above page to download the installer

Launch the installer
Click 'Next'

Click 'Next'

Click 'Next'

Click 'Close'

This is the initial screen

First, specify the wireless LAN adapter. Since I used Let's Note this time, I chose the built-in wireless LAN 'Intel Centrino Advanced-N 6250 AGN'. If you're not sure which one, it doesn't break, so try it from the top of the list and you'll hit it.

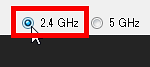
Next, select the wireless LAN frequency band. Select 2.4GHz for IEEE802.11b and IEEE802.11g, and 5GHz for IEEE802.11a. For IEE802.11n, both 2.4GHz / 5GHz are used, and depending on the device, only 2.4GHz or only 5GHz may be used. I chose 2.4GHz this time because it can be switched at any time during scanning.
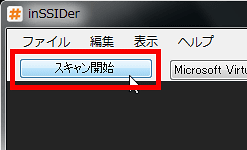
Click the 'Start Scan' button when the settings are complete
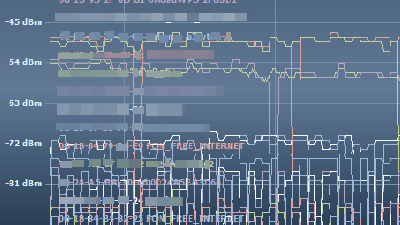
In this way the graph will start to appear at the bottom of the window. The channel graph is displayed on the lower right. Each access point name is displayed above the channel graph, and it is color-coded so you can easily see which access point you are using.

It has grown gradually ...

You can also highlight it, just select the access point name you want to highlight from the list above and click

The graph on the left shows how the signal strength changes over time. The smaller the number on the vertical axis (the higher the graph goes), the higher the signal strength. If '-10dBm' and '-90dBm', '-10dBm' is stronger. And the more this graph shakes up and down, the more unstable it becomes. You can see the channels by looking at the channel graph on the right, but the more the channel graphs of each access point overlap, the more they interfere. Let's not overlap too much.

The following page is easy to understand about this area.
Wireless LAN-What is a channel?
Common to IEEE802.11b and 802.11g, the channel spacing is 5MHz and one channel width is 22MHz, so it is necessary to leave a 'spacing of 5 channels or more' to prevent radio wave interference. Therefore, in the case of IEEE802.11b, as a channel design that uses 1ch / 6ch / 11ch / 14ch (special), in the case of 802.11g, a combination of 1ch / 6ch / 11ch or 2ch / 7ch / 12ch or 3ch / 8ch / 13ch, etc. It can be said that the channel design that uses is appropriate. However, it is better to use 1ch / 7ch / 13ch by making more effective use of the interval.
In 802.11a, there is no overlap between channels, so if you change the channel number, that's OK.
Channels can be switched in real time while scanning

The data acquired in this way can be saved, and click 'Copy data' from 'Edit'.
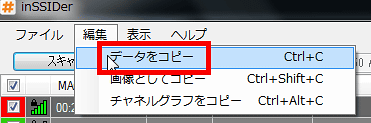
All you have to do is paste it into a text editor (Notepad, etc.).

If you want to copy the graph on the left, click 'Edit'-'Copy as image'.
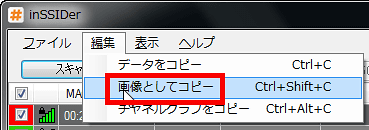
All you have to do is paint or paste it into the image viewer.

If you want to copy the channel graph on the right, click 'Copy Channel Graph' from 'Edit'.
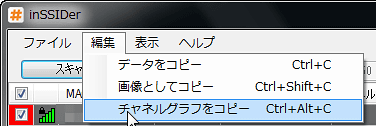
After that, you can paste it in the paint or image viewer in the same way.

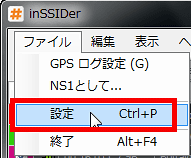
In addition, the update interval of the graph can be changed by clicking 'Settings' from 'File'.
You can adjust the 'Network Search Interval' in the 'General' tab. Also, by shortening the 'time to delete inactive networks', you can quickly eliminate access points that you just accidentally caught.

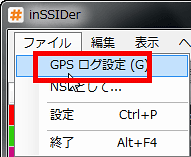
It is also possible to acquire logs using GPS, and it can be set from the 'GPS' tab.

For GPS, you can set it in more detail by clicking 'GPS log setting' from 'File'.
Like this

Records can be exported and saved by selecting 'As NS1' from 'File'
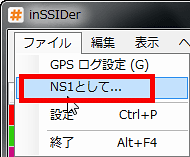
The NS1 format is the NetStumbler format.

Related Posts: