I tried various benchmarks on the AI PC 'Acer Swift X 14' & tried using the AI function with the NPU
I borrowed the Acer Swift X14, an AI PC for creators equipped with an Intel Core Ultra 7 and an NVIDIA GeForce RTX 4070 Laptop, so following up on
Acer Swift X 14 | AI PC for Creators | Acer Japan
https://www.acer.com/jp-ja/laptops/swift/swift-x-14
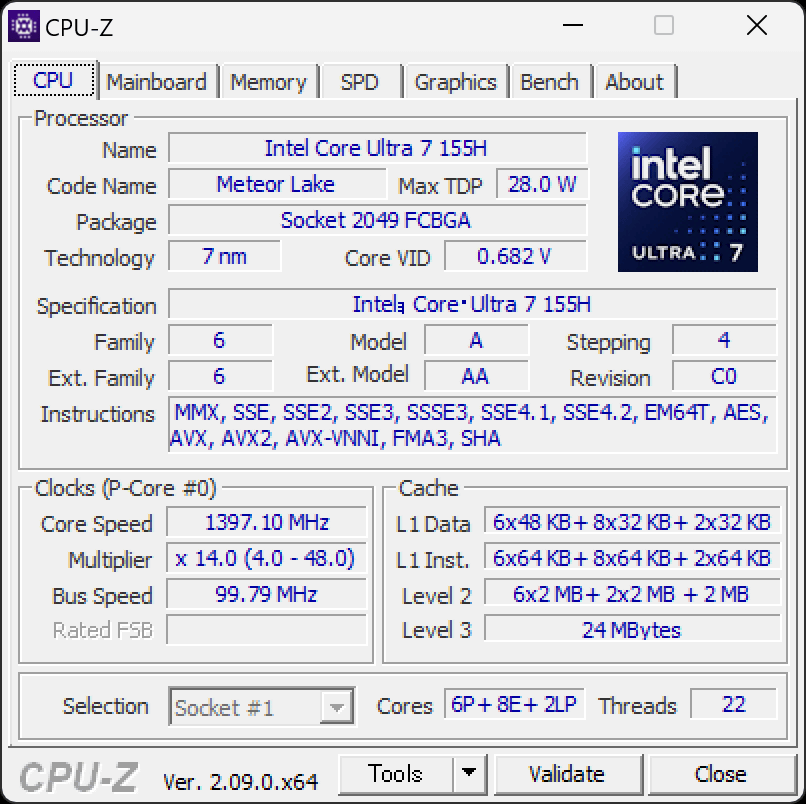
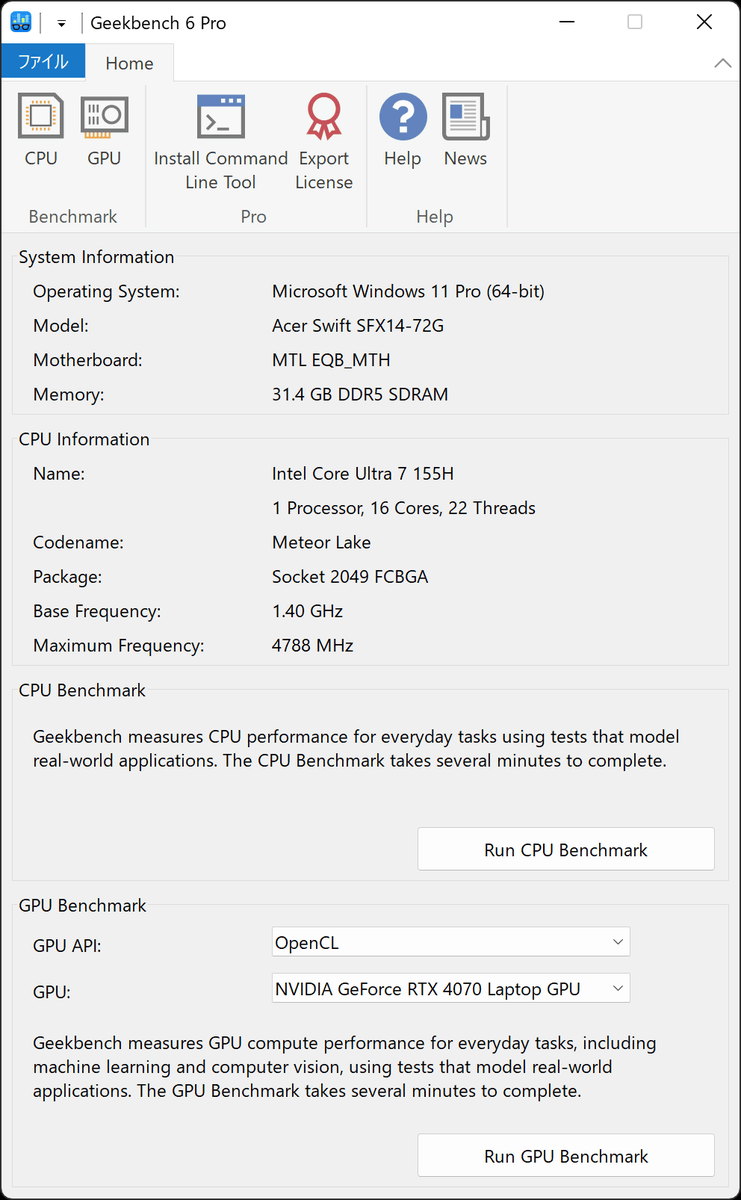
When I checked the CPU installed using CPU-Z, I found it to be an Intel Core Ultra 7 155H with 16 cores and 22 threads.
Checking the GPU installed with '
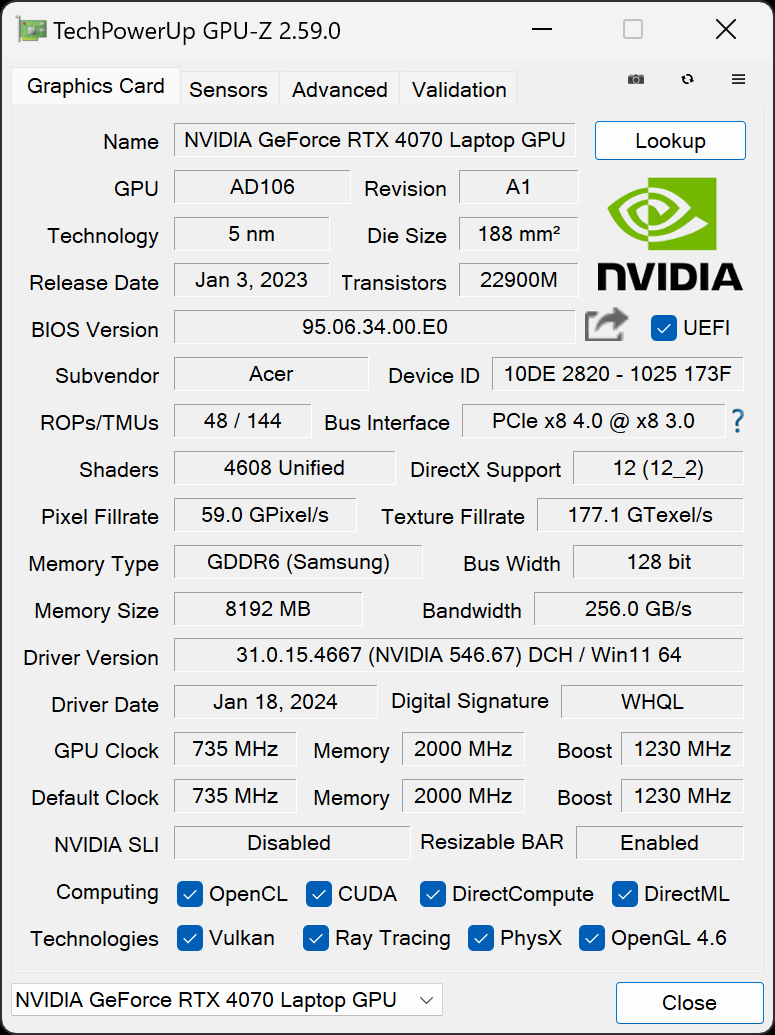
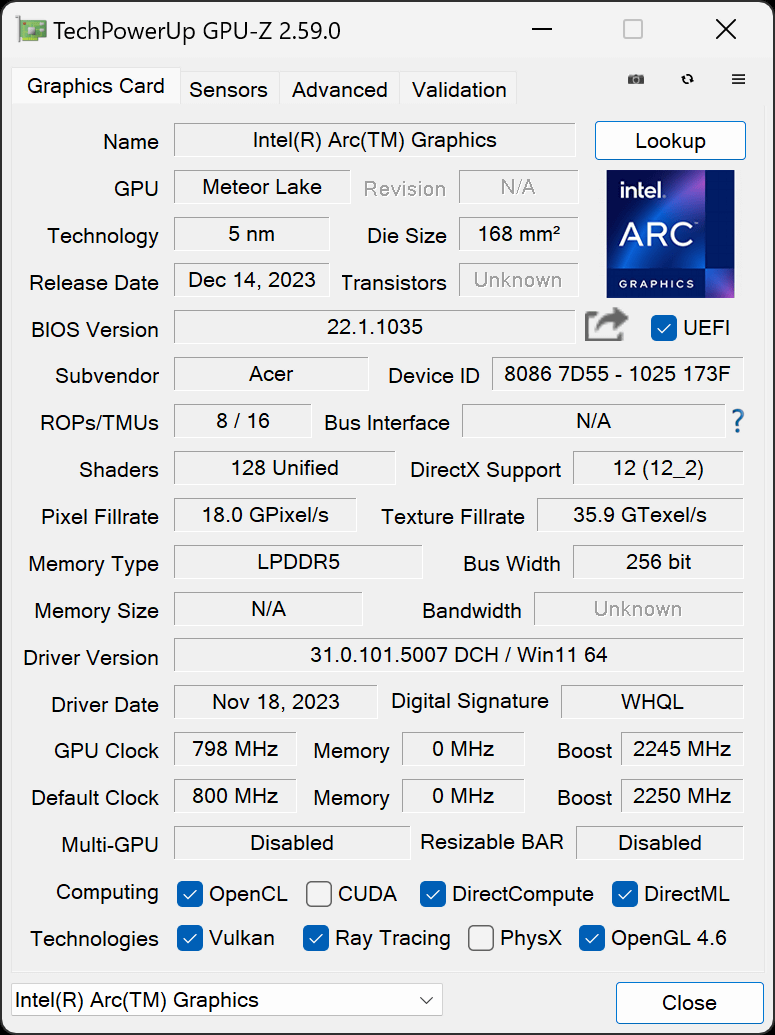
The CPU also comes equipped with Intel Arc Graphics as its built-in GPU.
I checked
From here on, we will run benchmarks using various software. During the benchmark tests, the PC was plugged in and the room temperature was kept at approximately 25 degrees.
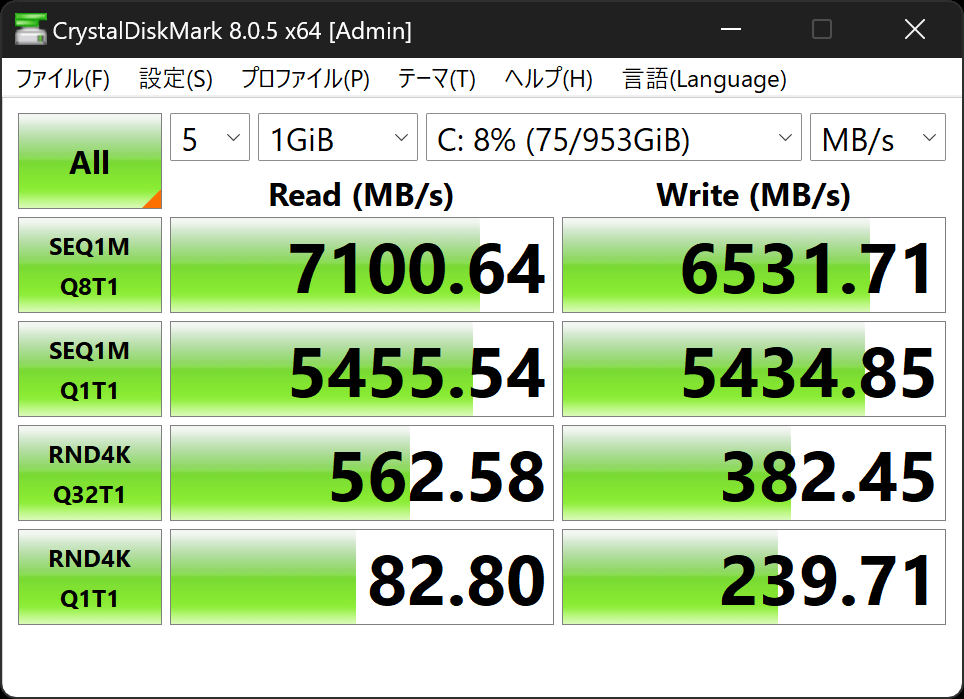
First, I ran ' CrystalDiskMark '. The SSD's transfer speed was 7100.64MB/s for sequential read and 6531.71MB/s for sequential write. It was 562.58MB/s for random read and 382.45MB/s for random write.
When we ran '
We ran CPU and GPU benchmarks using the benchmark software '
The results were as follows.
| Acer Swift X14 | |
|---|---|
| CPU Single Core | 2417 |
| ├Integer arithmetic | 2353 |
| └Floating-point arithmetic | 2542 |
| CPU Multi-core | 13001 |
| ├Integer arithmetic | 12252 |
| └Floating-point arithmetic | 14571 |
| GPU (NVIDIA/OpenCL) | 91239 |
| GPU (Intel/OpenCL) | 35592 |
| GPU (NVIDIA/Vulkan) | 87364 |
| GPU (Intel/Vulkan) | 34776 |
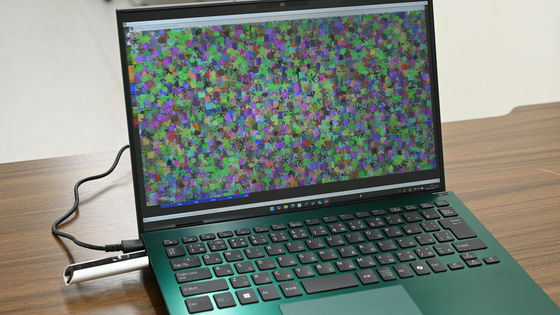
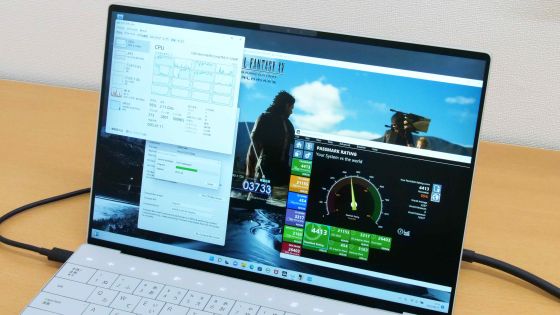
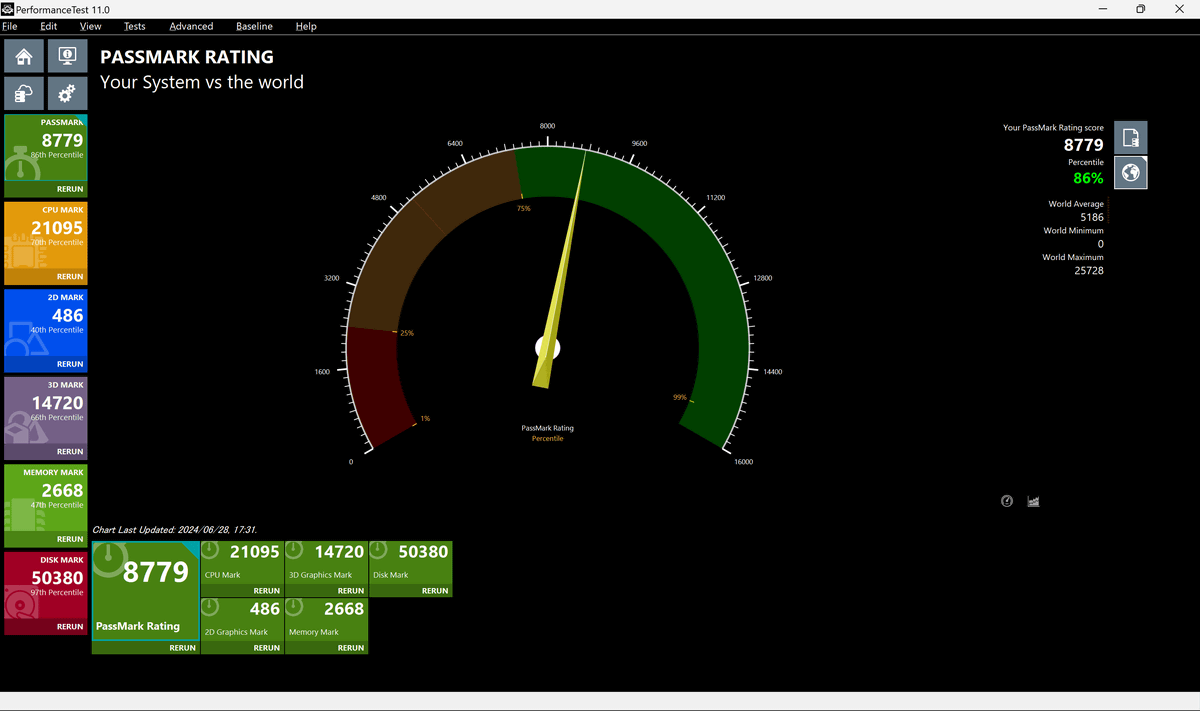
' PassMark PerformanceTest ' checked five items: CPU, 2D, 3D, memory, and disk. The overall score was '8779', and the percentile, which indicates the position compared to past benchmarks, was '86%'. It's quite high.
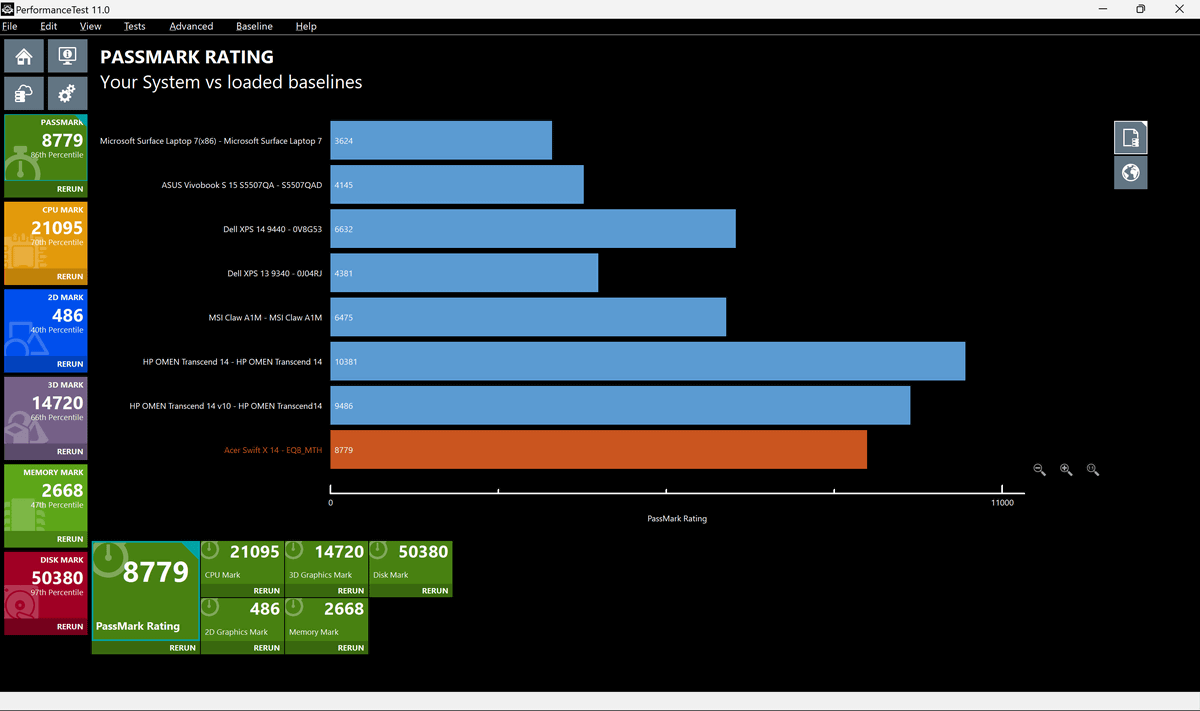
We compared the results with benchmark results from the past. From the top, the following are listed in order:
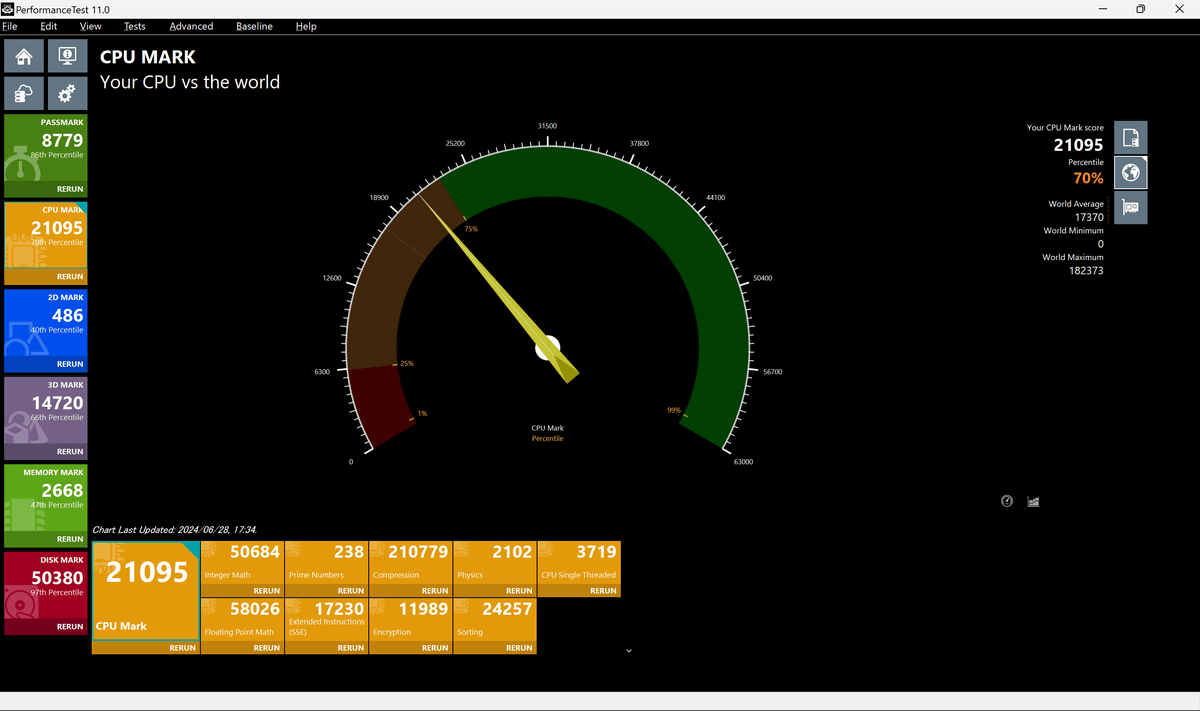
The CPU score was '21095', with a percentile of 70%, which is high.
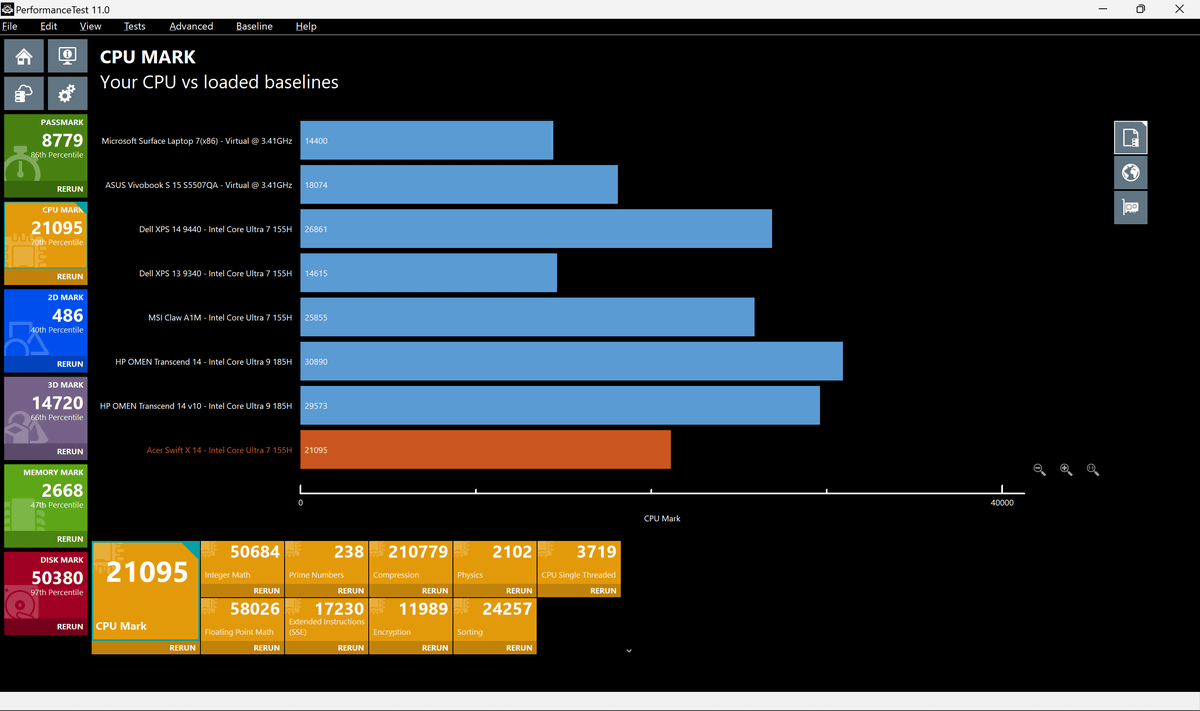
The comparison graph looks like this. There is a slight difference in scores even with the same Intel Core Ultra 7 155H equipped PC.
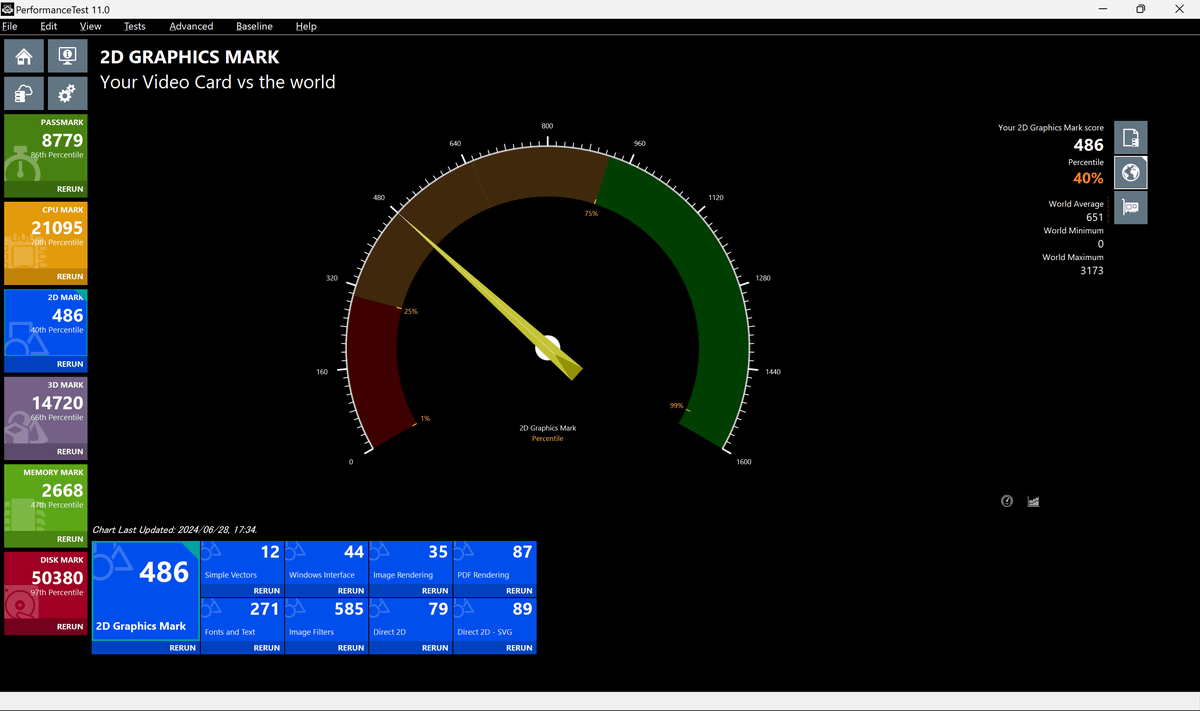
The 2D graphics score was 486, which is in the 40th percentile.
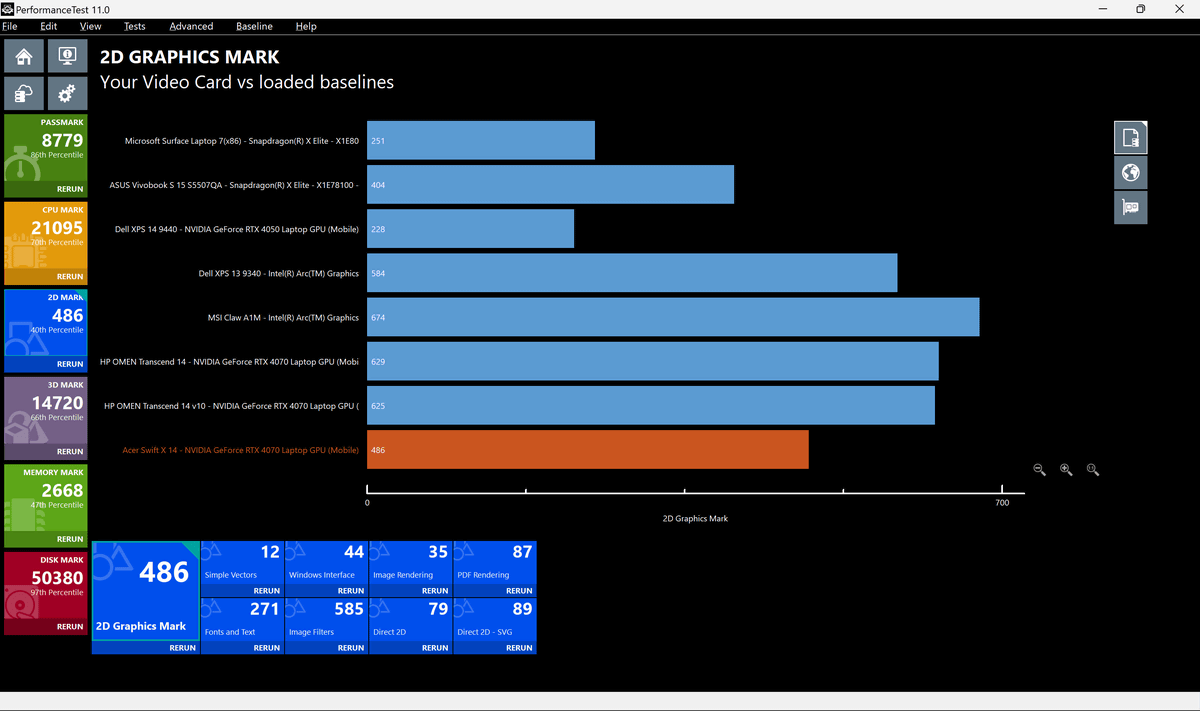
The comparison graph looks like this.
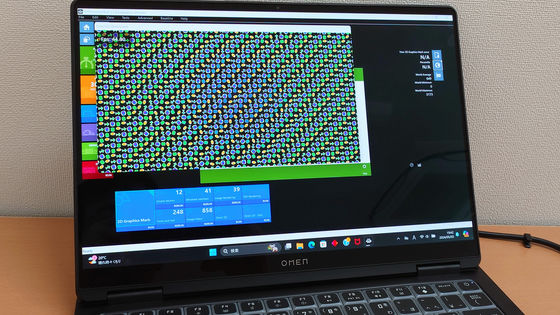
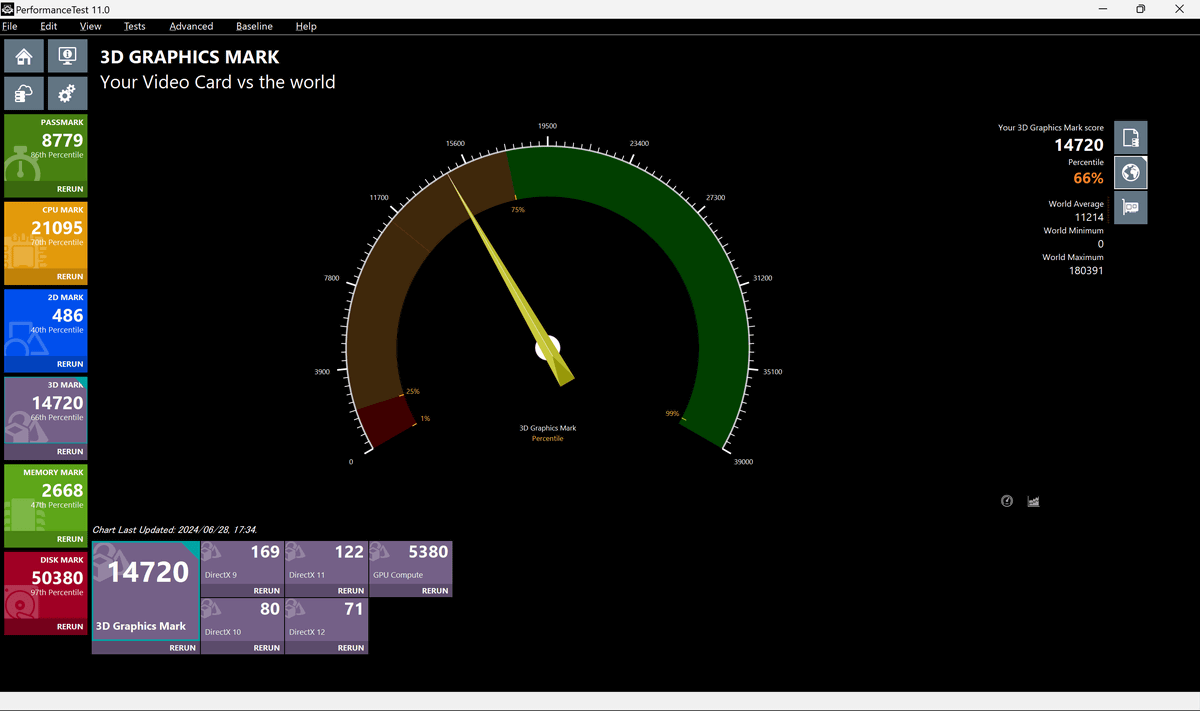
The 3D graphics score was '14720' which is a percentile of 66%.
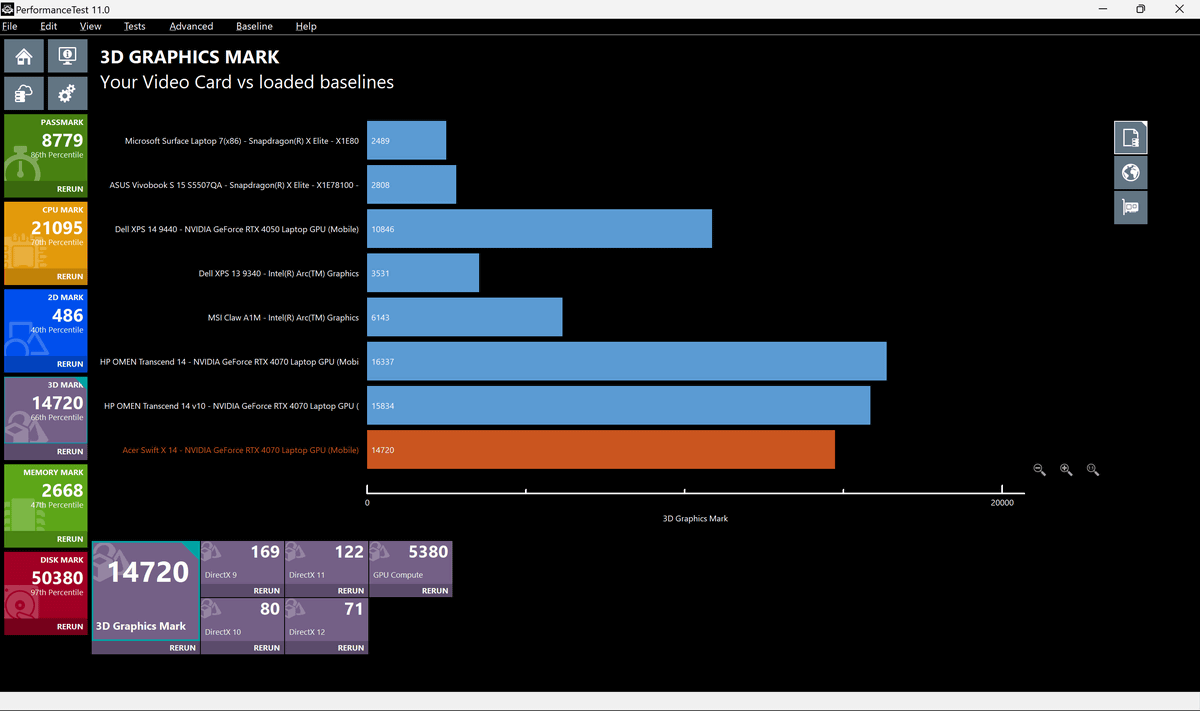
The comparison graph looks something like this, with a clear distinction between PCs with NVIDIA GPUs and those without.
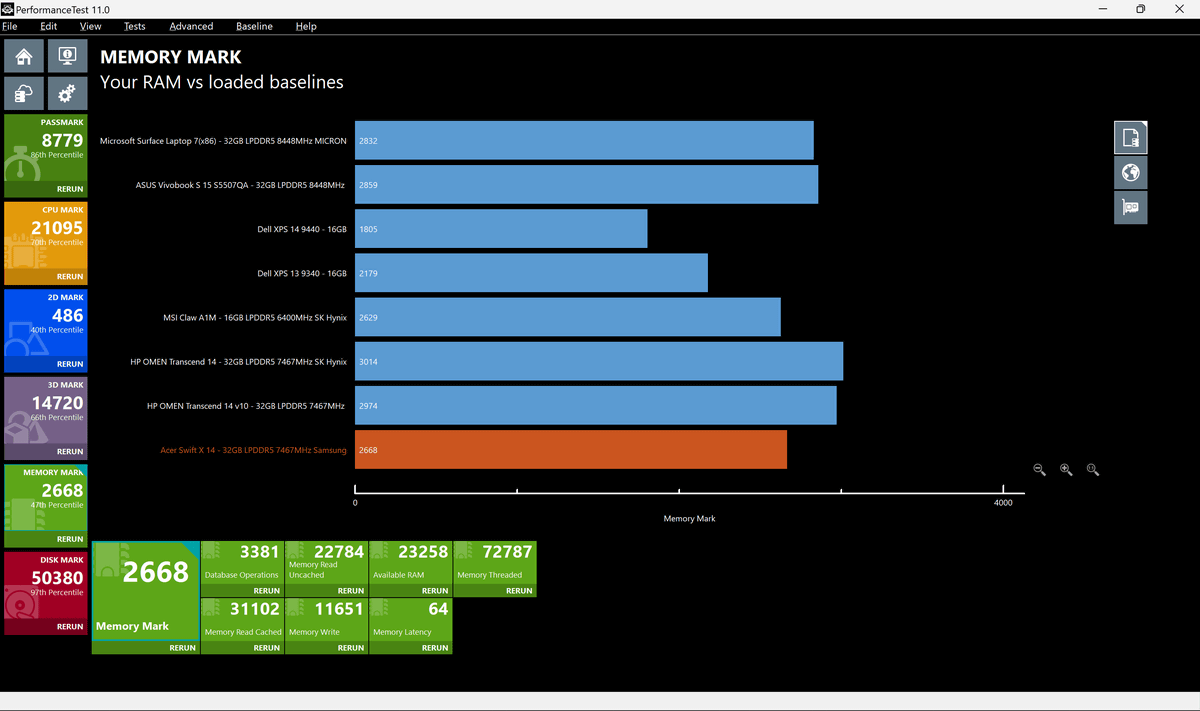
The memory score was 2668, which is in the 47% percentile.
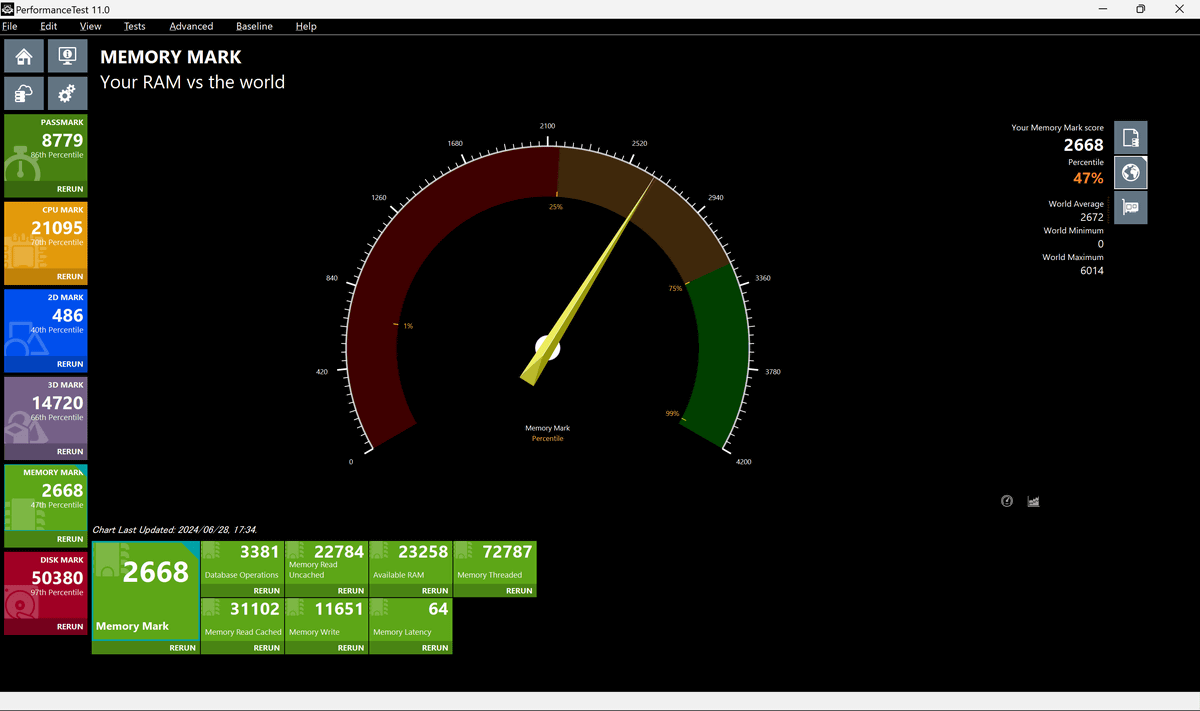
Here's a comparison graph. There isn't much difference.
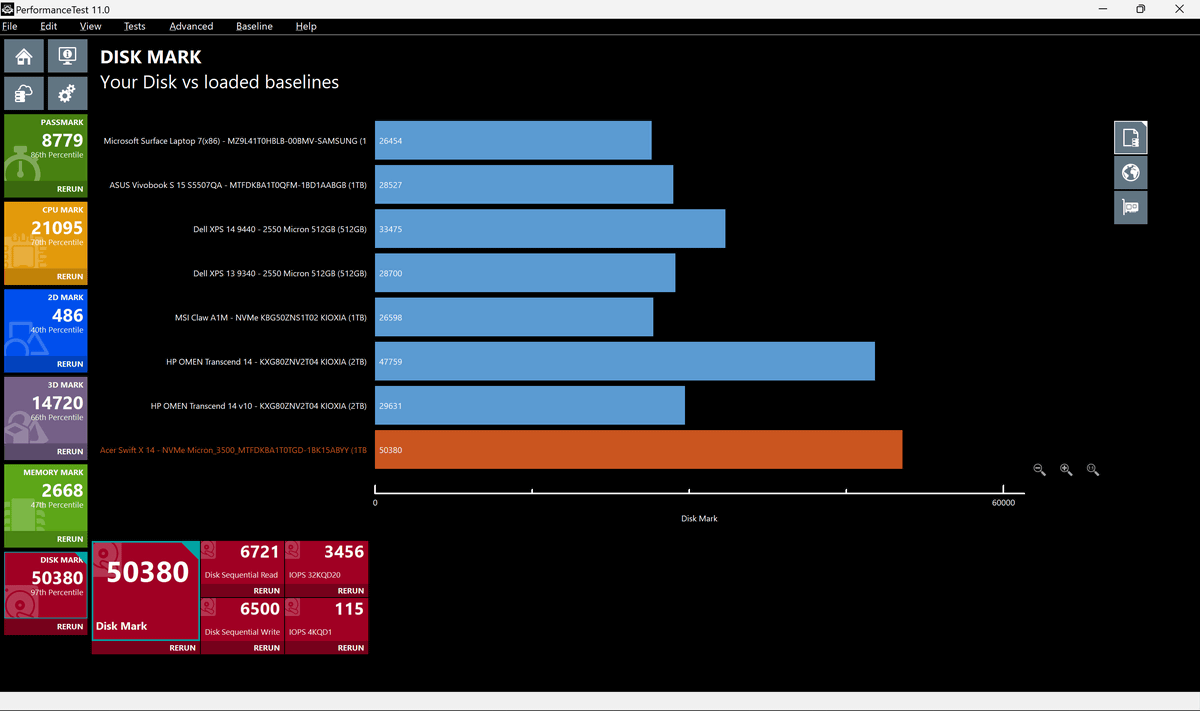
The disk's score was 50380, which is in the 97th percentile. This is an extremely high score, placing it in the top 3% of the overall score.
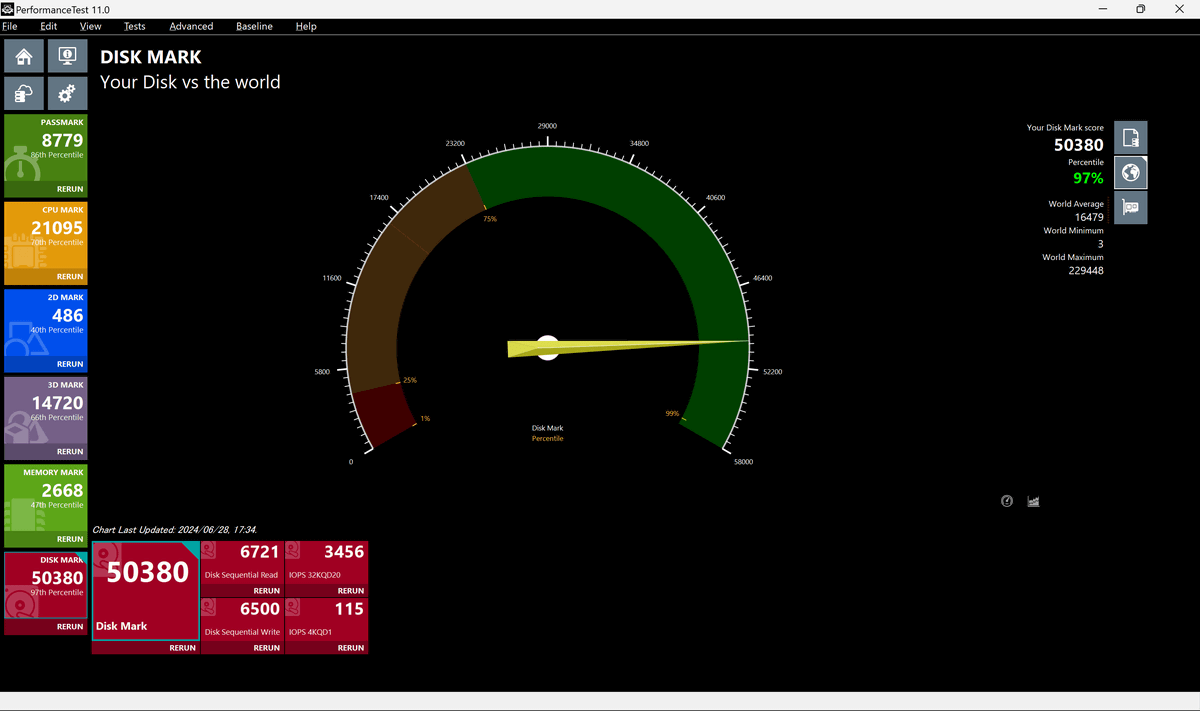
The comparison graph looks like this.
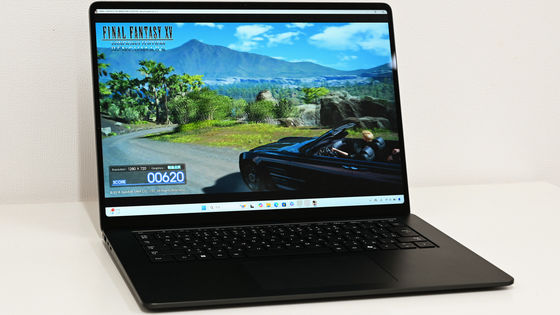
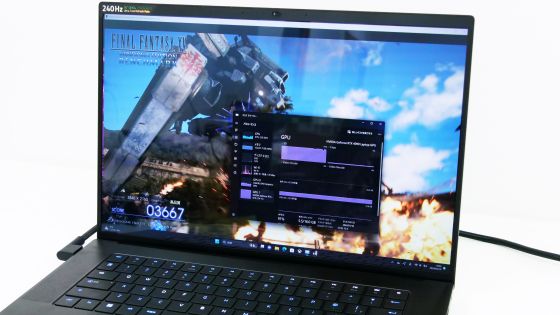
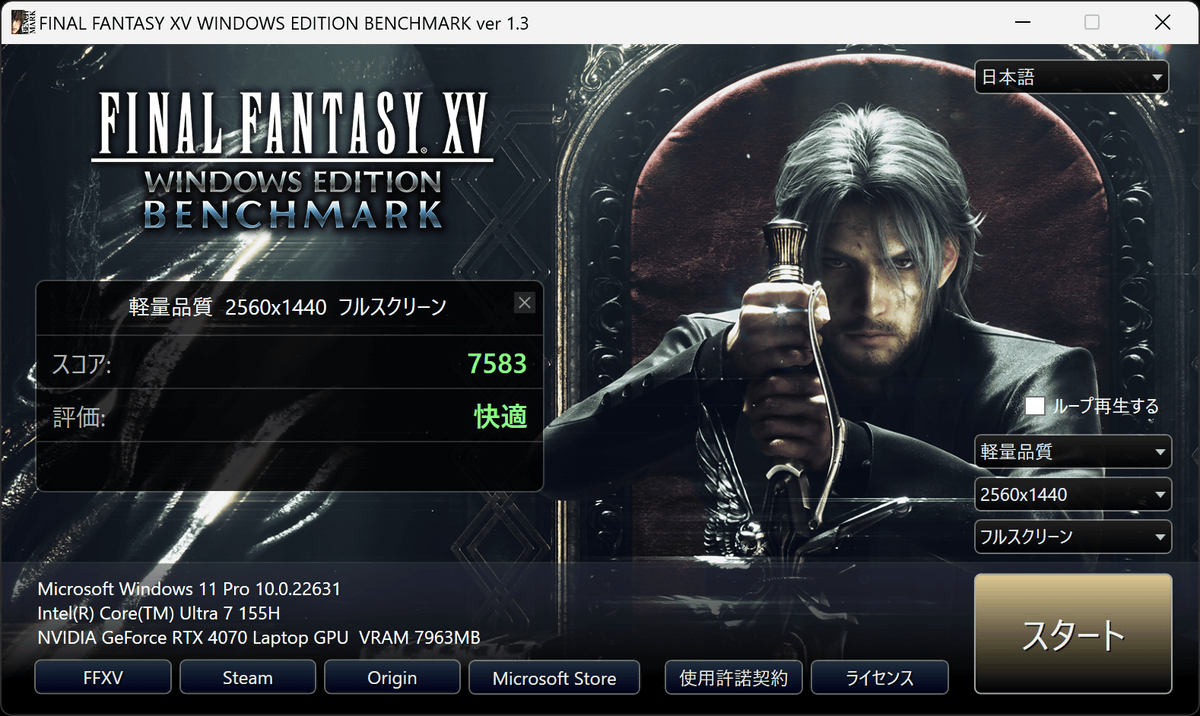
The results of running the '
| Quality/Resolution | 3840×2160 | 2540×1440 | 1920×1080 | 1280×720 |
|---|---|---|---|---|
| Lightweight quality | 3808(Normal) | 7583 (comfortable) | 8717(comfortable) | 9539 (Very comfortable) |
| Standard Quality | 3129(Regular) | 5725 (somewhat comfortable) | 8073 (comfortable) | 8502 (comfortable) |
| high quality | 2812 (slightly heavy) | 4834 (somewhat comfortable) | 6674(comfortable) | 7498 (comfortable) |
Since

The execution results are as follows, with all quality results being 'comfortable'.
| Quality/Resolution | 1920×1080 |
|---|---|
| Standard Note | 10534 (comfortable) |
| Standard Desktop | 9572 (comfortable) |
| High Quality Notes | 8822 (comfortable) |
| High Quality Desktop | 8482 (comfortable) |
| Highest quality | 8401 (comfortable) |
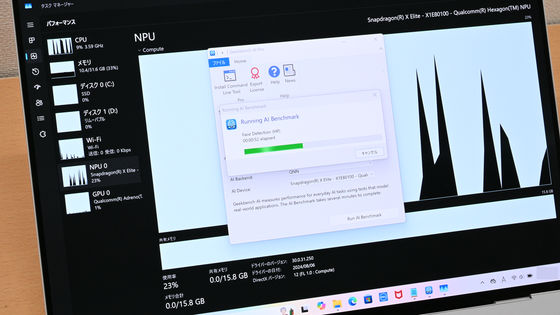
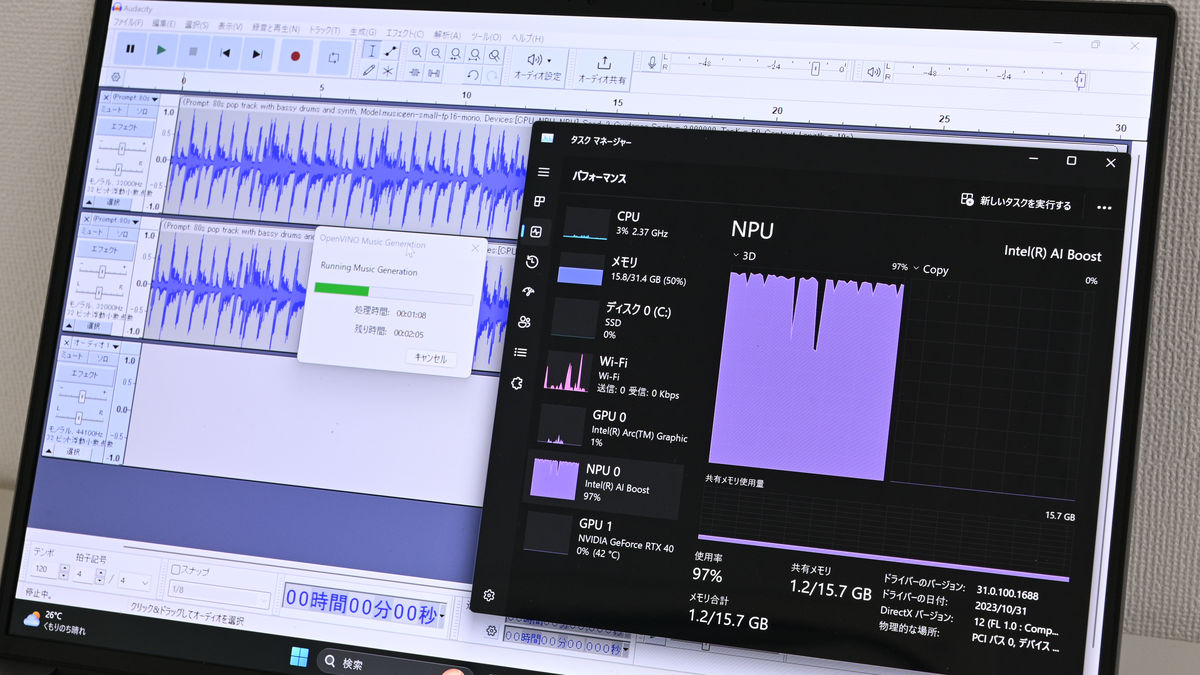
In addition, since the computer is equipped with an NPU (Intel AI Boost) as an AI PC, we also measured the execution performance of the NPU in comparison with the CPU and GPU.
One was a transcription using the OpenVINO Whisper Transcription plugin, a plugin provided for the music editing software Audacity. The first time, the AI model was loaded, so the speed was measured a second time. The audio file in question was 20 minutes and 43 seconds long.
The other is music generation using the Audacity plugin 'OpenVINO Music Generation with Stable Audio'. The execution options are as follows. Since only CPU or GPU can be selected in 'EnCodec Device', we fixed it to CPU and changed 'MusicGen Devode Device 0' and 'MusicGen Devode Device 1' to execute it. This also loads the AI model the first time, so we measured it from the second time onwards.
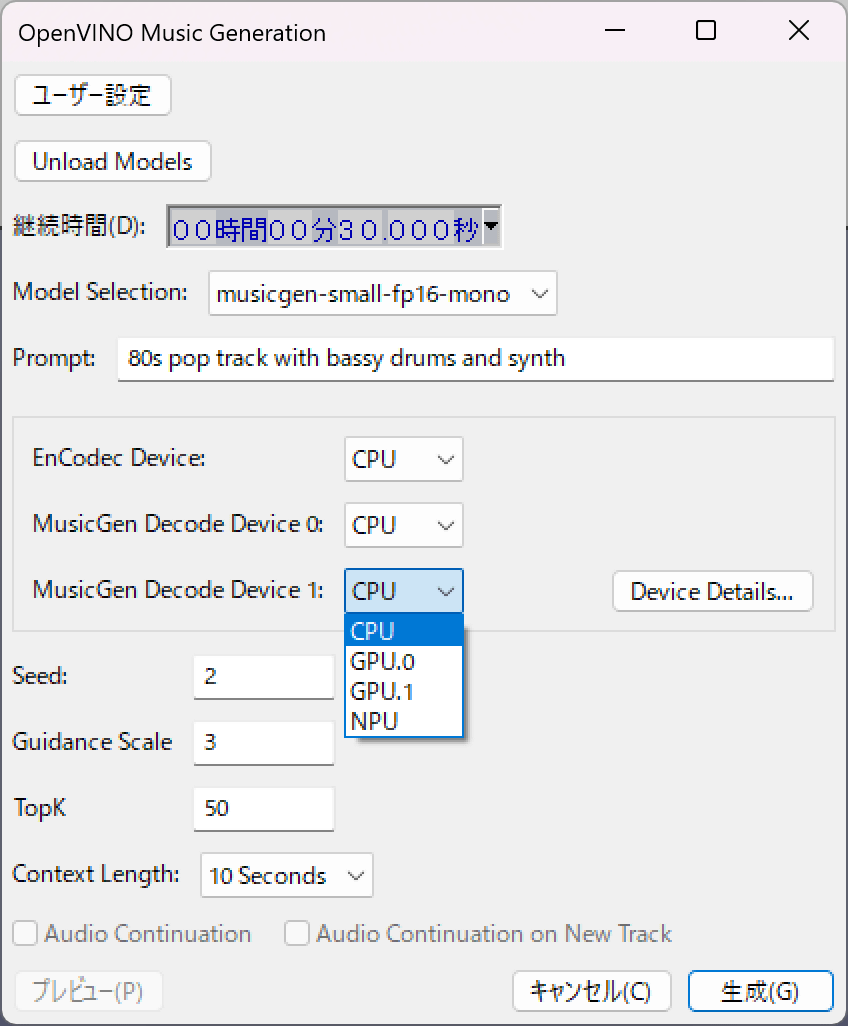
The results of the two runs are as follows. In both cases, the GPU was faster. Note that this GPU is Intel Arc Graphics built into the CPU.
| Transcription | Music Generation | |
|---|---|---|
| CPU | 2 minutes 58 seconds | 1 minute 38 seconds / 1 minute 24 seconds / 1 minute 31 seconds |
| GPU | 2 minutes 2 seconds | 46 sec/46 sec/46 sec |
| NPU | 2 minutes 3 seconds | 3 minutes 13 seconds/3 minutes 12 seconds/3 minutes 12 seconds |
When I selected NVIDIA GeForce RTX 4070 Laptop, an error occurred and all of the options failed to run.
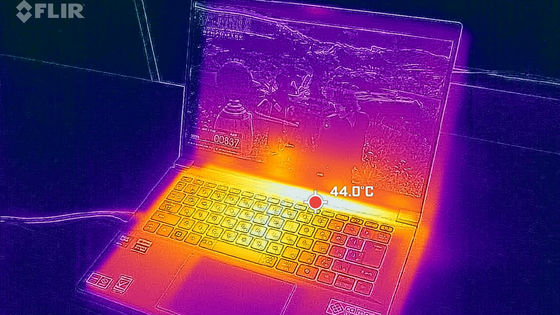
In addition, we will also measure battery life and heat.
Continued
Related Posts: