Benchmarking Dell's Intel Core Ultra-equipped notebook PCs 'XPS 13' and 'XPS 14'
I was able to borrow
XPS 13 Laptop | Dell Japan
https://www.dell.com/ja-jp/shop/dell-laptops/xps-13-laptops/spd/xps-13-9340-laptop
XPS 14 Laptop | Dell Japan
https://www.dell.com/ja-jp/shop/dell-laptops/xps-14-laptops/spd/xps-14-9440-laptop
The CPU installed in the XPS 13, as confirmed by CPU-Z, is the 'Intel Core Ultra 7 155H', with 16 cores and 22 threads. The XPS 13 also has the option of being equipped with the 'Intel Core Ultra 5 125H'.

The XPS 14 is also equipped with an Intel Core Ultra 7 155H CPU, with 16 cores and 22 threads, the same configuration as the XPS 13.

When I checked with
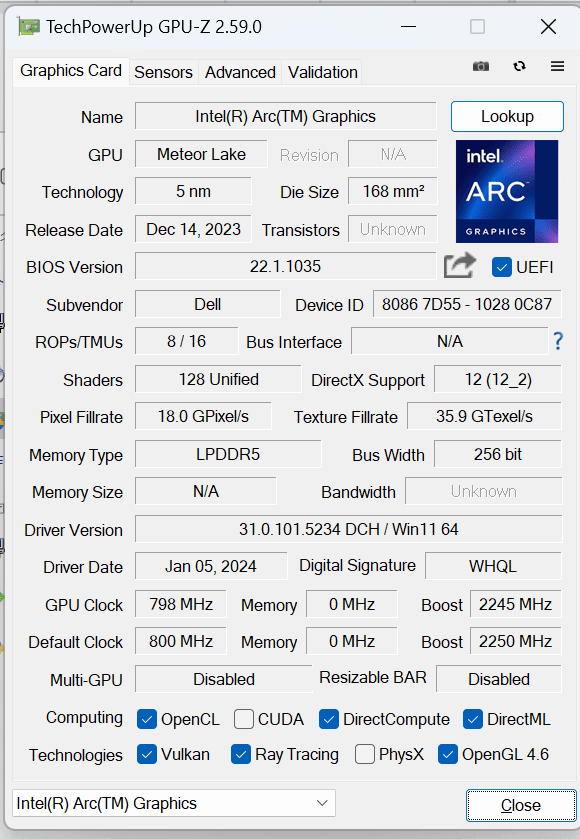
The XPS 14 also comes equipped with Intel Arc Graphics, a GPU built into the CPU.

It is possible to install the optional 'NVIDIA GeForce RTX 4050 Laptop'. The VRAM capacity is 6GB.

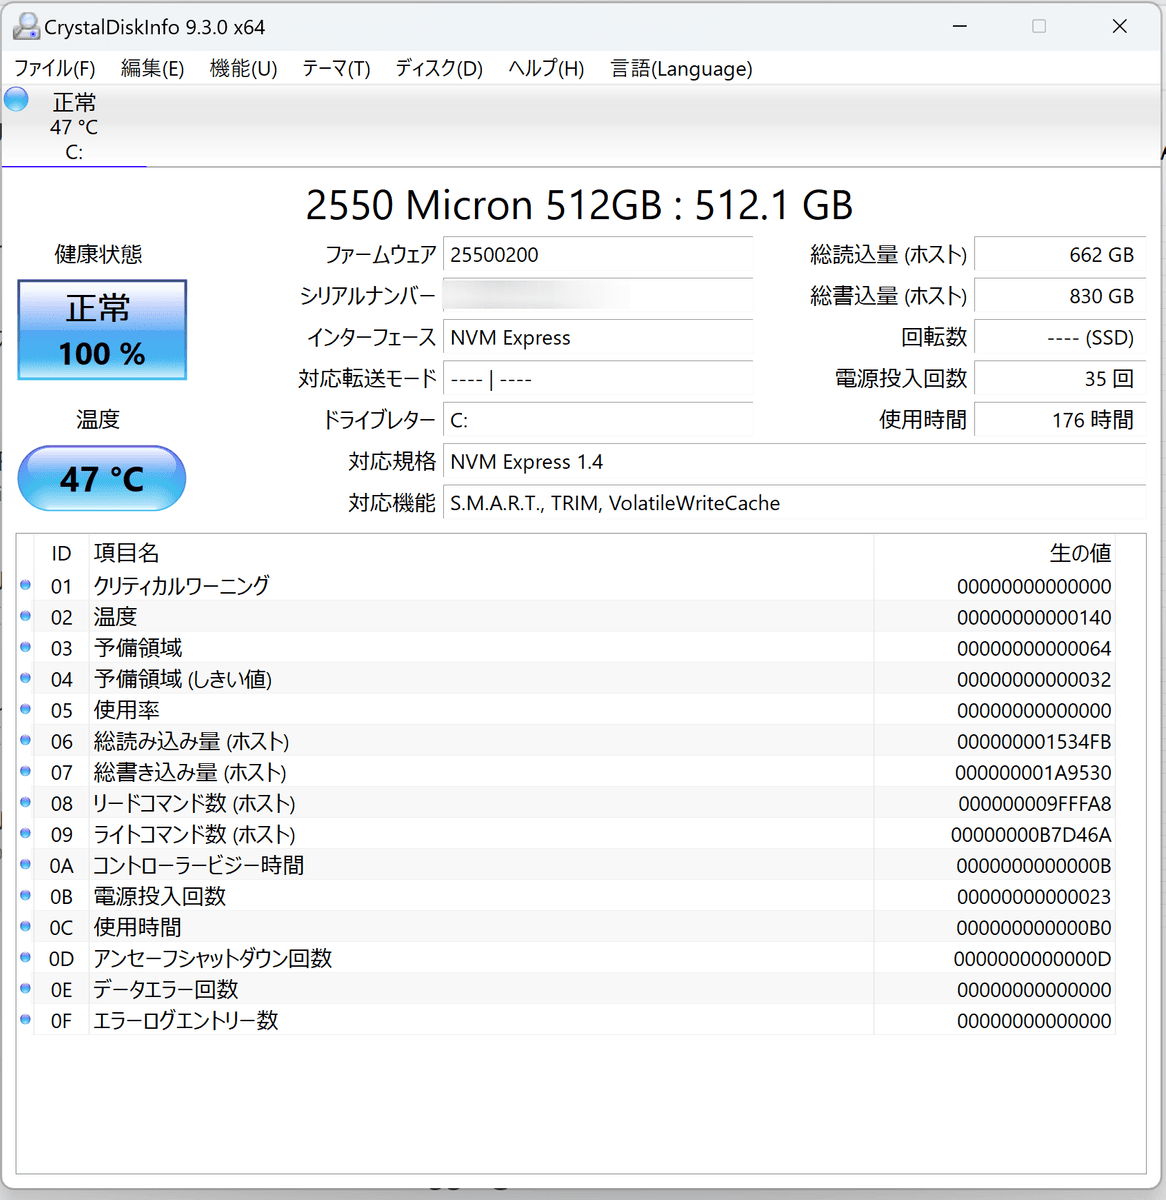
We checked the storage with
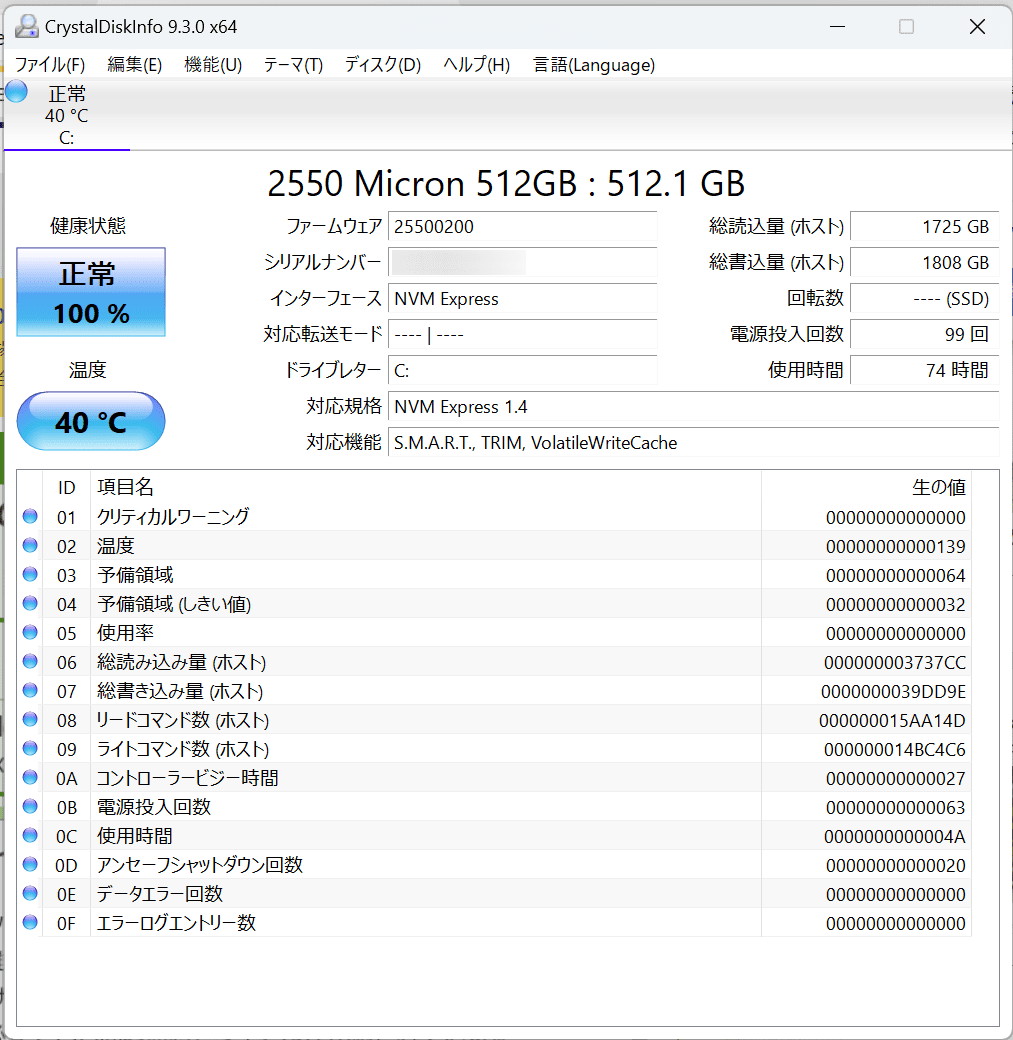
The XPS 14 also comes with the same Micron 2550 NVMe SSD, with capacities of 1TB, 2TB, and 4TB available in addition to the 512GB in the review unit.
Next, we performed benchmark tests at a room temperature of 24 degrees Celsius with both models plugged in.
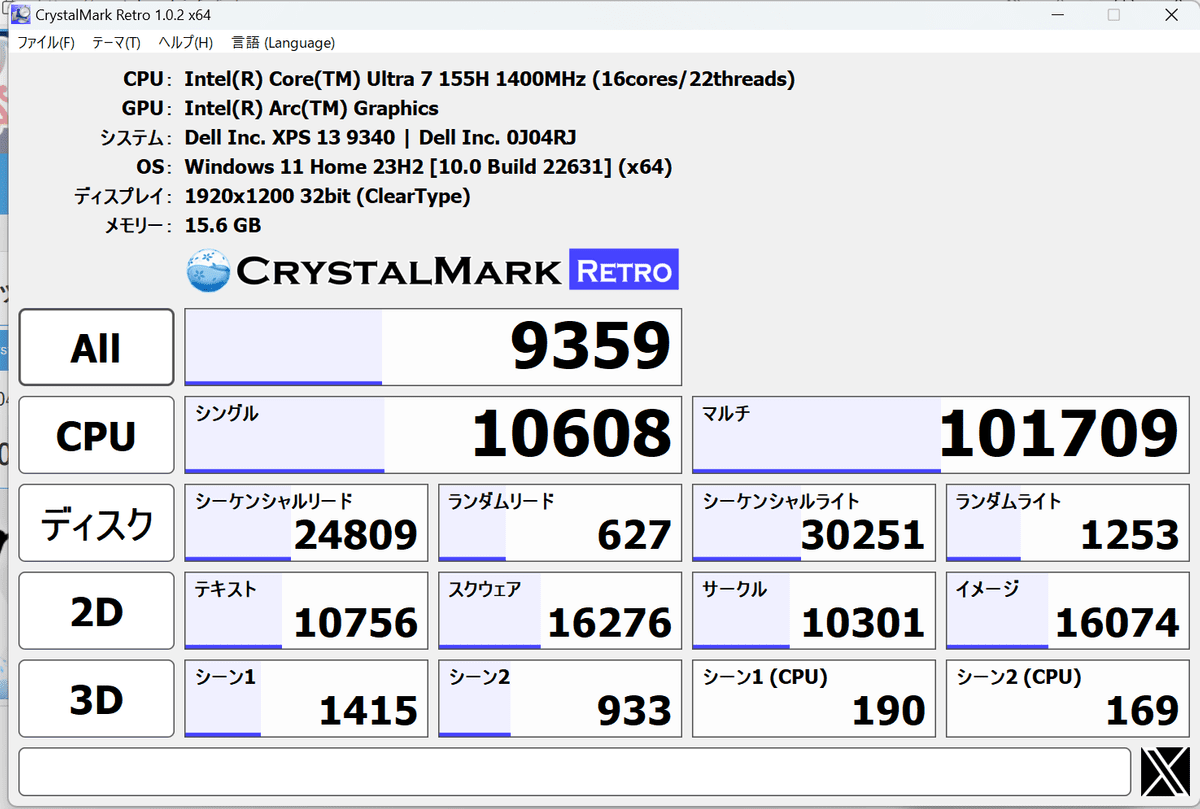
The transfer speeds of the XPS 13 SSD measured with '

The XPS 14 achieved sequential read speeds of 4936.37MB/s, sequential write speeds of 4061.40MB/s, random read speeds of 327.42MB/s, and random write speeds of 429.93MB/s.

Next, we ran
The XPS 14 had an overall score of 8836, a single score of 10314, and a multi-score of 82402.


The single-core score details look like this.
The multi-core score details look like this.

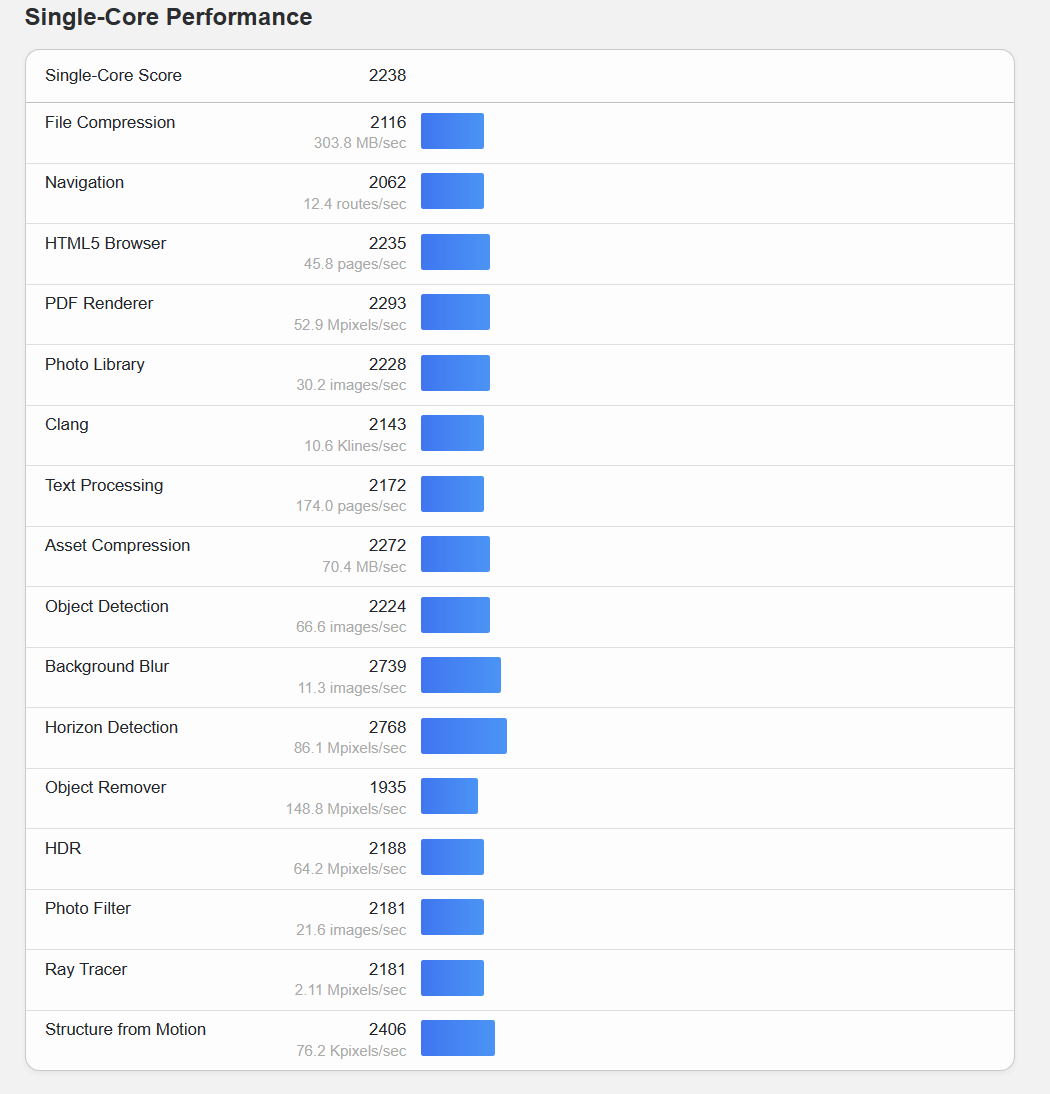
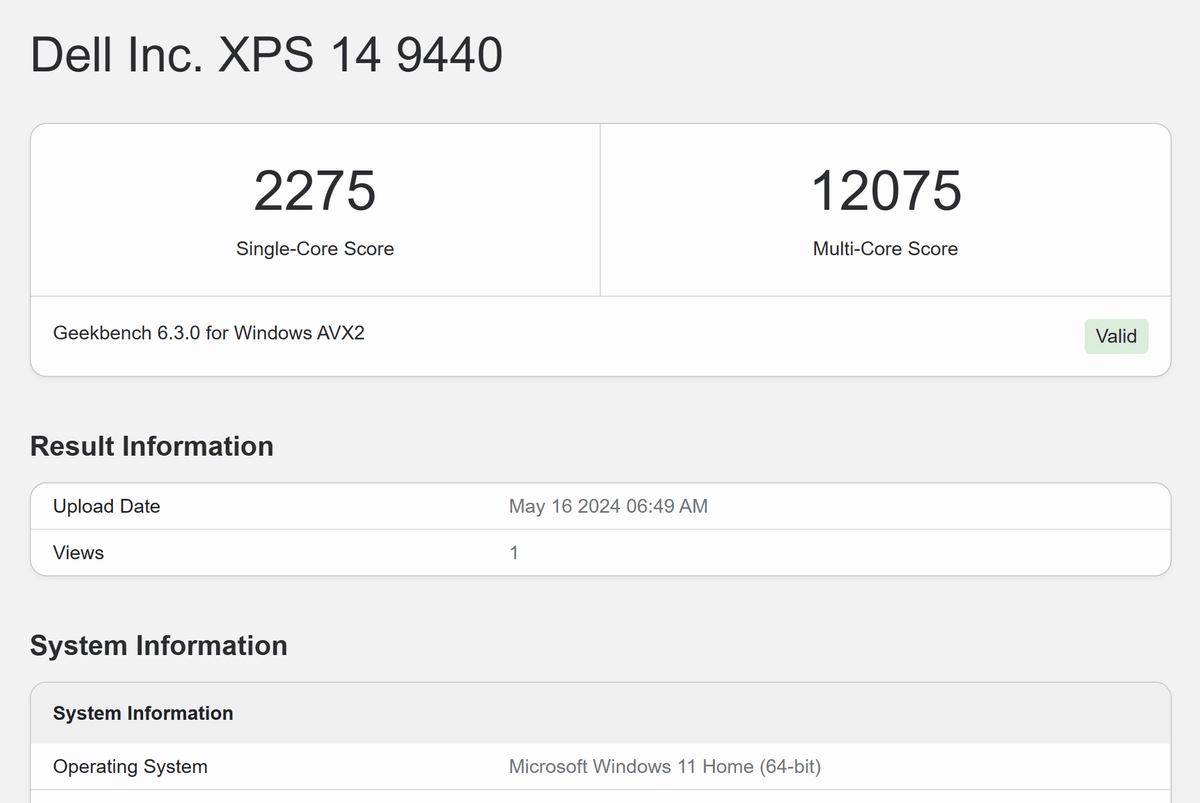
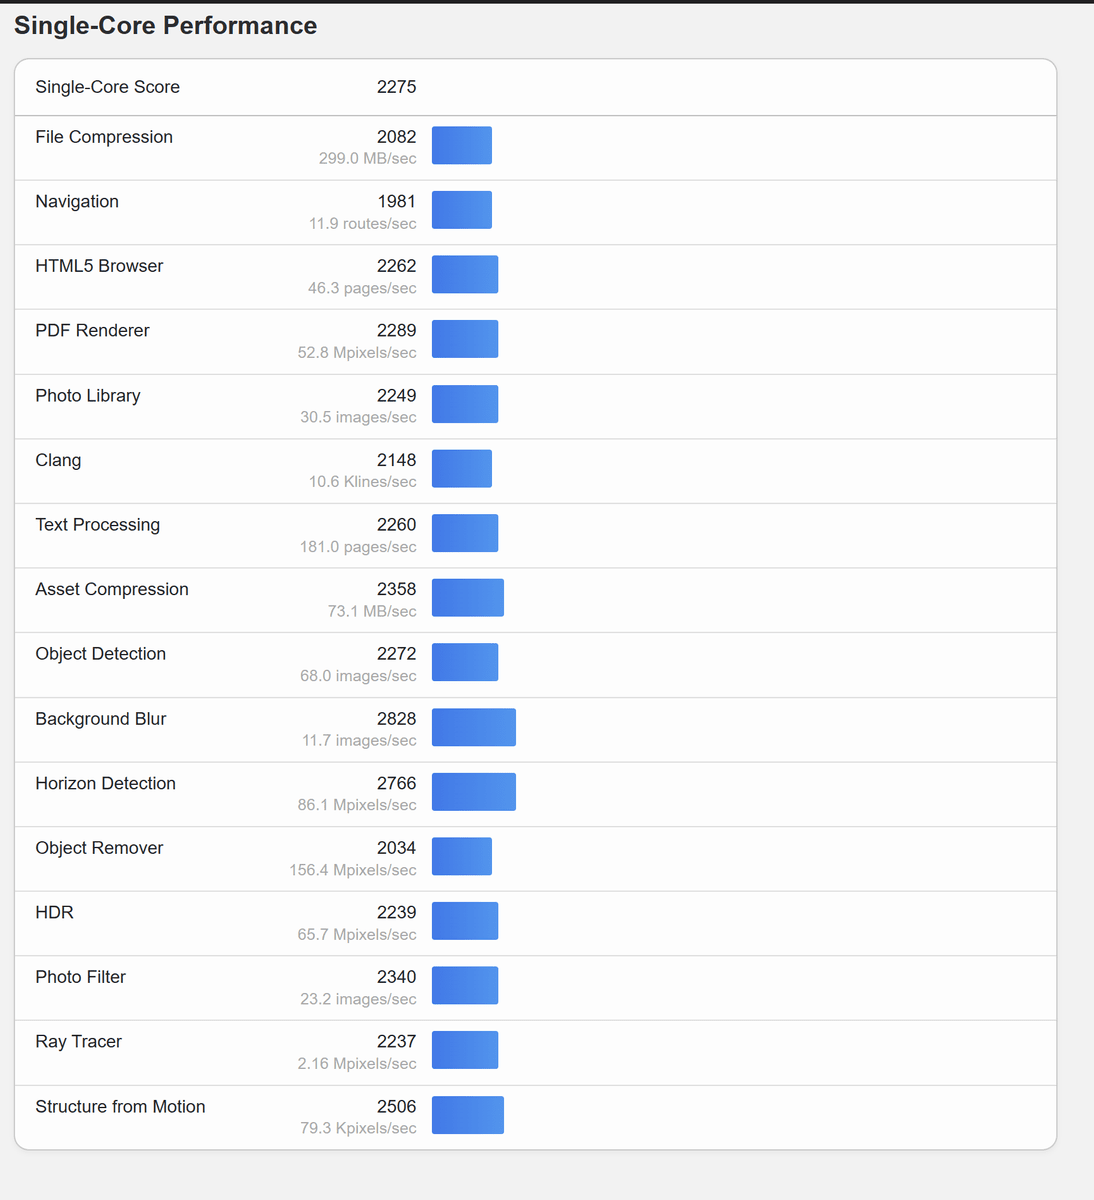
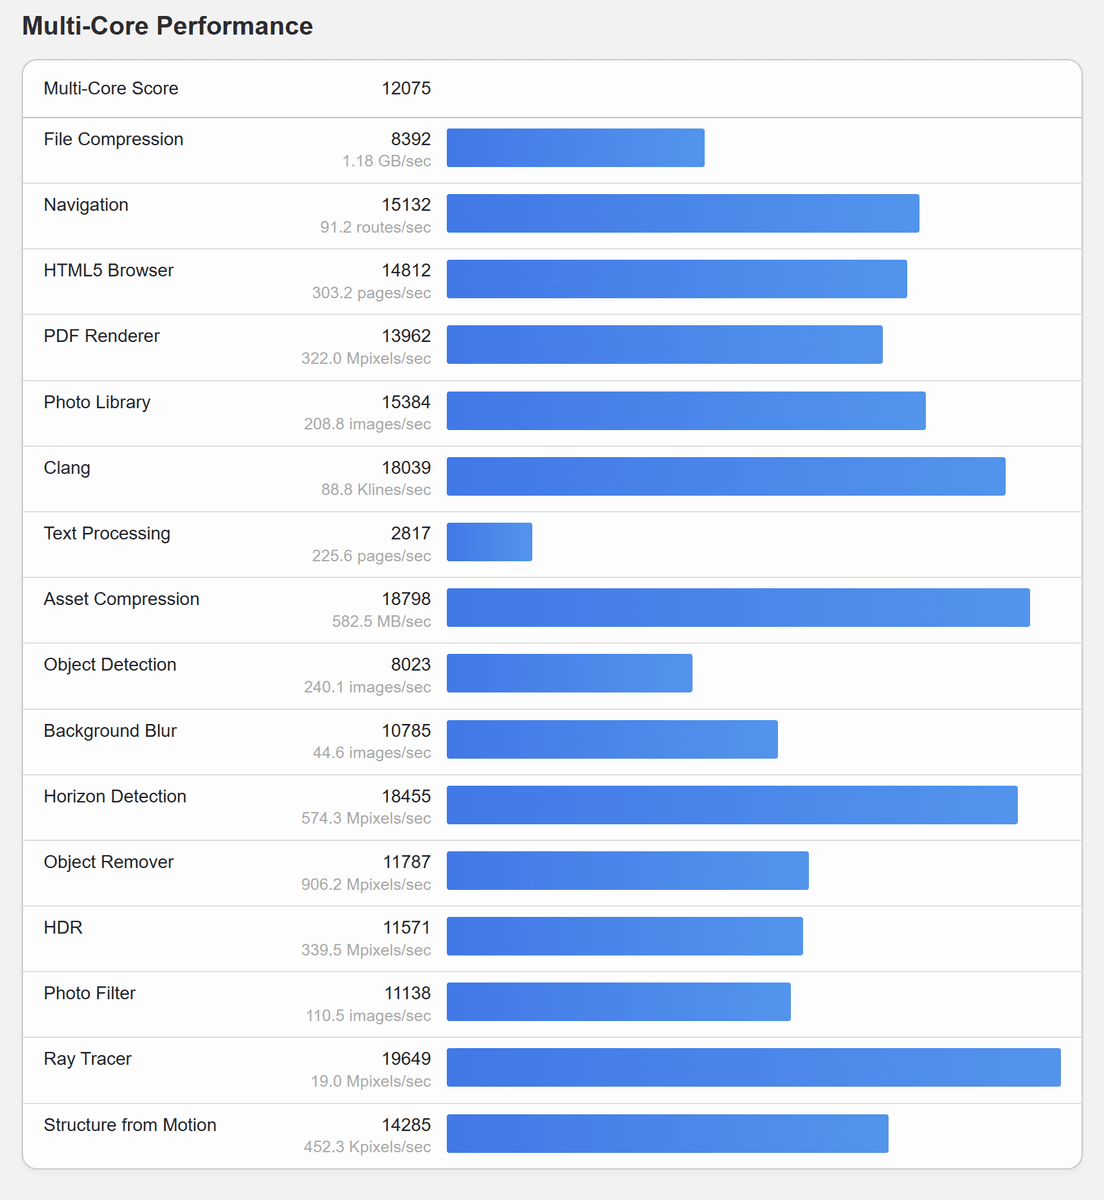
Next, we benchmarked the CPU of the XPS 14. The single-core score was 2275, and the multi-core score was 12075.
The single-core score details look like this.
The detailed multi-core scores were as follows:
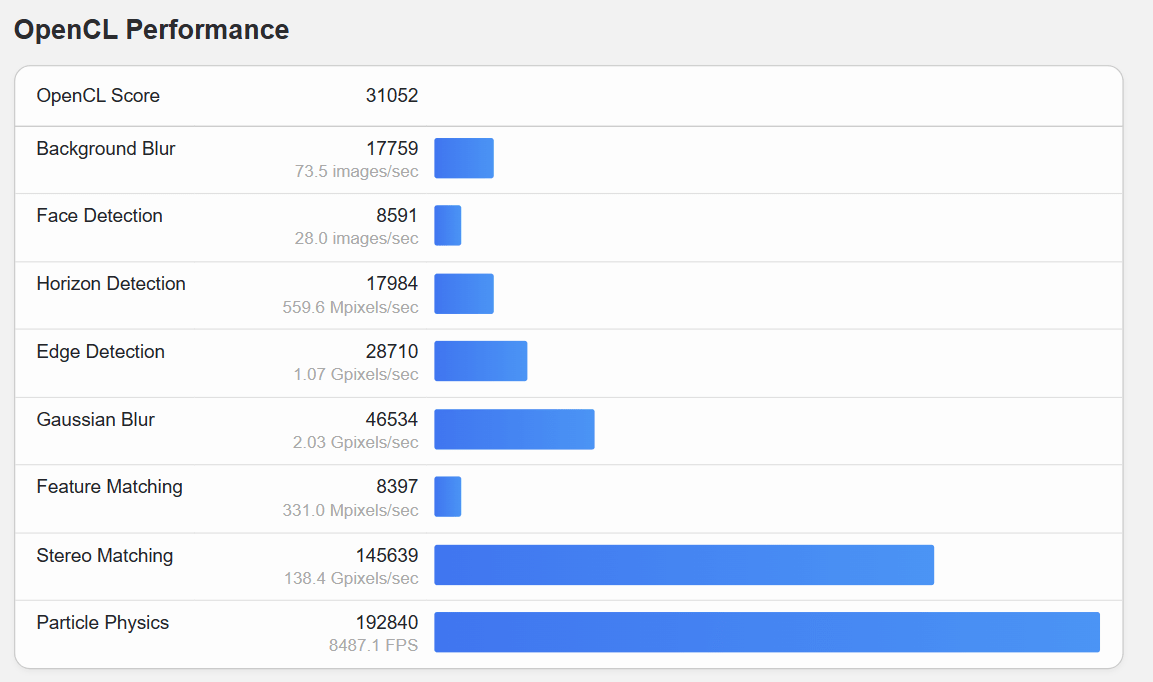
Next, we measured the GPU performance of the XPS 13 with Geekbench 6. First,

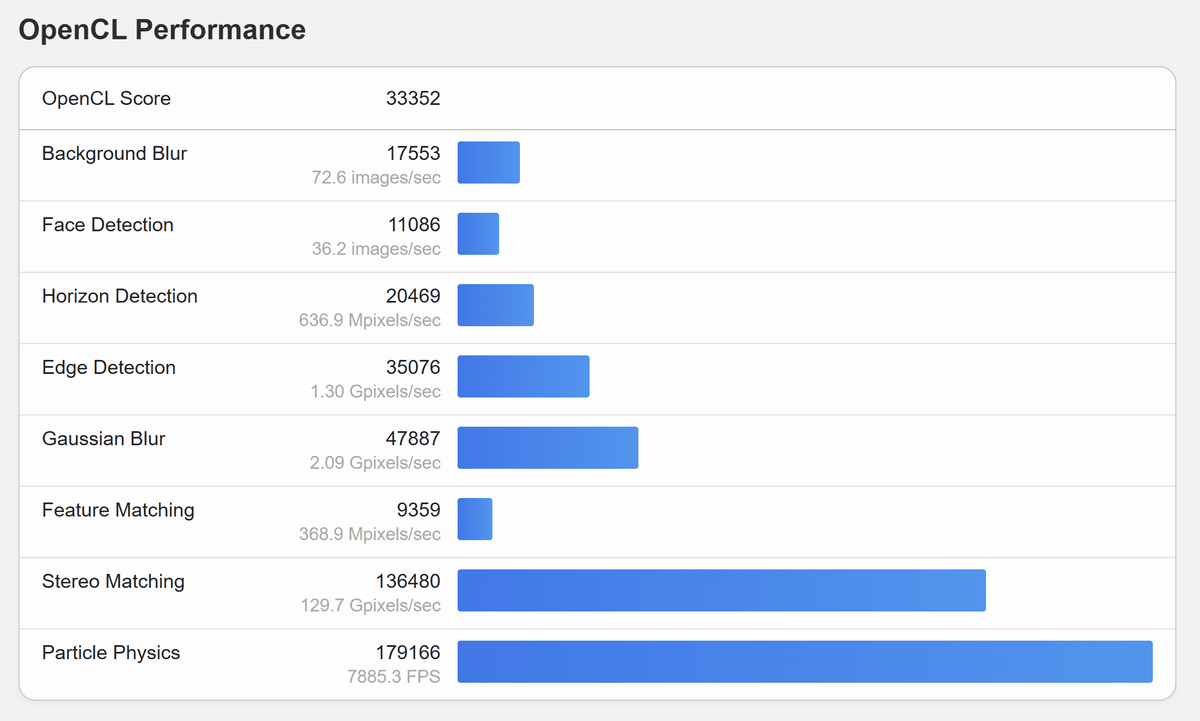
We also measured GPU performance on the XPS 14 in the same way. First, for Intel Arc Graphics, the OpenCL score was 33352.
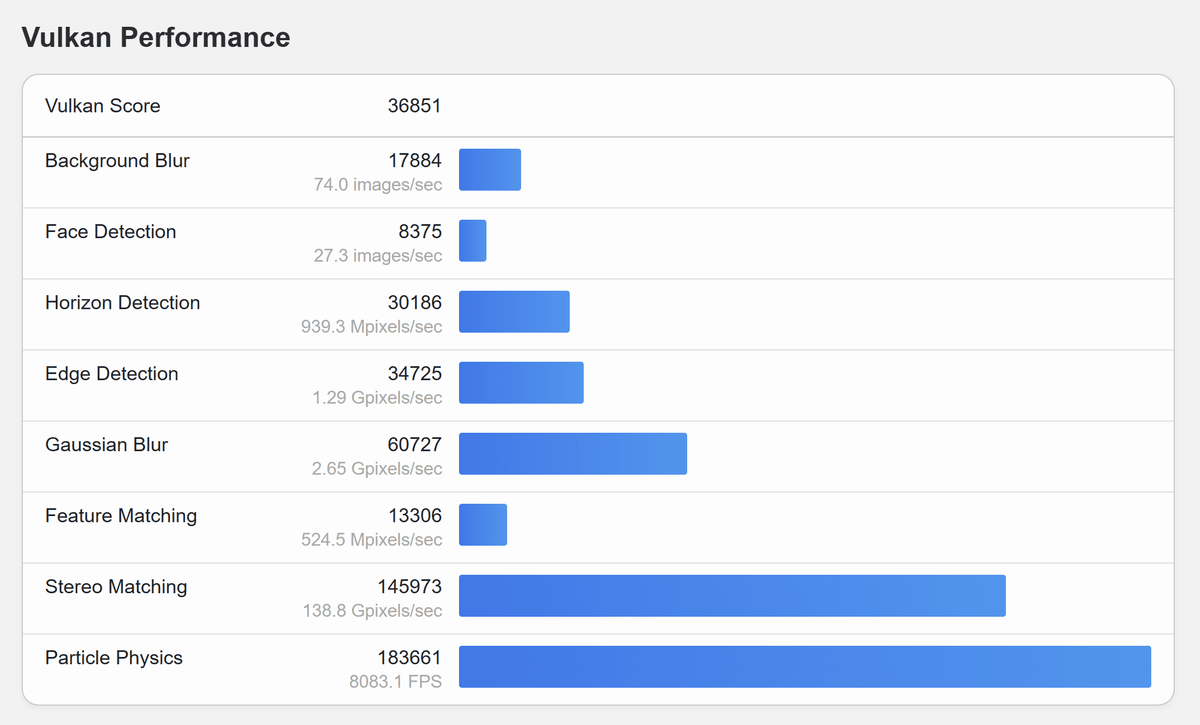
Vulkan's score was '36851'.
Next is the benchmark for the XPS 14 GeForce RTX 4050. The OpenCL score is '63743'.

Vulkan's score was '62503'.

Next, we ran a machine learning benchmark with
The XPS 14 looks like this.

This is the result of processing the XPS 13's Intel Arc Graphics with

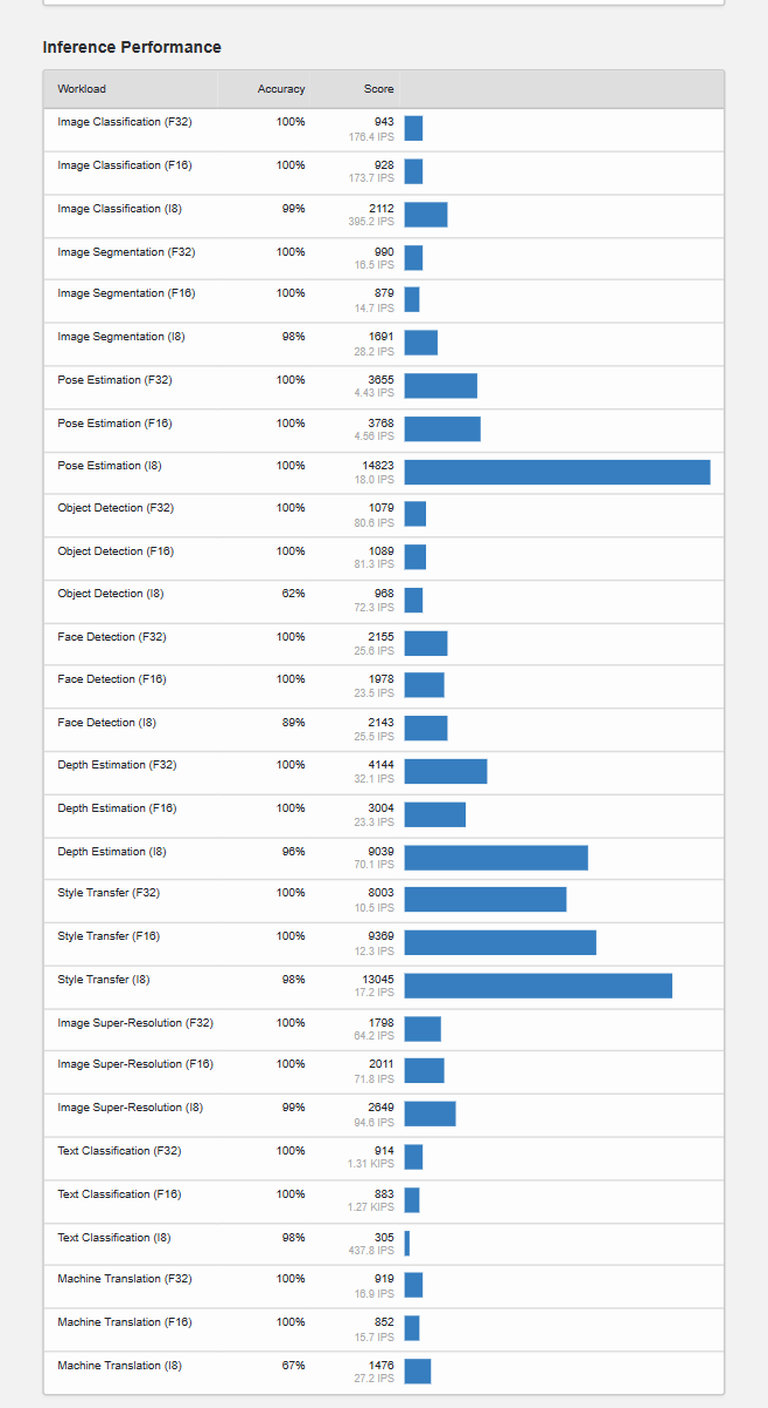
XPS 14's Intel Arc Graphics are processed using DirectML.

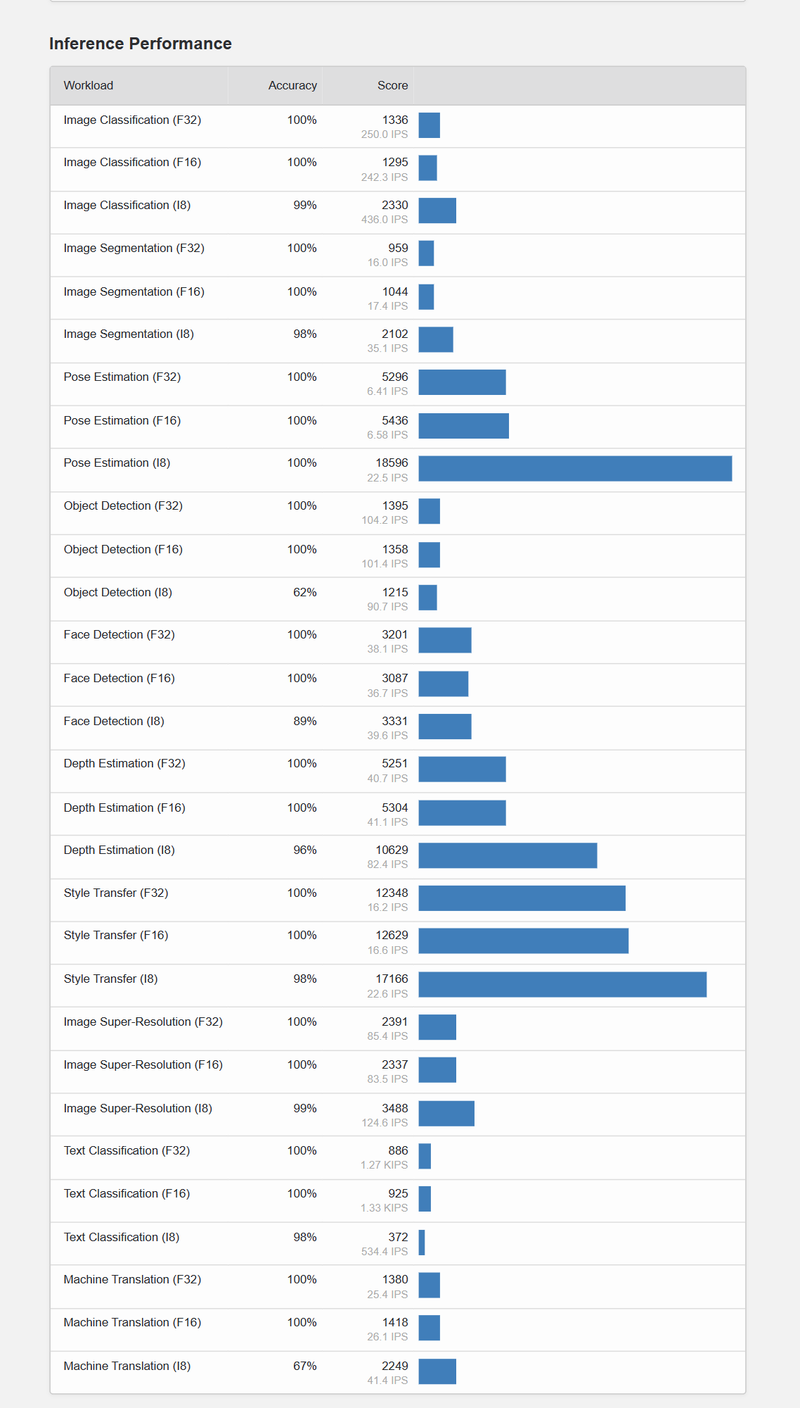
This is the result of processing the XPS 14's RTX 4050 with DirectML.
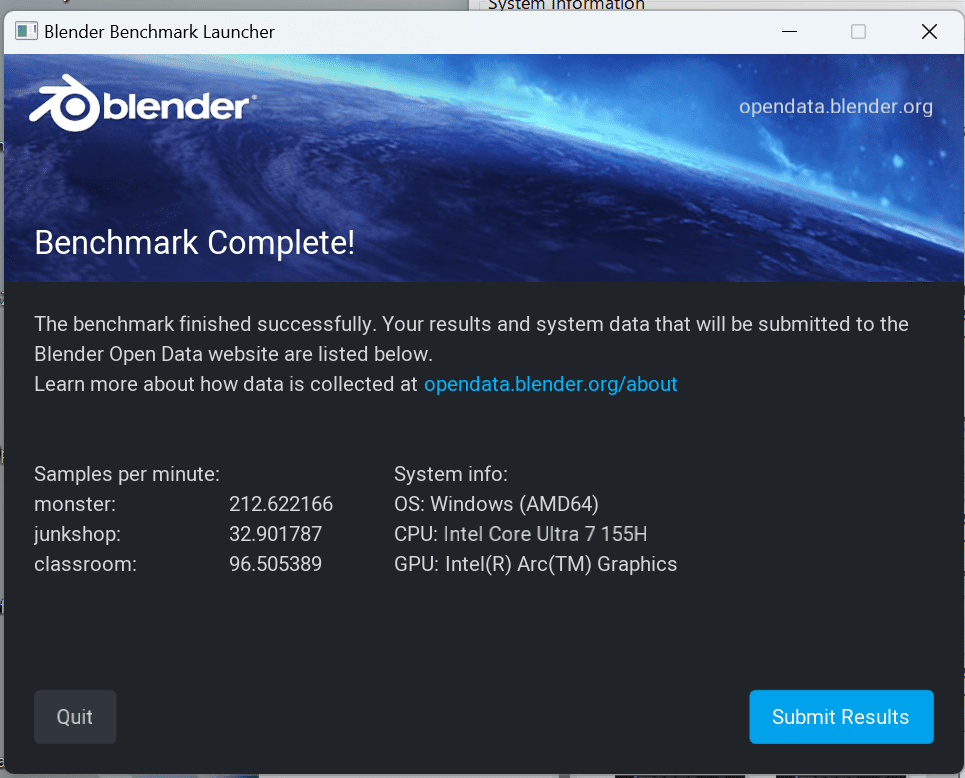
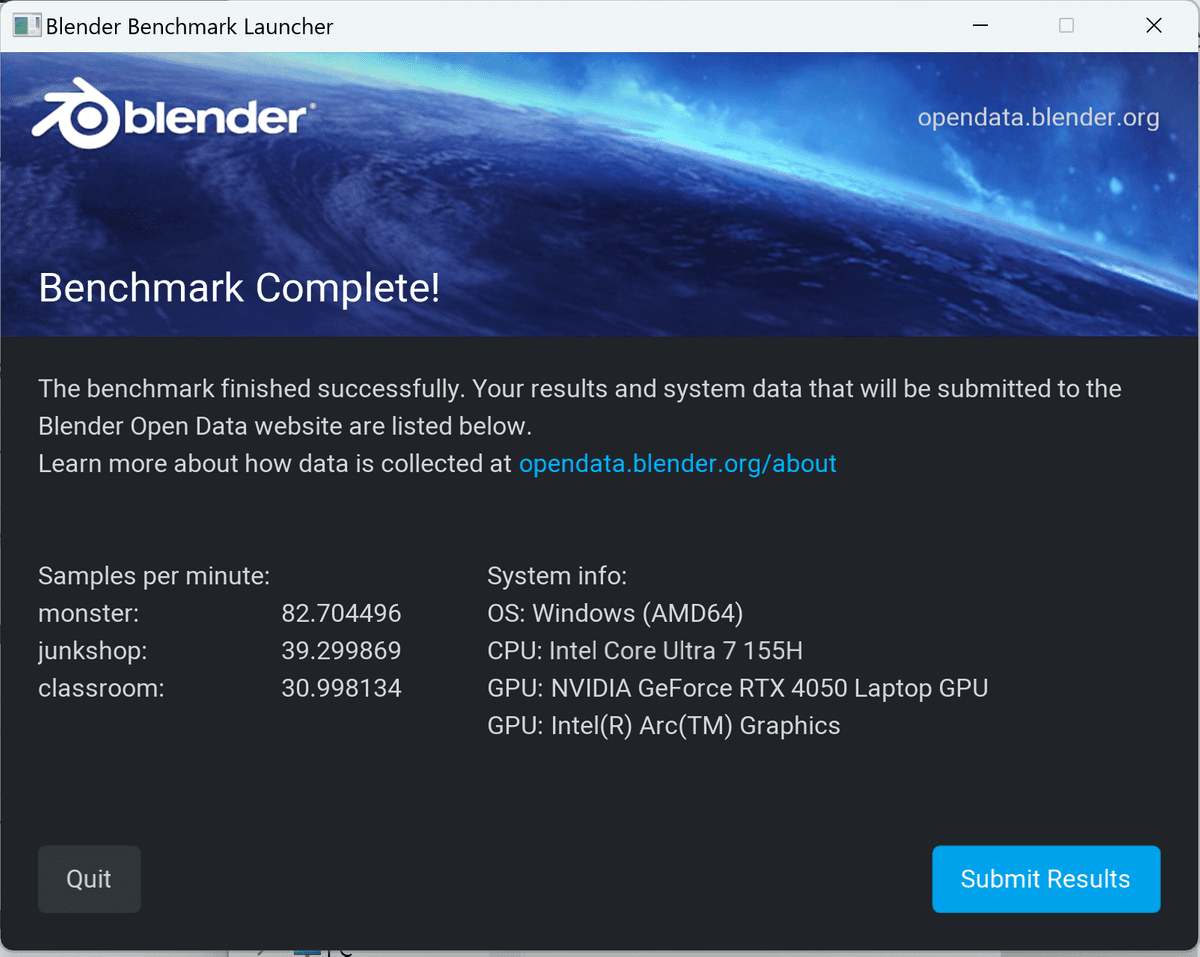
Next, we ran

The GPU scores for the XPS 13 were '212.622166' for monster, '32.901787' for junkshop, and '96.505389' for classroom.
The CPU score for the XPS 14 is '82.704496' for monster, '39.299869' for junkshop, and '30.998134' for classroom.
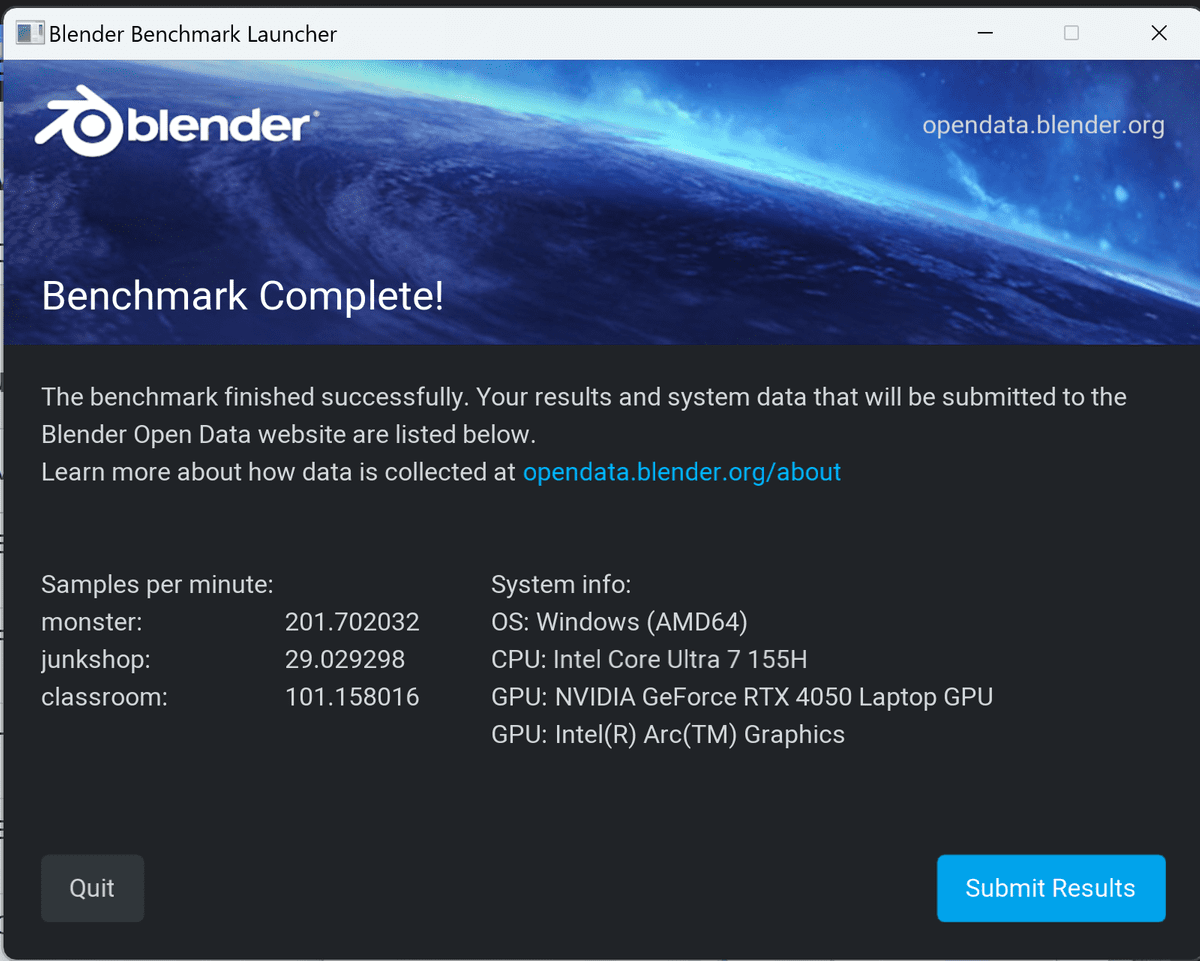
The XPS 14's GPU is Intel Arc Graphics, with monster scoring '201.702032', junkshop scoring '29.029298', and classroom scoring '101.158016'.
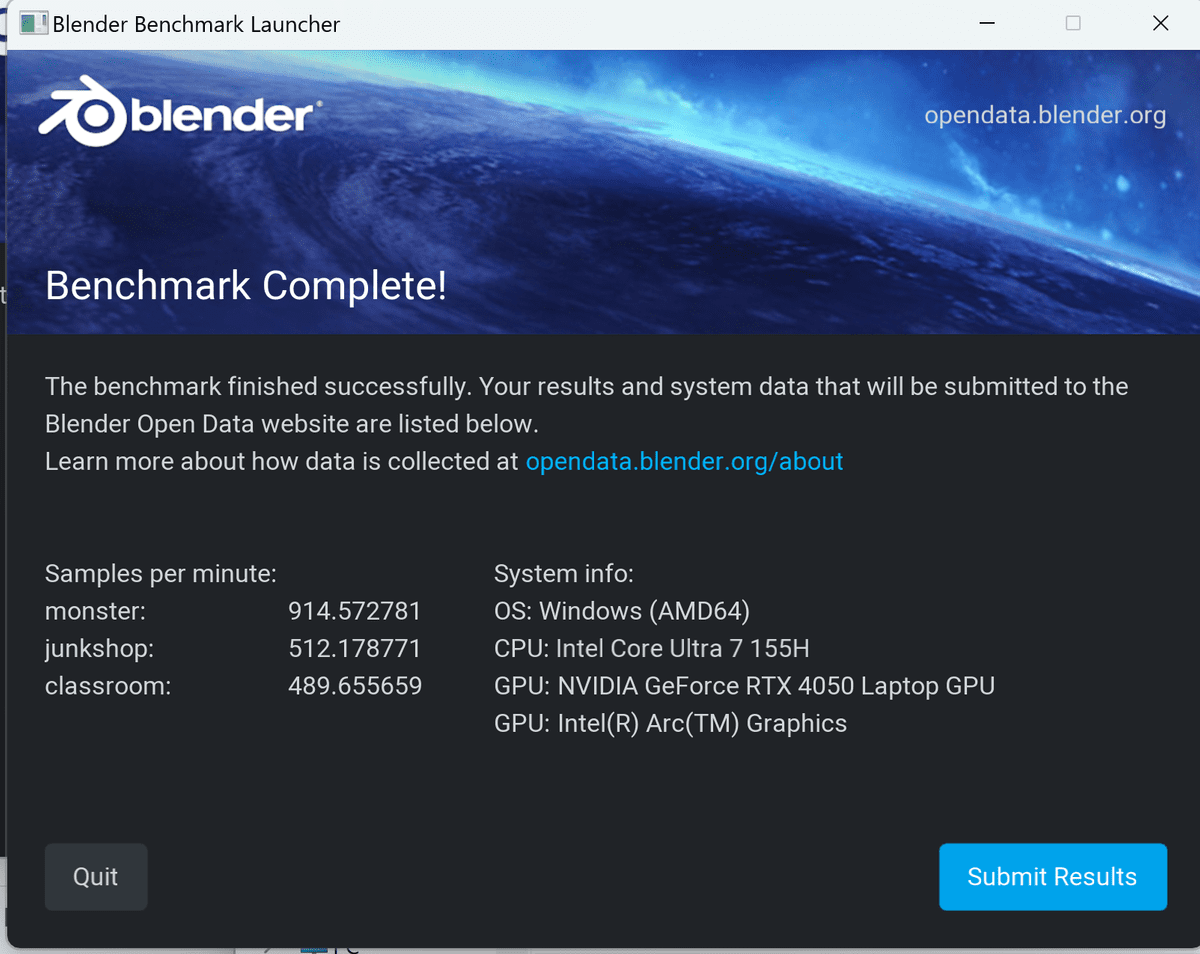
With the RTX 4050, monster scored '914.572781', junkshop scored '512.178771', and classroom scored '489.655659'.
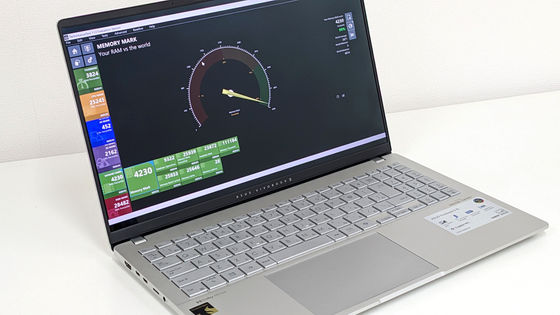
Next, we ran

The CPU score was '14615' and the percentile was '52%'.
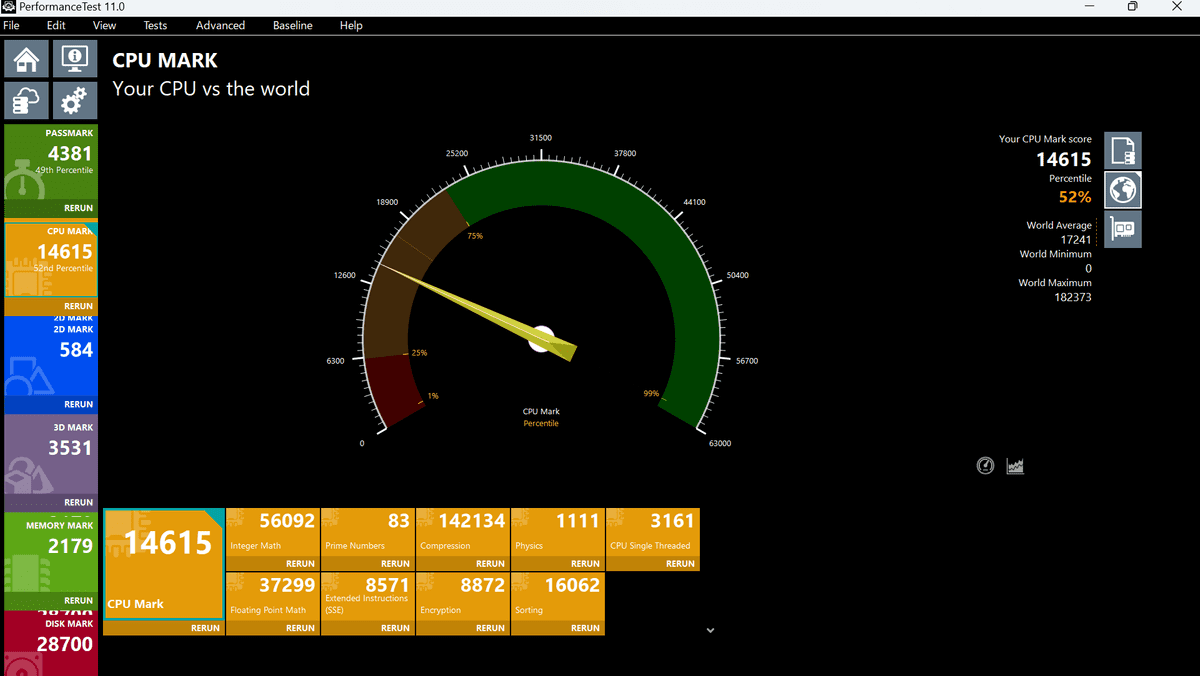
The 2D score is '584' and '46%'. Measured using the CPU's built-in GPU, 'Intel Arc Graphics'.

The 3D score was 3531, which is quite low at 33%.
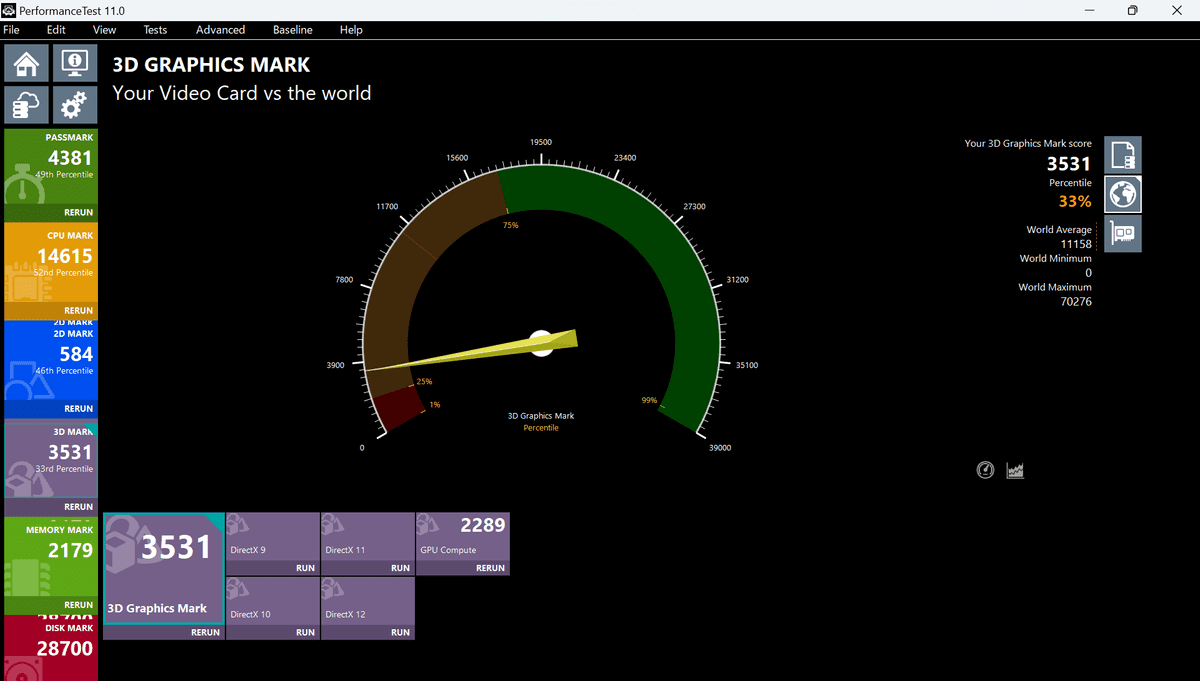
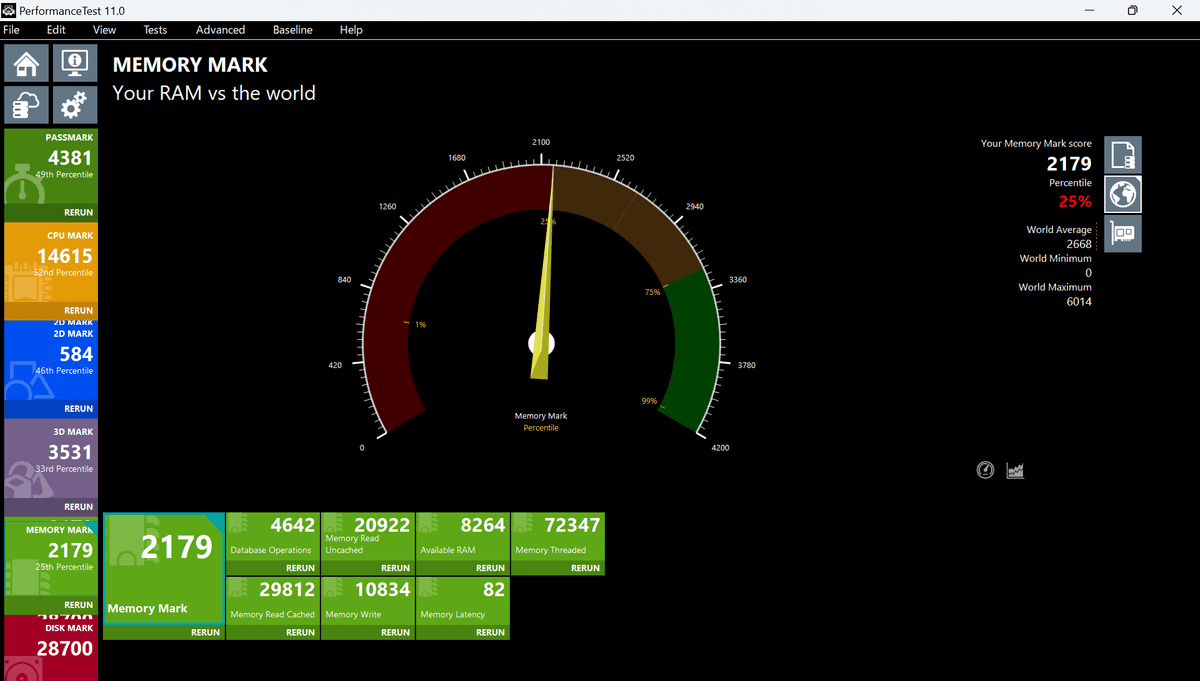
The memory score is 25% of 2179.
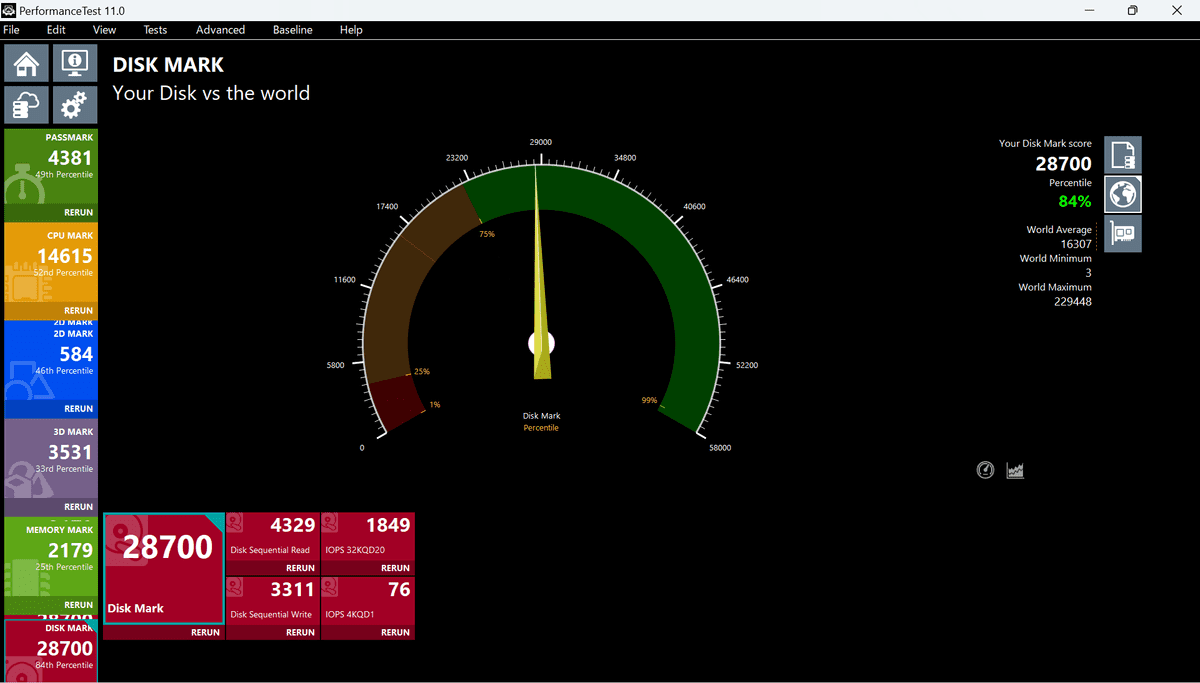
The disk score was '28700' and '84%', which was high.
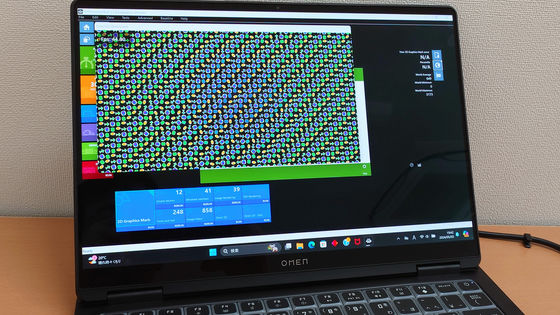
Next, we measured the XPS 14. The overall score was '6632' and the percentile was '69%'.

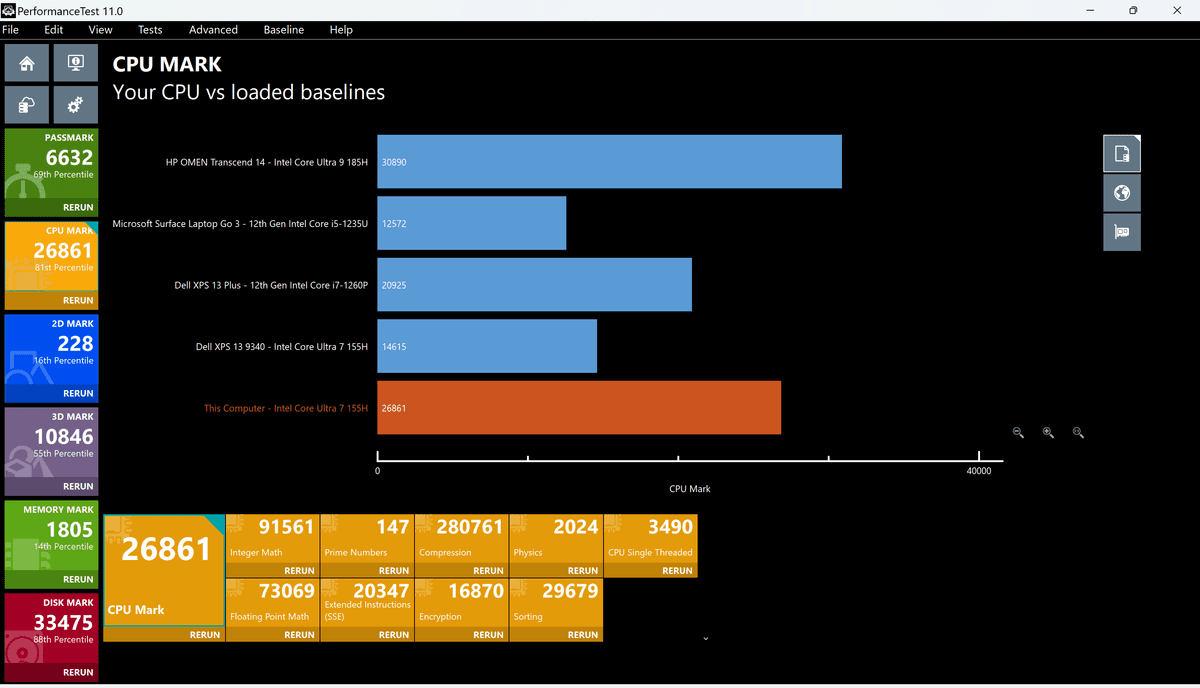
The CPU score was '26861' or '81%'.
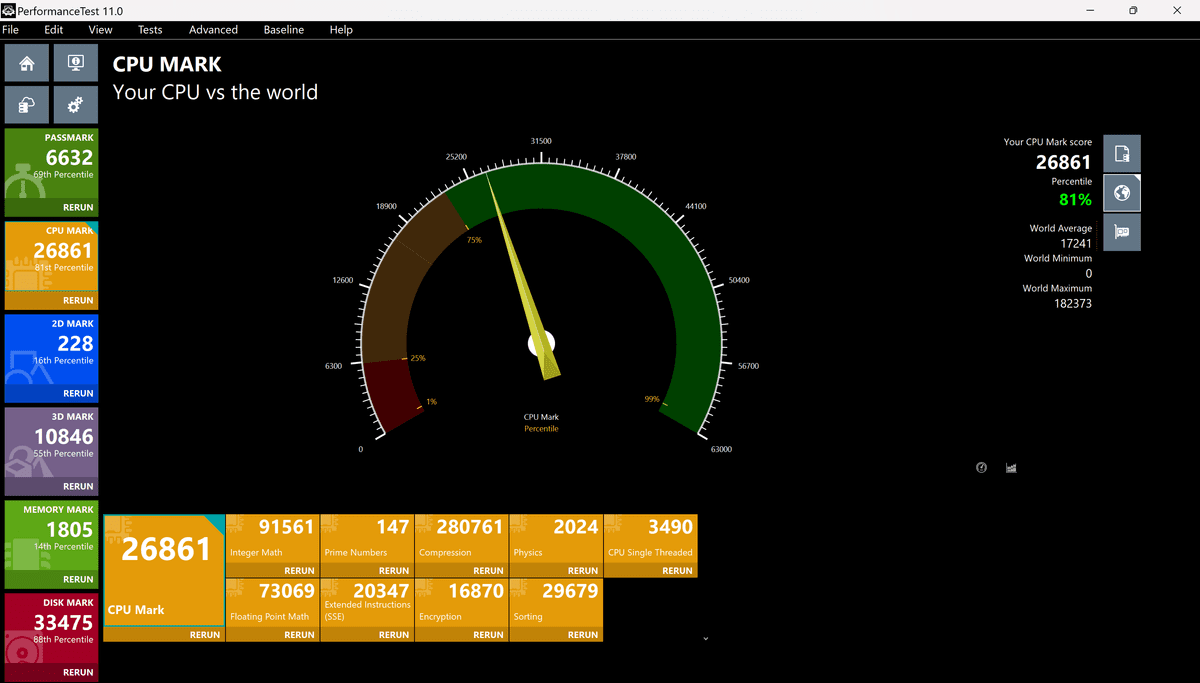
The 2D score was 228, or 16%, which is the measurement with the optional RTX 4050.

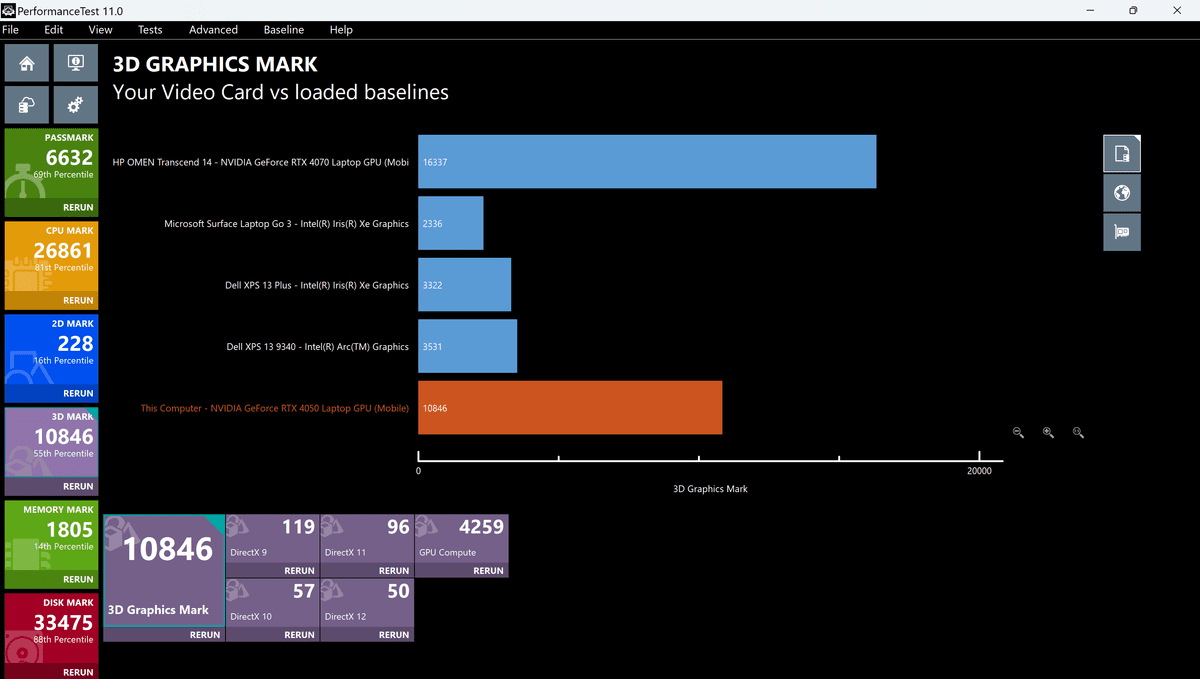
The 3D score was '10846' or '55%'.
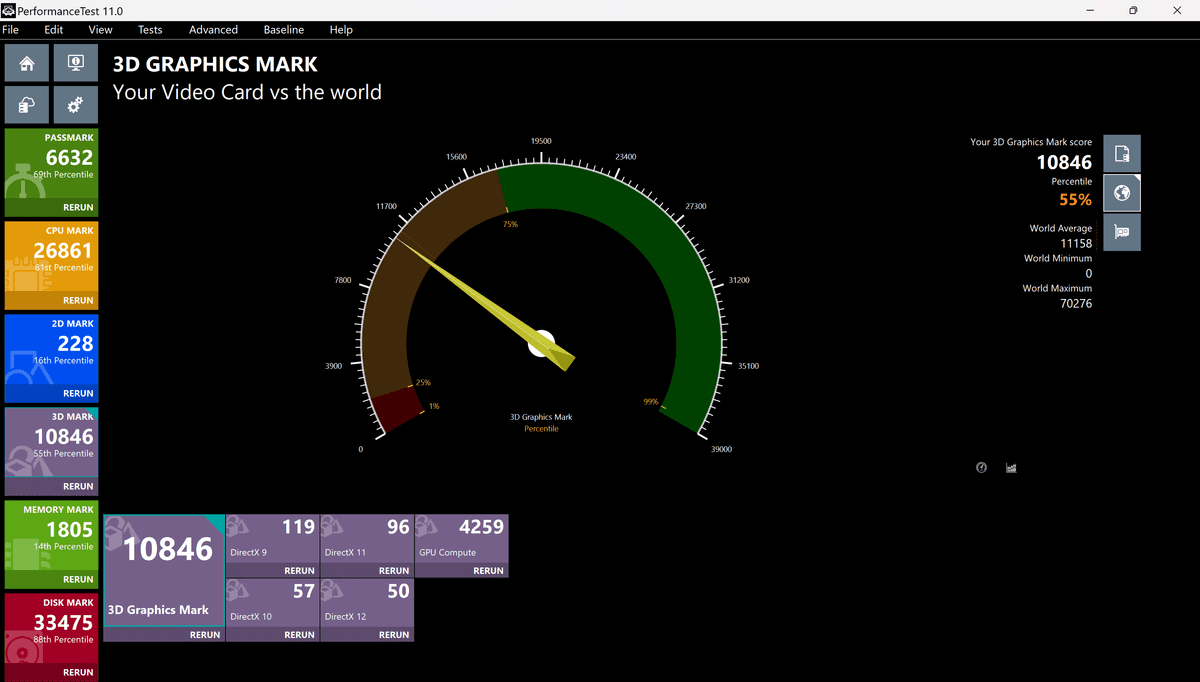
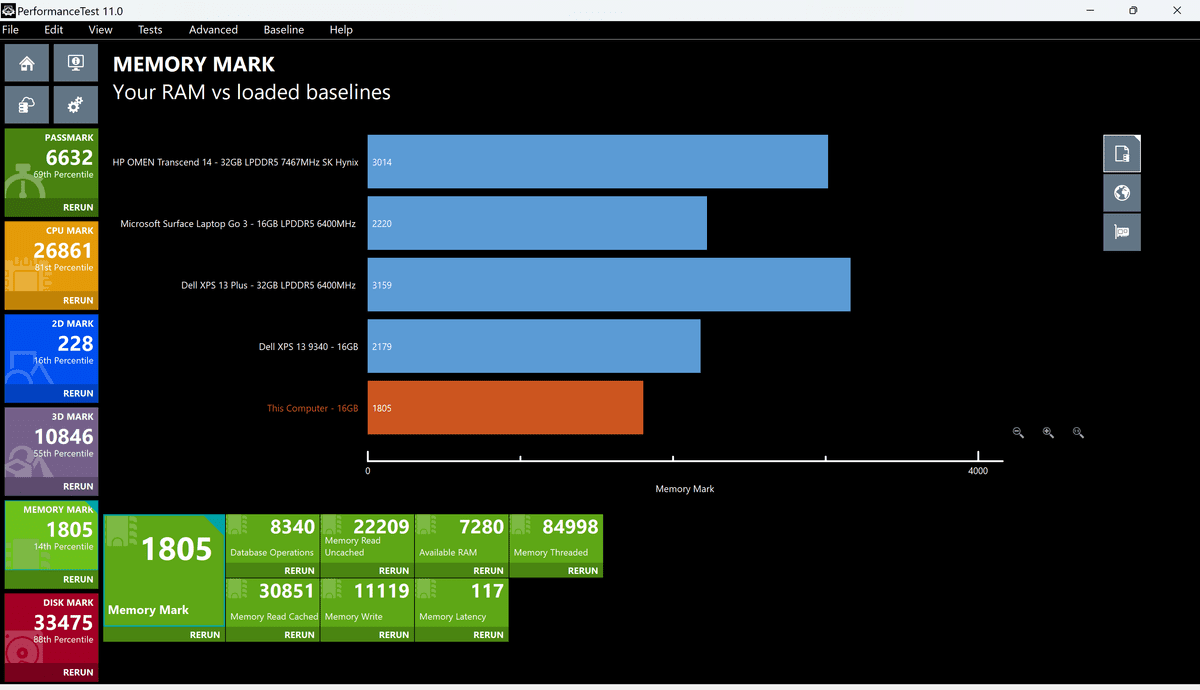
The memory score was '1805' or '14%'.

The disk score was '33475' or '88%'.

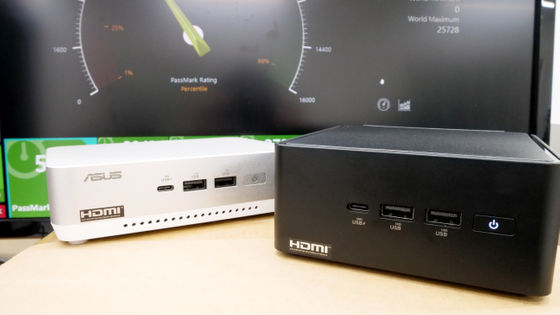
Next, we pulled out the logs of benchmark results previously run by the GIGAZINE editorial department and used them as a baseline to compare

Next up is the CPU score. As expected, the XPS 13's results were a bit disappointing.
2D score. The XPS 13 is improving.

3D score. The RTX 4050 shows a strong increase.
Memory score. XPS 13 Ultra comes out on top.
Finally, the disk score: XPS 13 Ultra, XPS 13, XPS 14.

Next, we ran the '
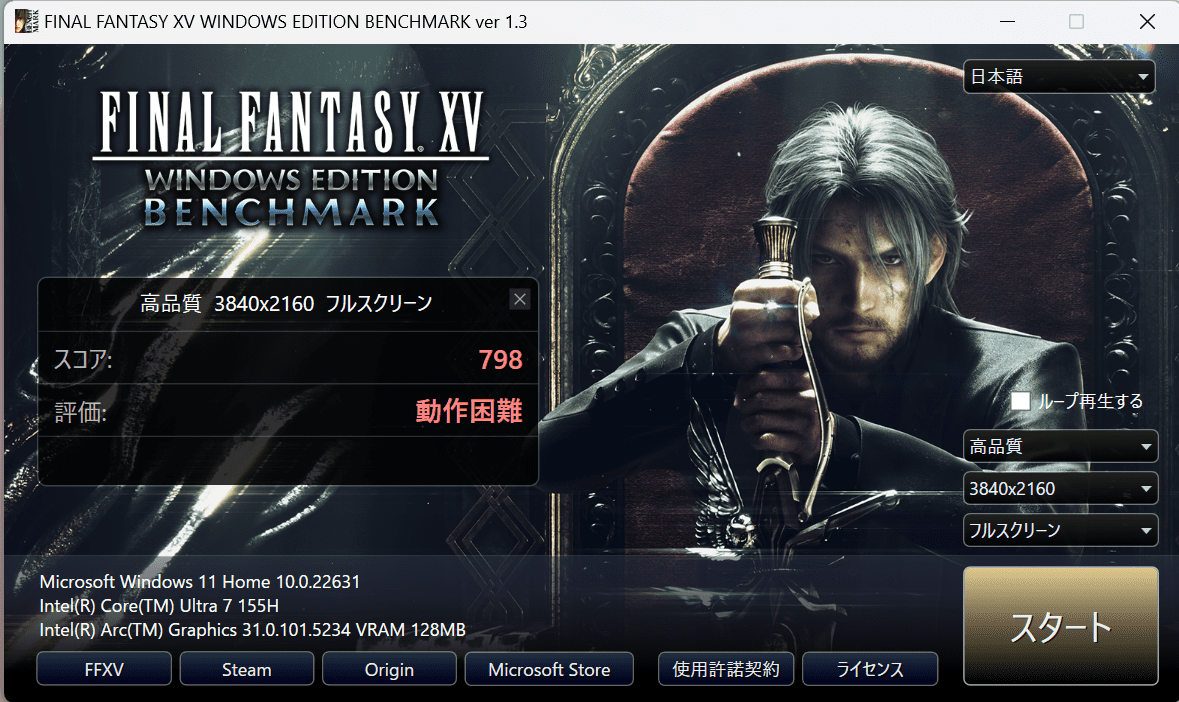
Setting the resolution to 1980x1080, the optimum value for the XPS 13, slightly improves the performance, but the score is '2018' and the rating is 'heavy.' It's probably better to lower the quality when playing games.

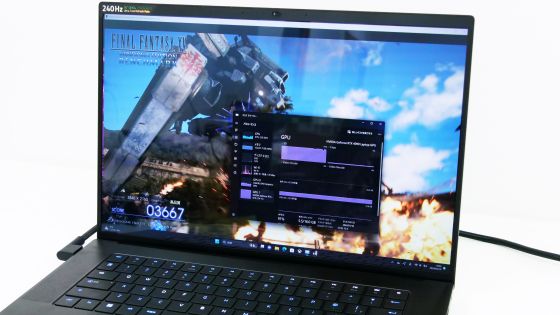
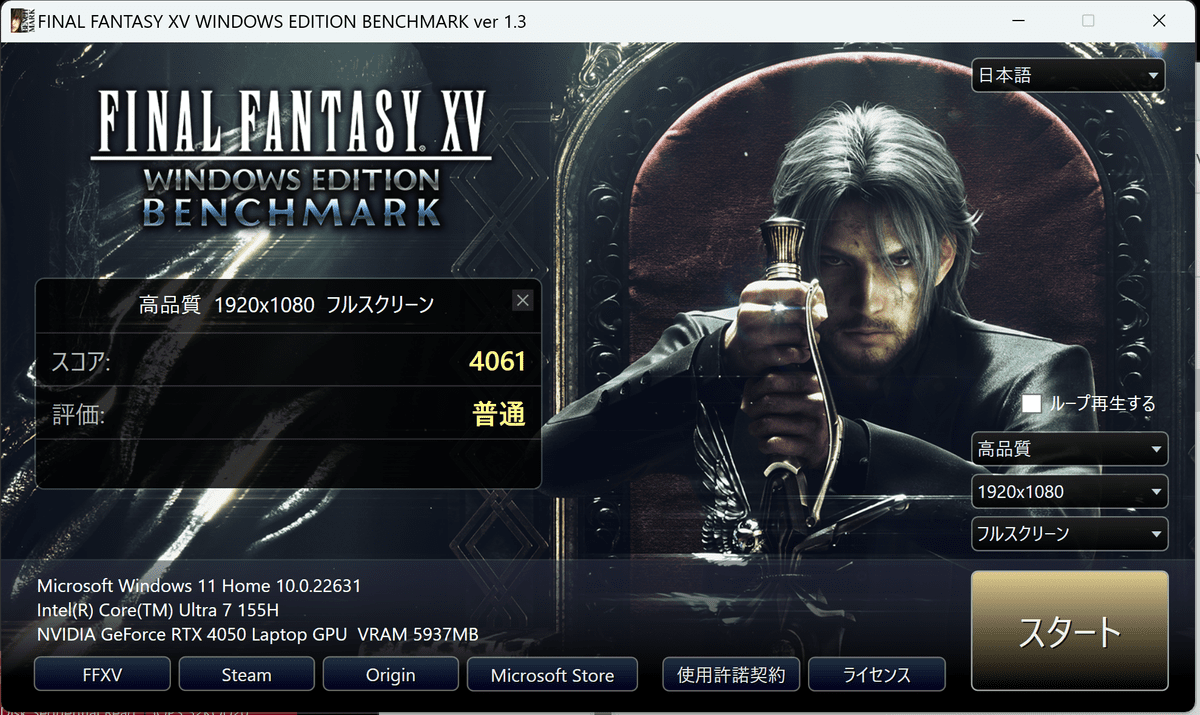
I ran the benchmark in the same way, hoping that the numbers would go up a bit more on the XPS 14 with the RTX 4050. The results for 'Image quality: High quality', 'Resolution: 3840 x 2160', and 'Window: Full screen' were a score of '2013' and a rating of 'Heavy'.

When the resolution was changed to '1980 x 1080', the score became '4061' and the rating became 'average'. Since only the XPS 14 has the option of the RTX 4050 GPU, if you want to play 3D games comfortably, it is better to select the option to add the RTX 4050 to the XPS 14.
We will be publishing an article at a later date detailing how the NPU is actually used to process generative AI, how much heat is generated during processing, and how long the battery lasts.
Related Posts: