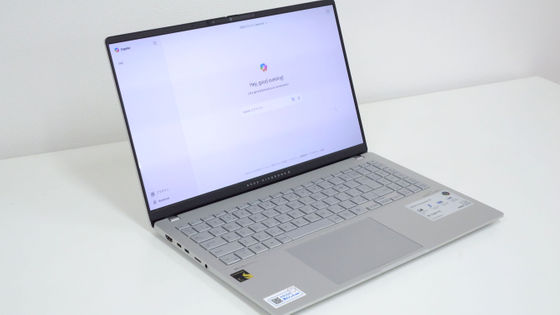
I ran various benchmarks on the 'ASUS Vivobook S 15 S5507QA' laptop equipped with the 'Snapdragon X Elite'
I was able to borrow
ASUS Vivobook S 15 (S5507) | Laptop | ASUS Japan
https://www.asus.com/jp/laptops/for-home/vivobook/asus-vivobook-s-15-s5507/
asusjp-spec-S5507QA.pdf
(PDF file) https://www.asus-event.com/pr/asusjp-spec-S5507QA.pdf
You can see the photo review of the Vivobook S 15 in our previous article.
Photo review of 'ASUS Vivobook S 15 S5507QA' notebook PC with numeric keypad compatible with 'Copilot+ PC' equipped with Snapdragon X Elite - GIGAZINE
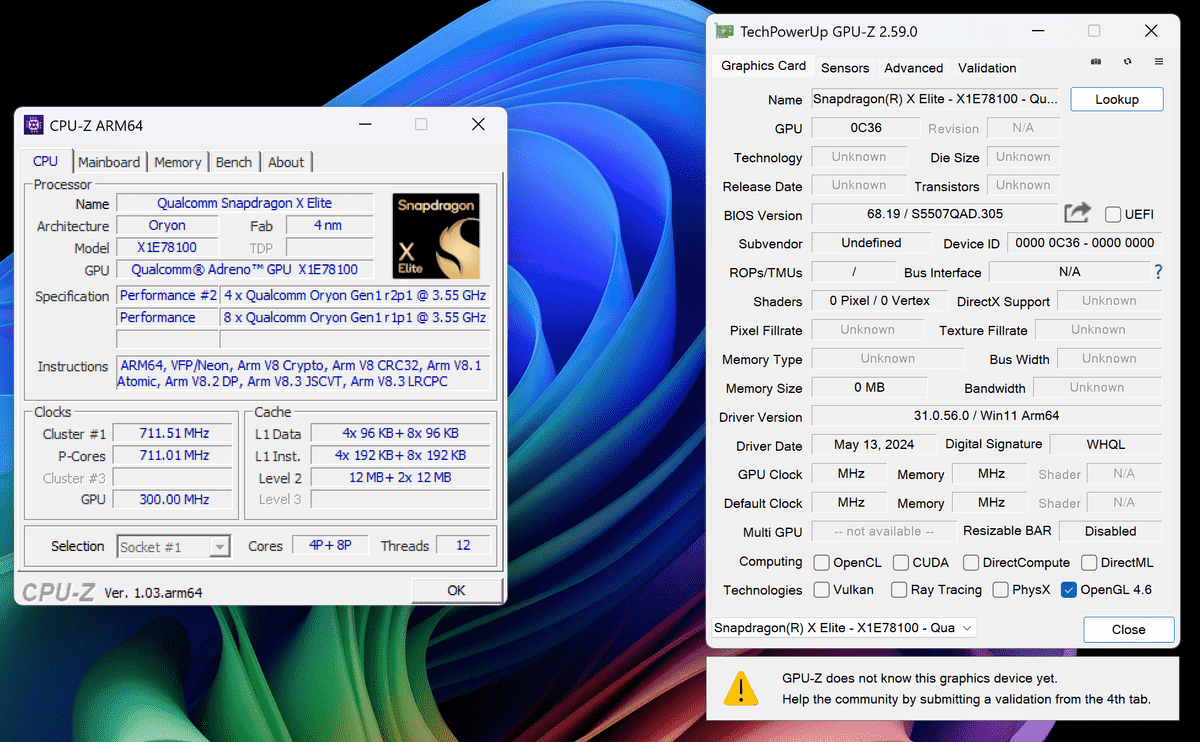
The details of the Vivobook S 15 confirmed by CPU-Z and GPU-Z are as follows. The CPU is 'Qualcomm Snapdragon X Elite' with 12 cores and 12 threads. The ARM version of CPU-Z is used. The GPU is displayed as 'Qualcomm Adreno GPU X1E78100' in CPU-Z. In addition, GPU-Z gave an error saying 'Device not in data'.
When I checked the storage with '
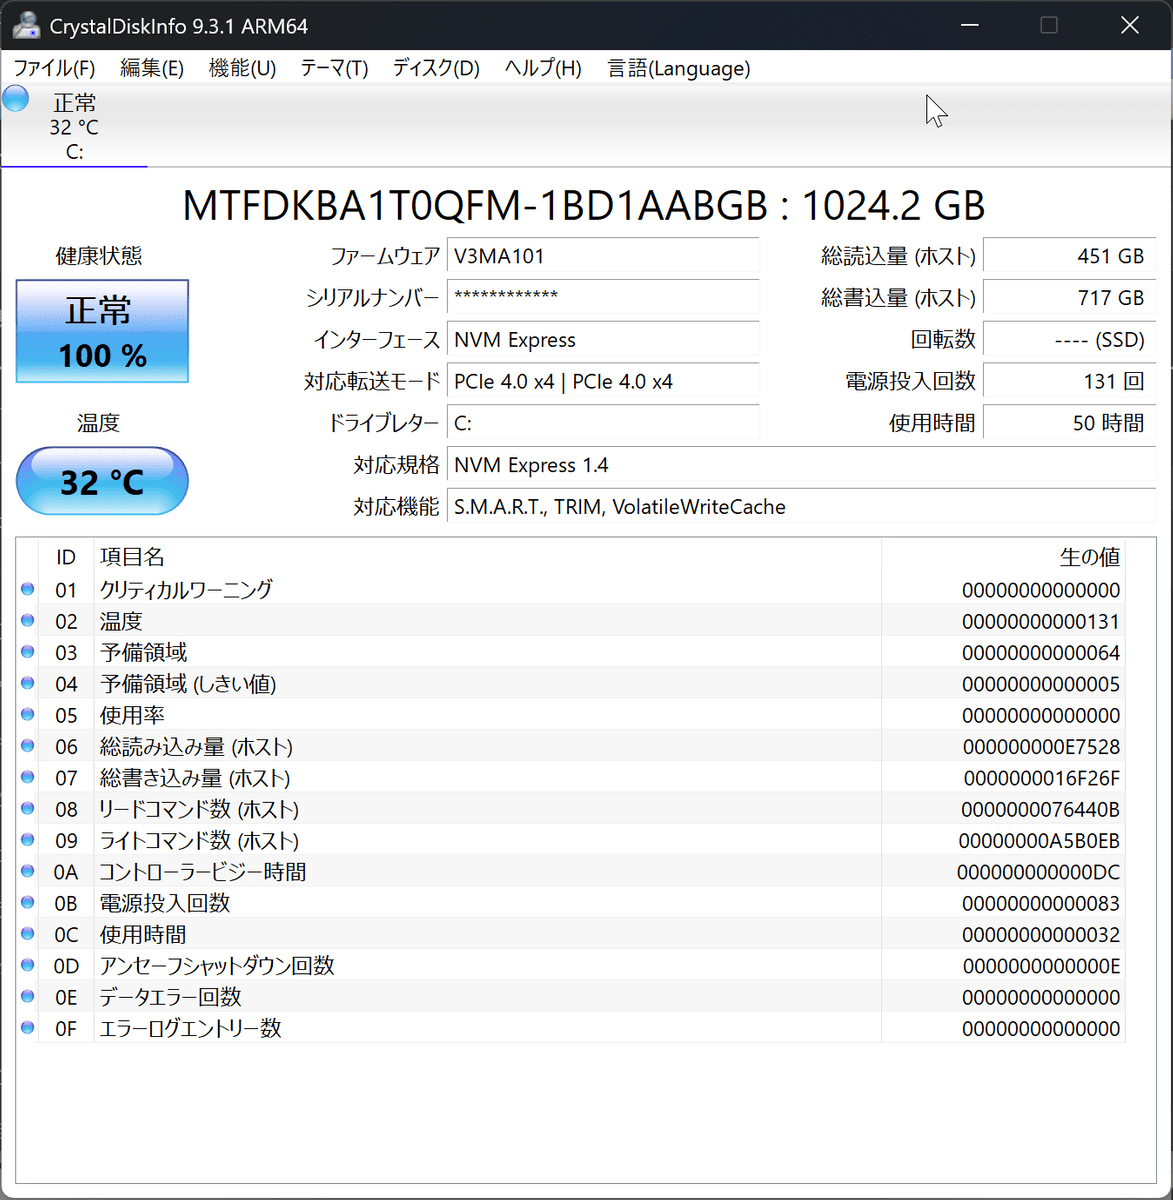
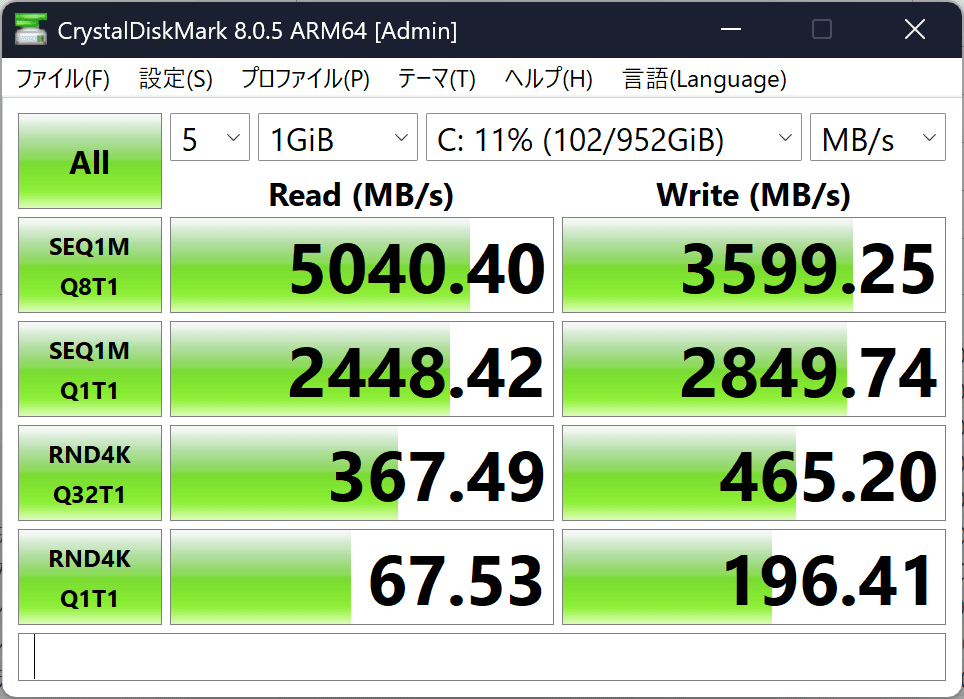
Next, we performed the benchmark with the device plugged in. Note that we used the ARM-compatible version of various benchmark apps unless otherwise noted. The transfer speed of the Vivobook S 15's SSD measured with '
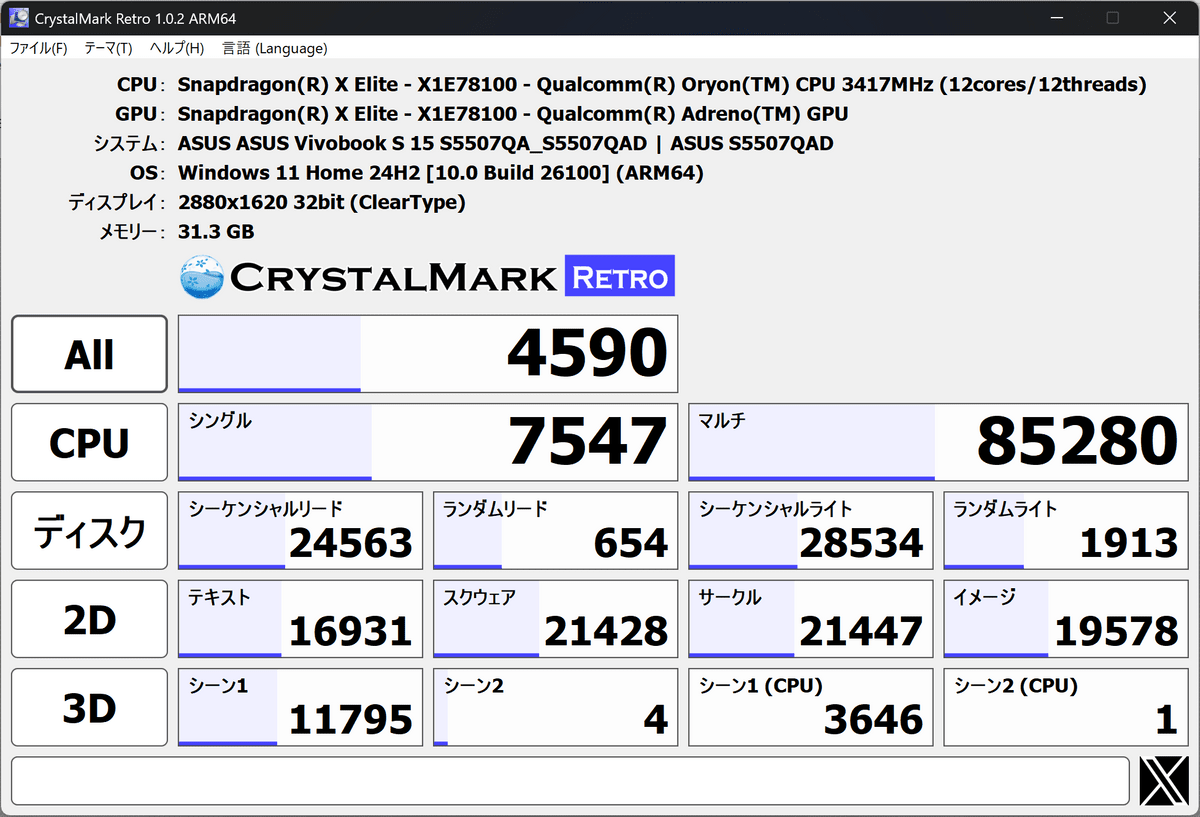
Next, we ran CrystalMark Retro , which measures the performance of the CPU and 2D and 3D graphics. The Vivobook S 15's overall score was 4590, with a CPU single-core score of 7547 and a multi-core score of 85280.
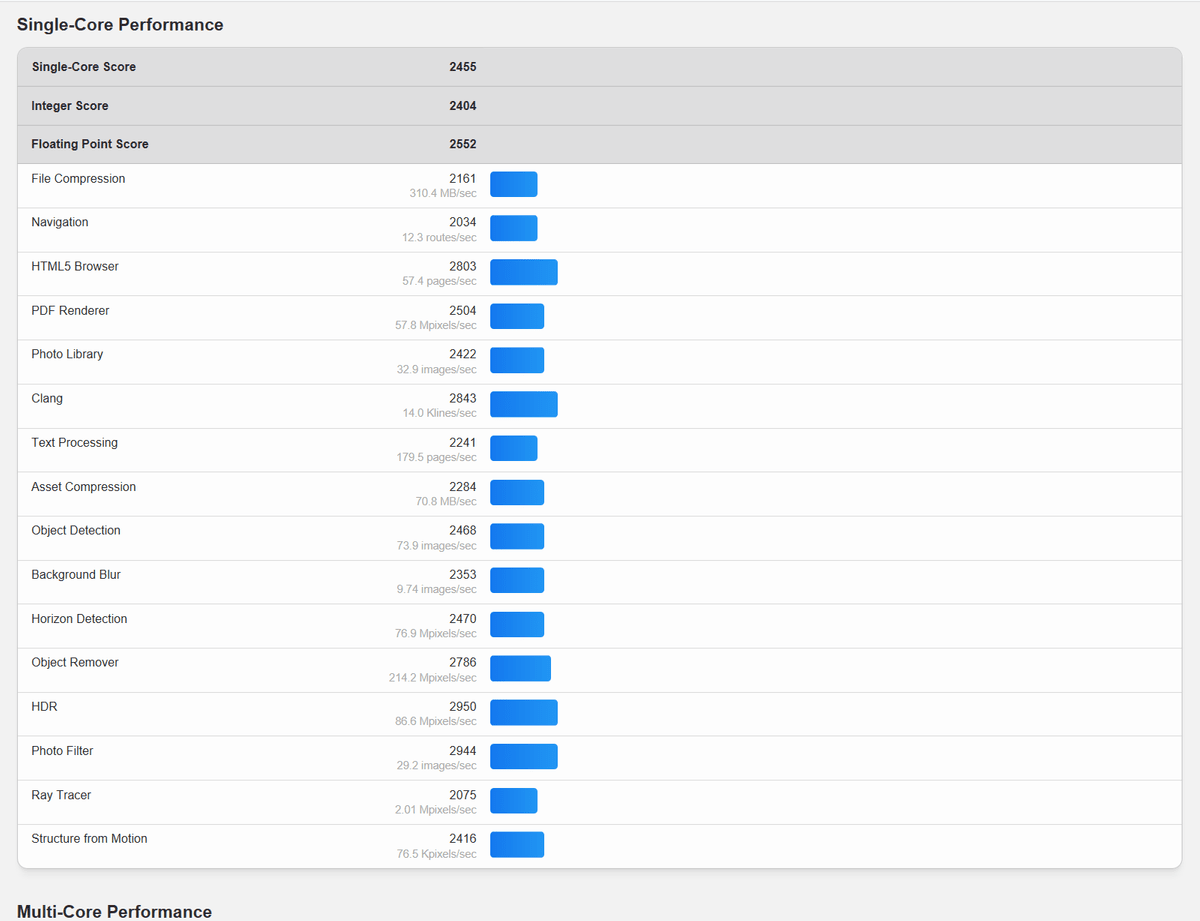
The single-core score details look like this.
The multi-core score details look like this.
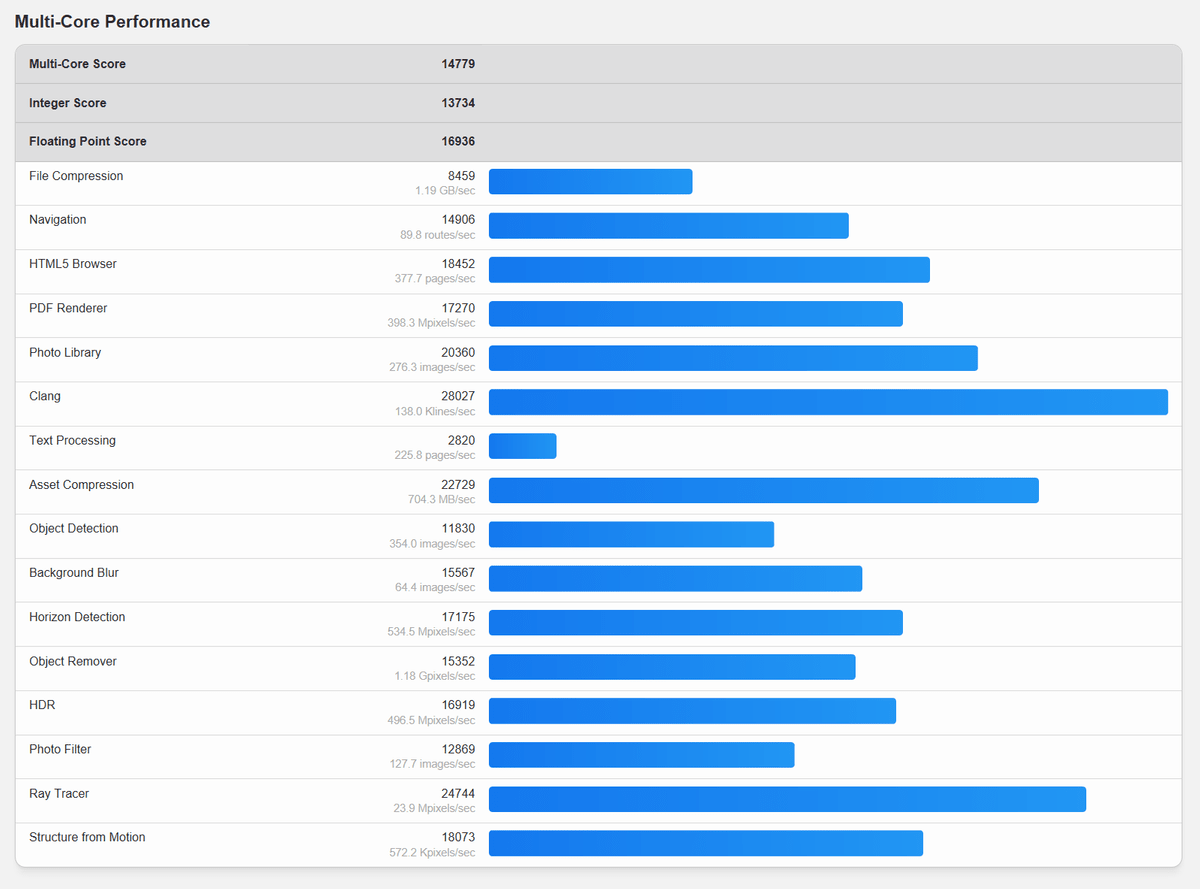
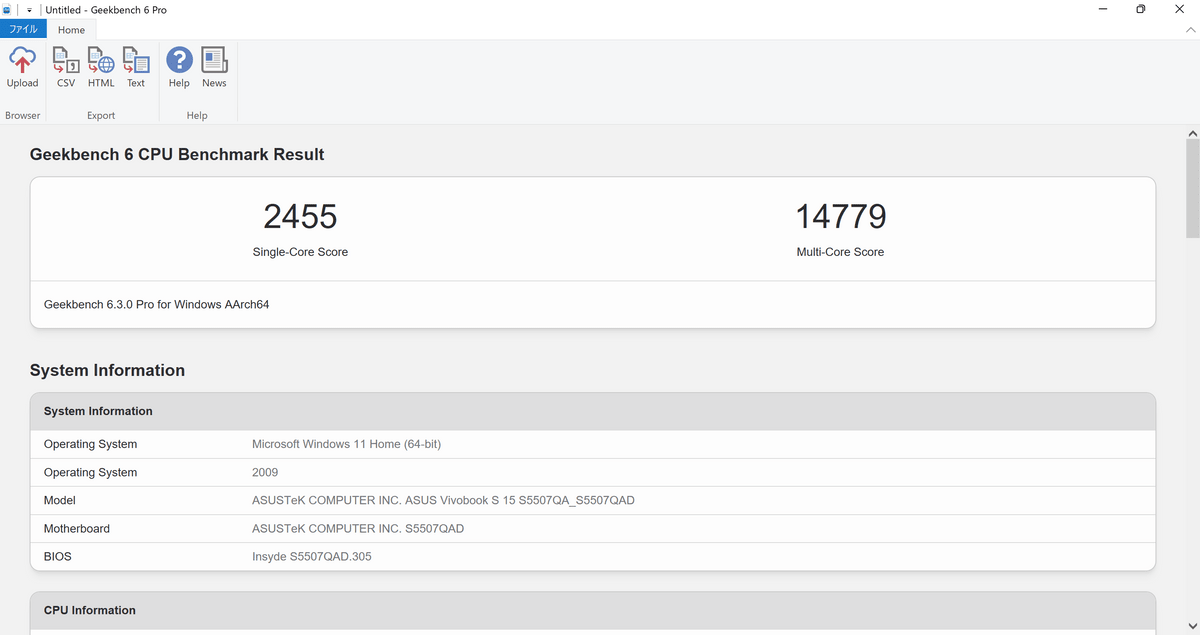
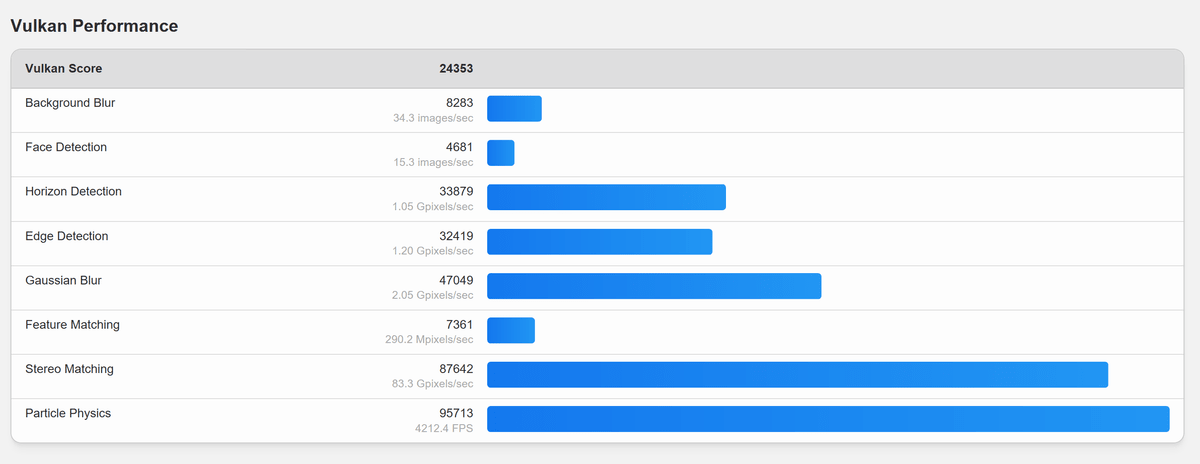
Next, we measured the GPU performance with Geekbench 6. First,
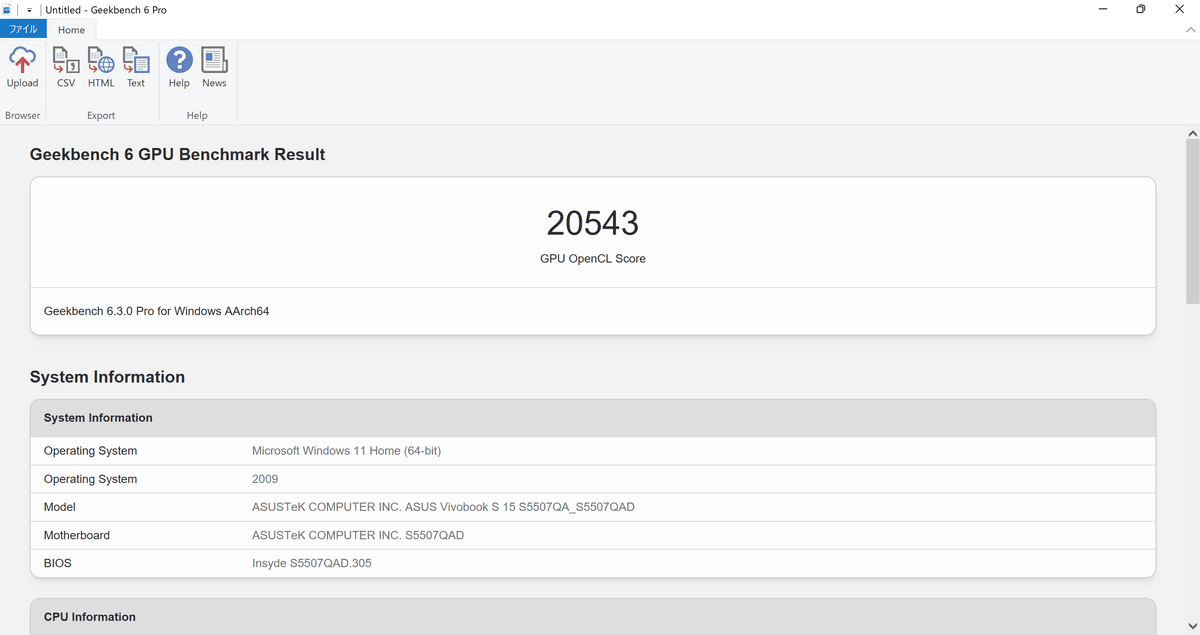
The details are as follows.
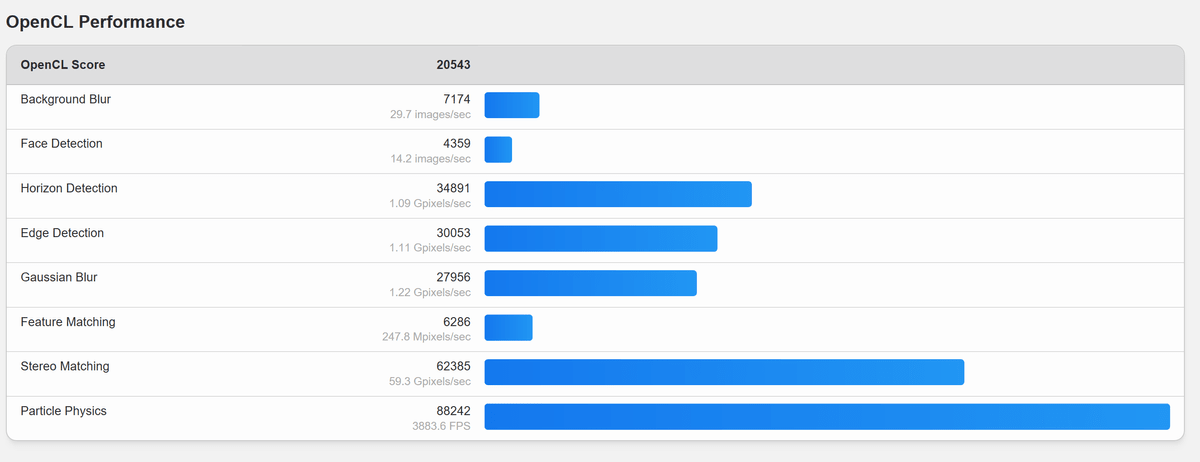
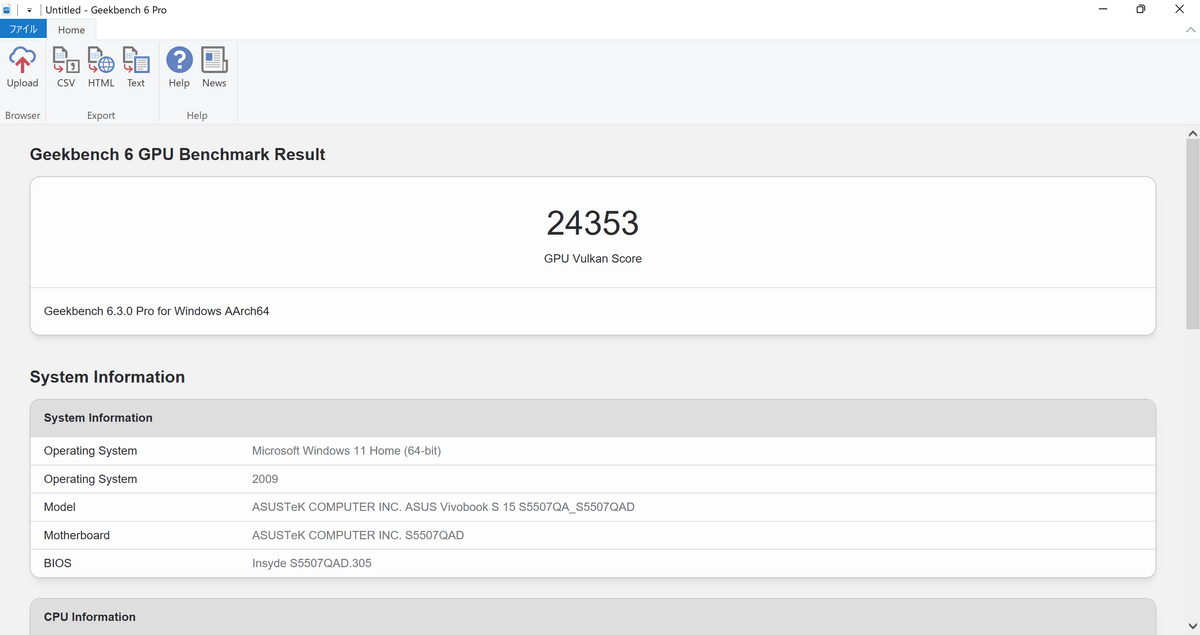
Details:
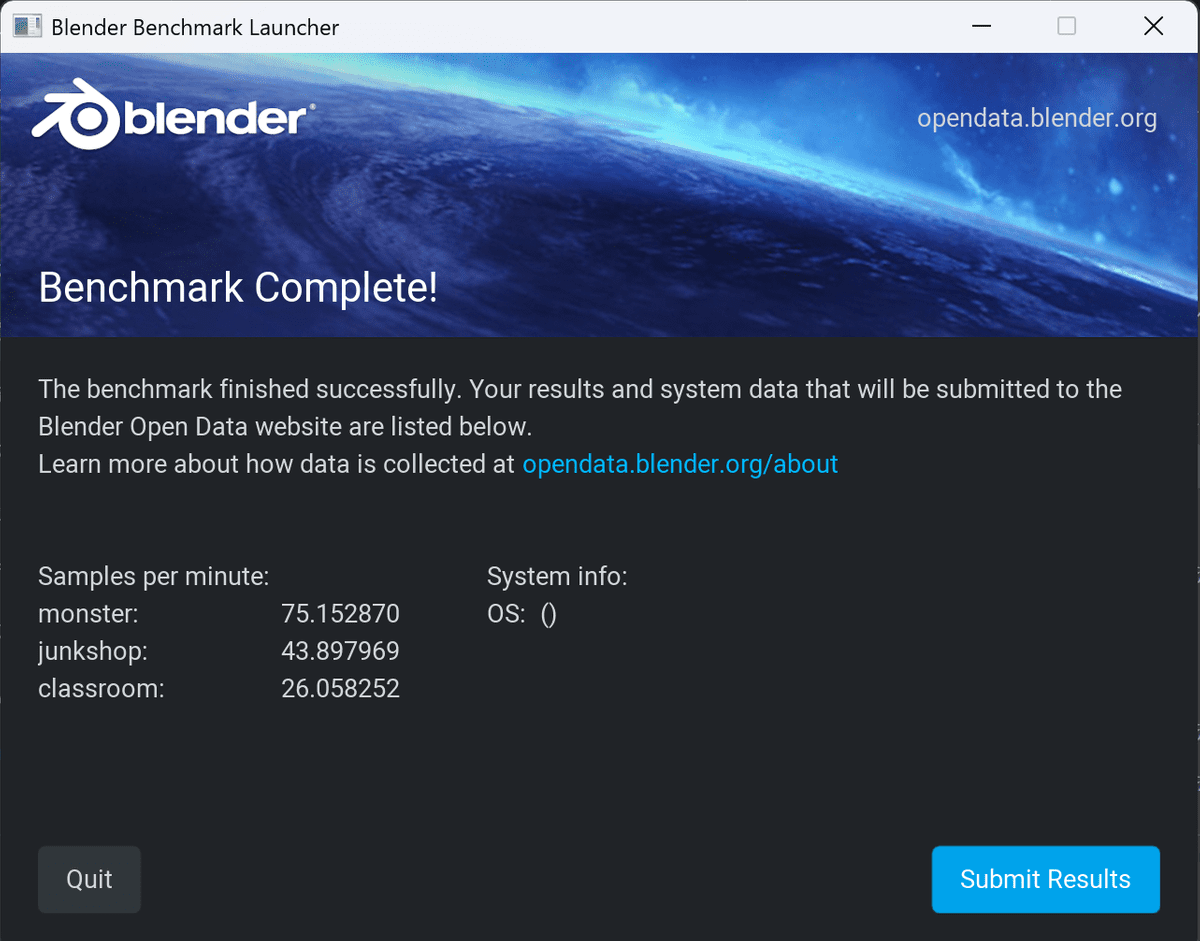
Next, we measured using Blender's
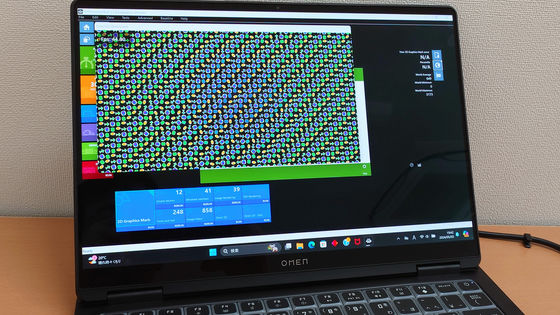
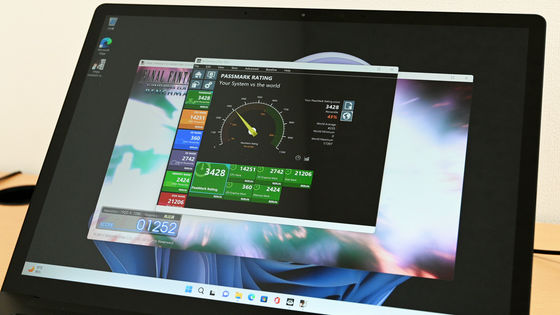
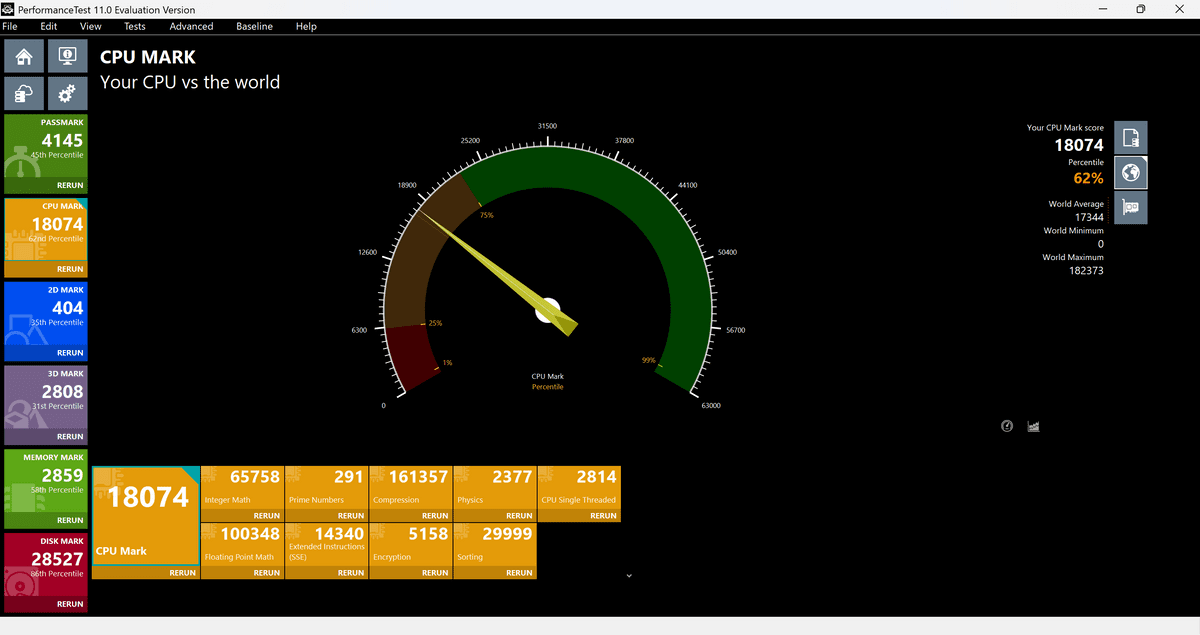
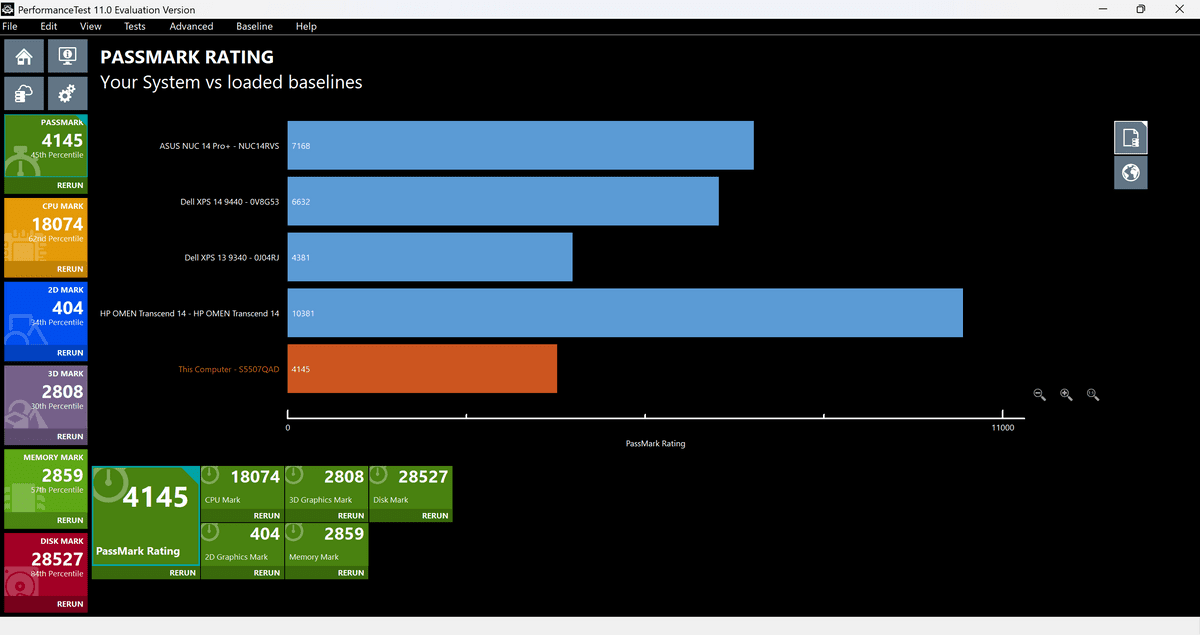
Next we will run

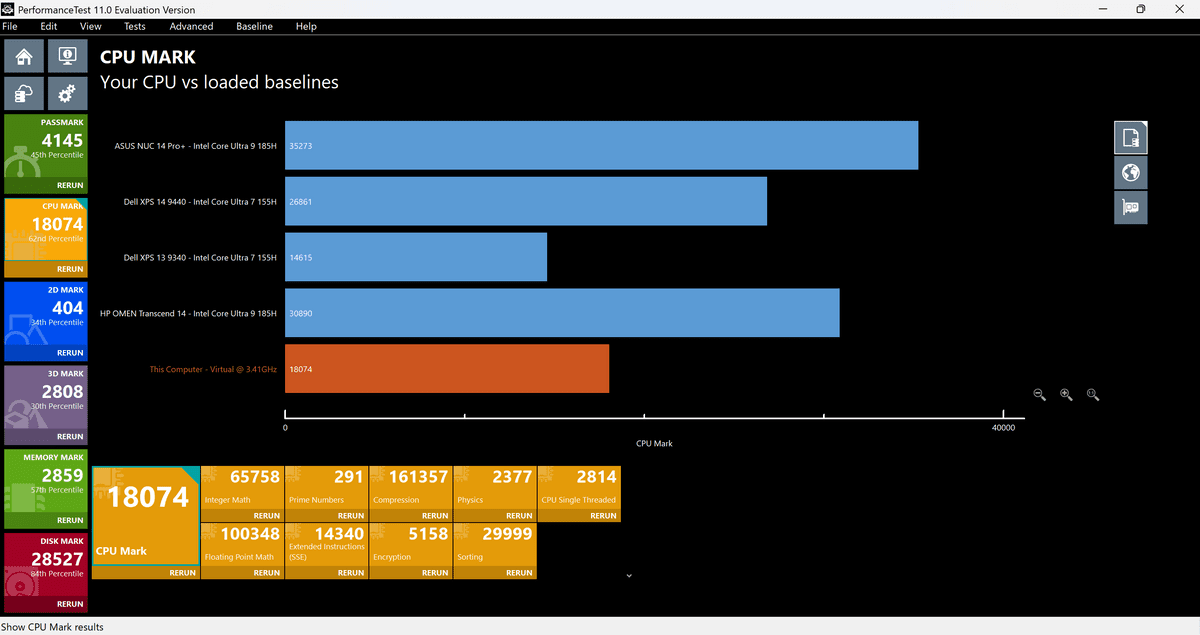
The CPU score was '18074' and the percentile was '62%'.
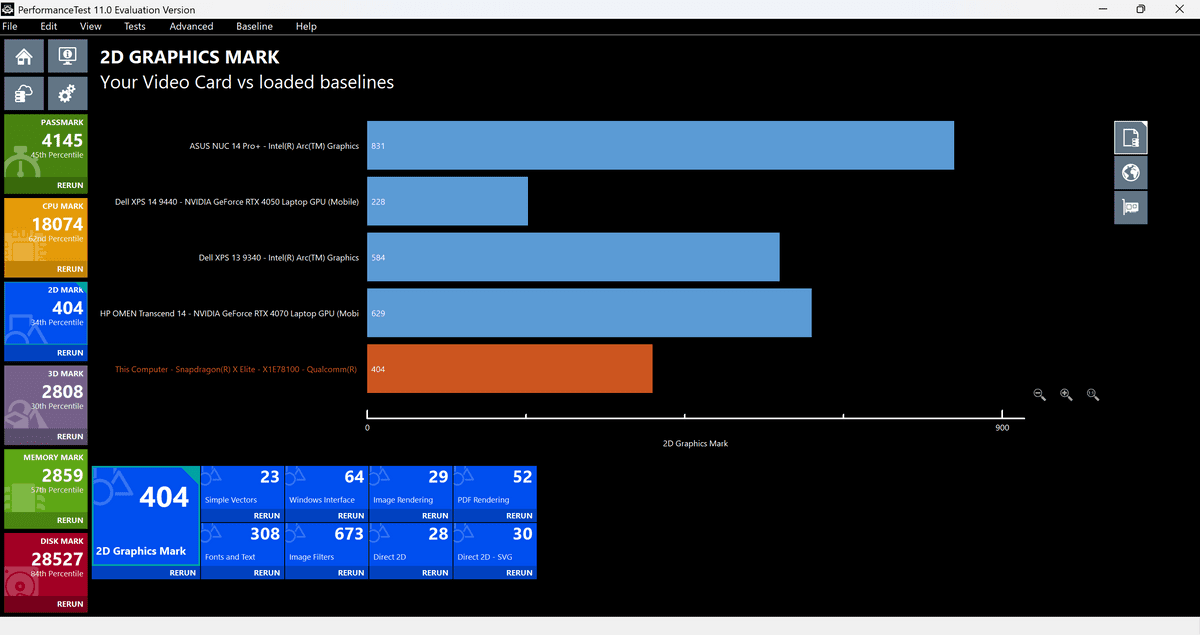
The 2D score was '404' or '34%'.

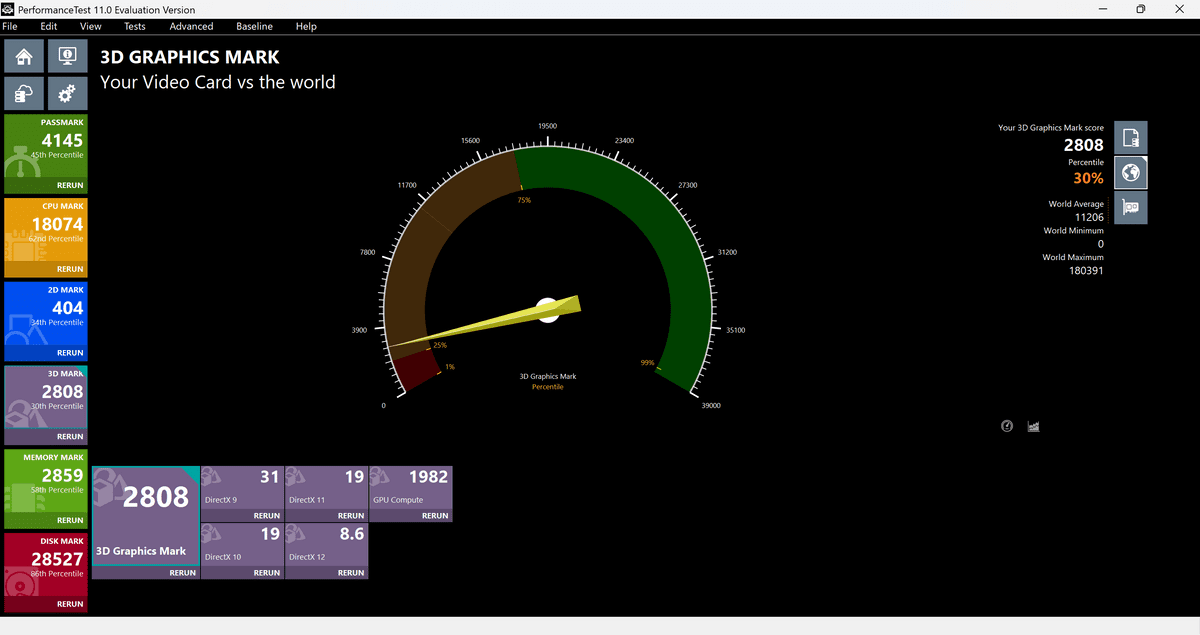
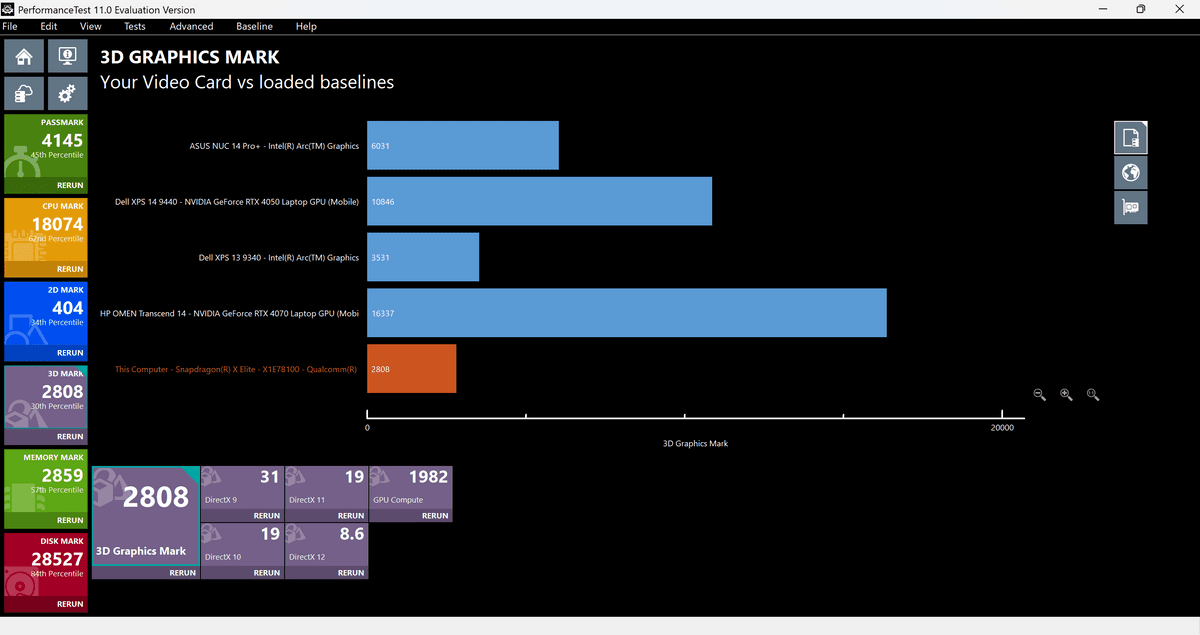
The 3D score was '2808' or '30%'.
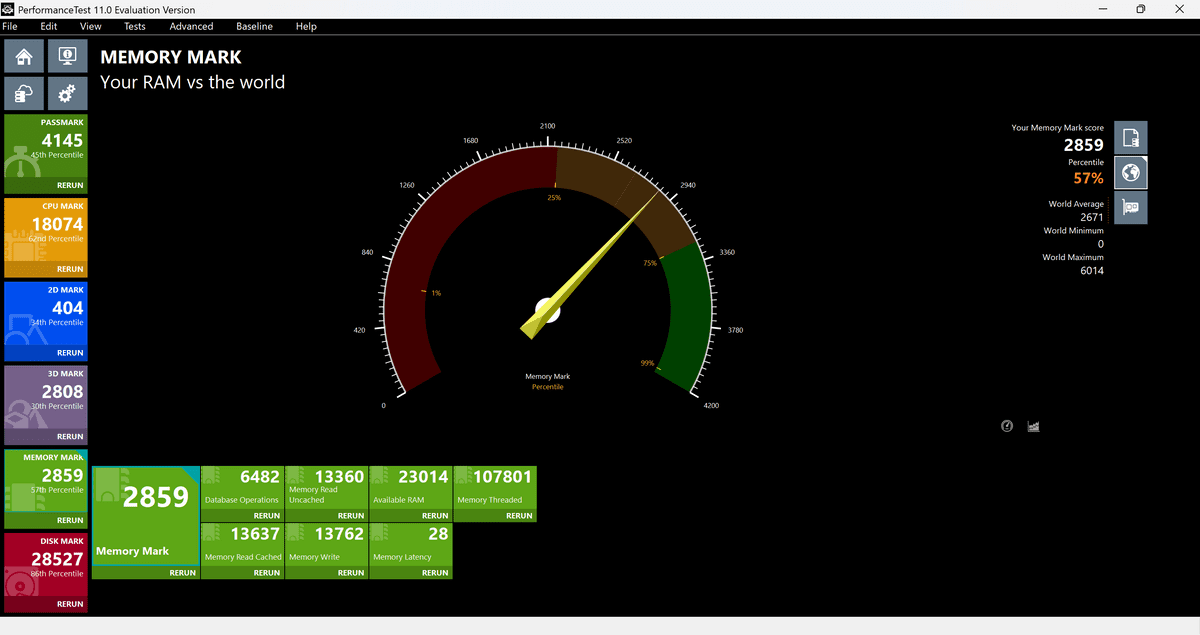
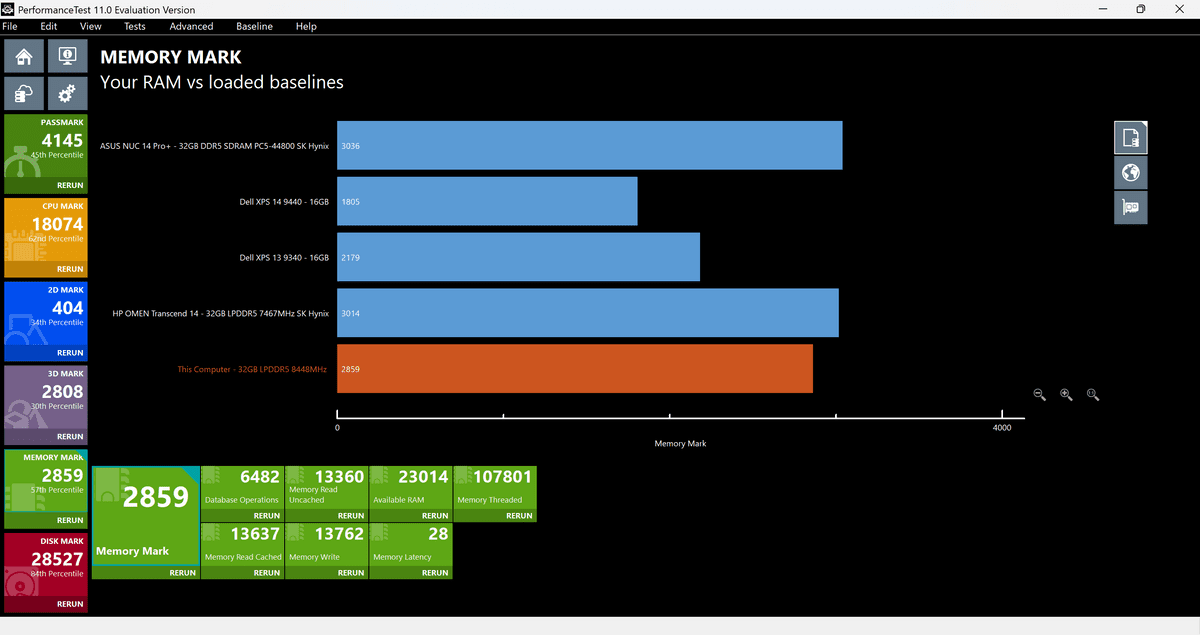
The memory score was '2859' or '57%'.
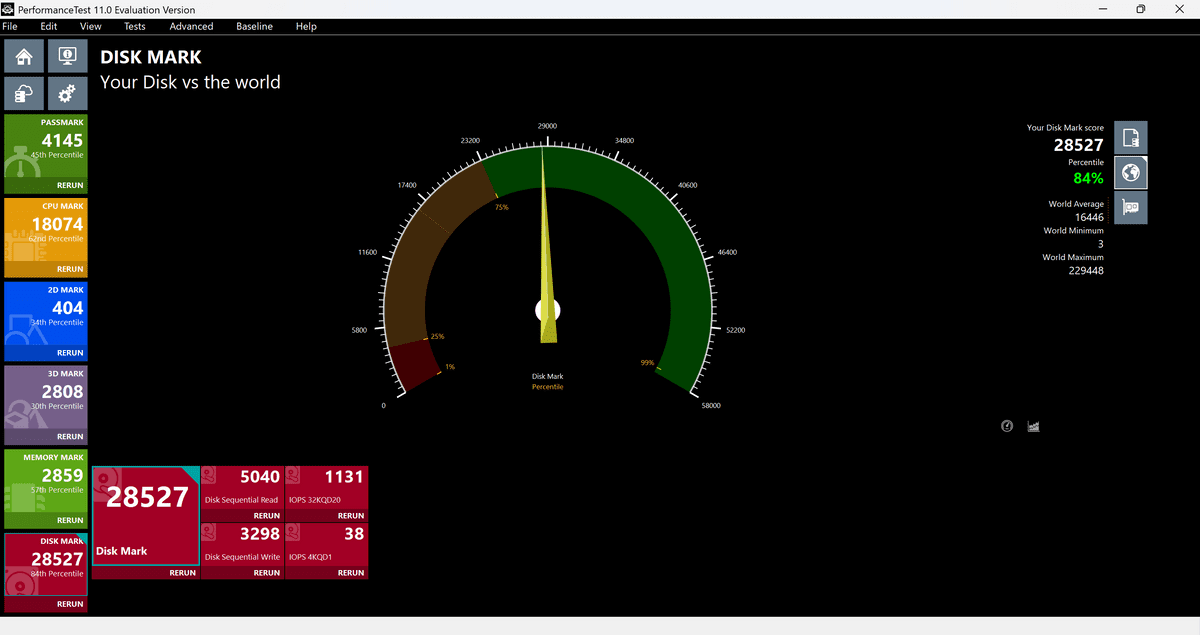
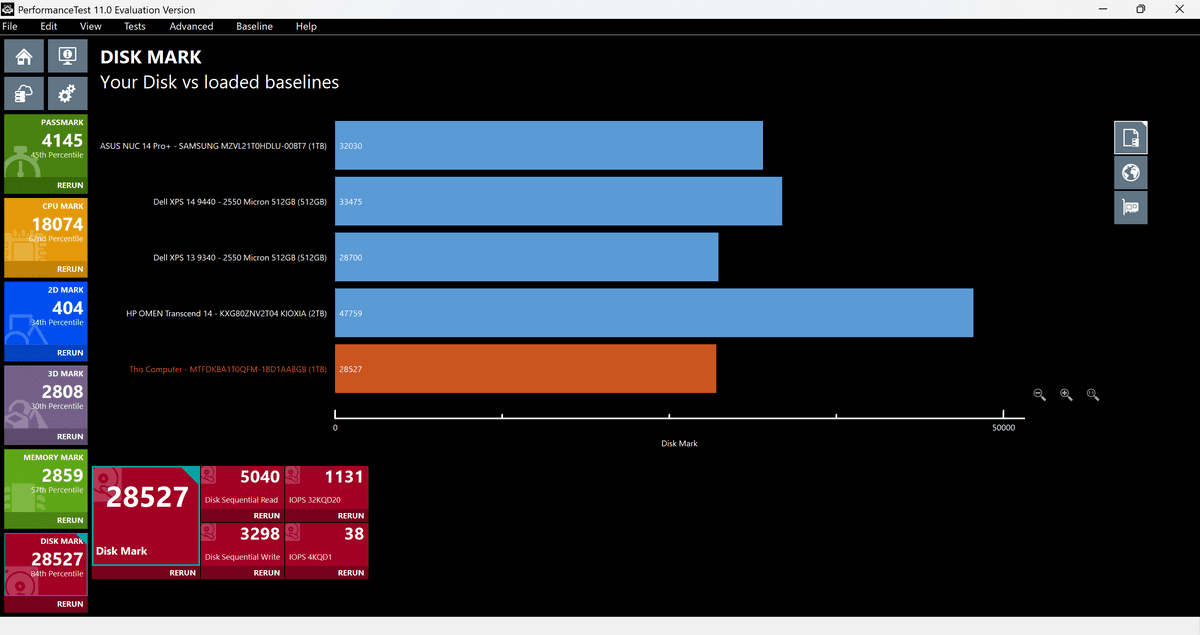
The disk score was '28527' or '84%'.
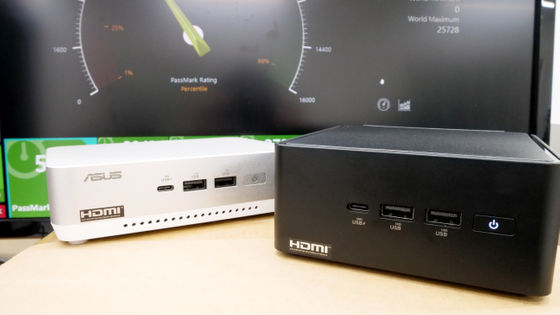
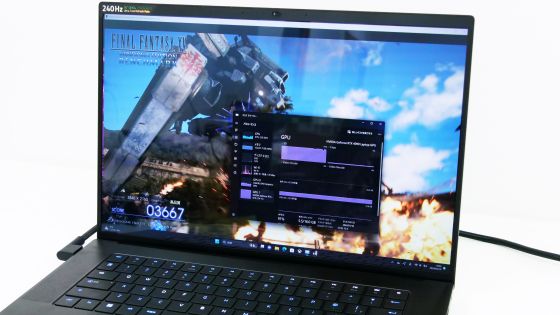
Next, we pulled out the logs of benchmark results previously run by the GIGAZINE editorial department and used them as a baseline to compare the Vivobook S 15 with the
Next, the CPU score: this time the Vivobook S 15 outperforms the XPS 13.
2D score.
3D score.
The Vivobook S 15 has the highest memory score.
Finally, the disc score.
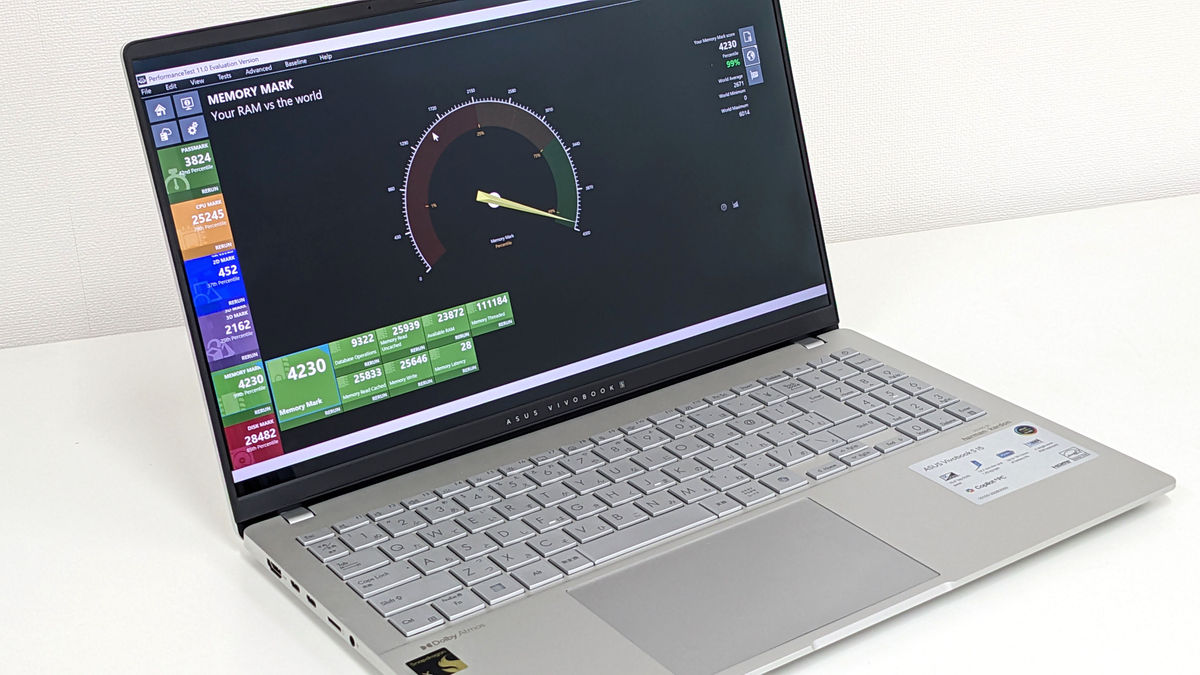
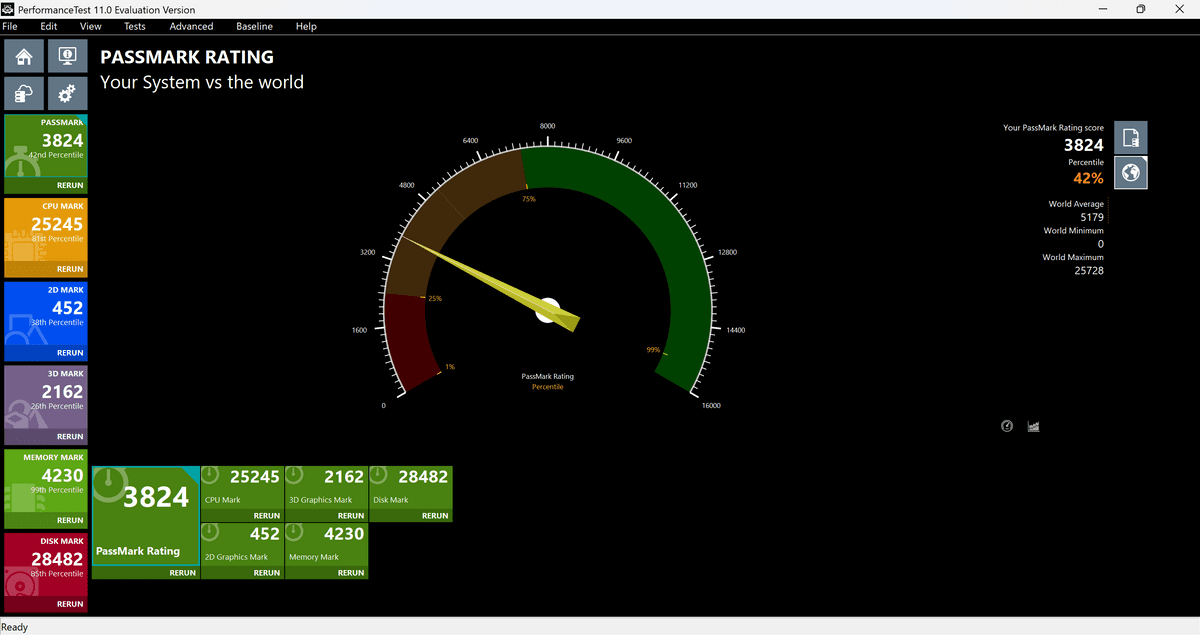
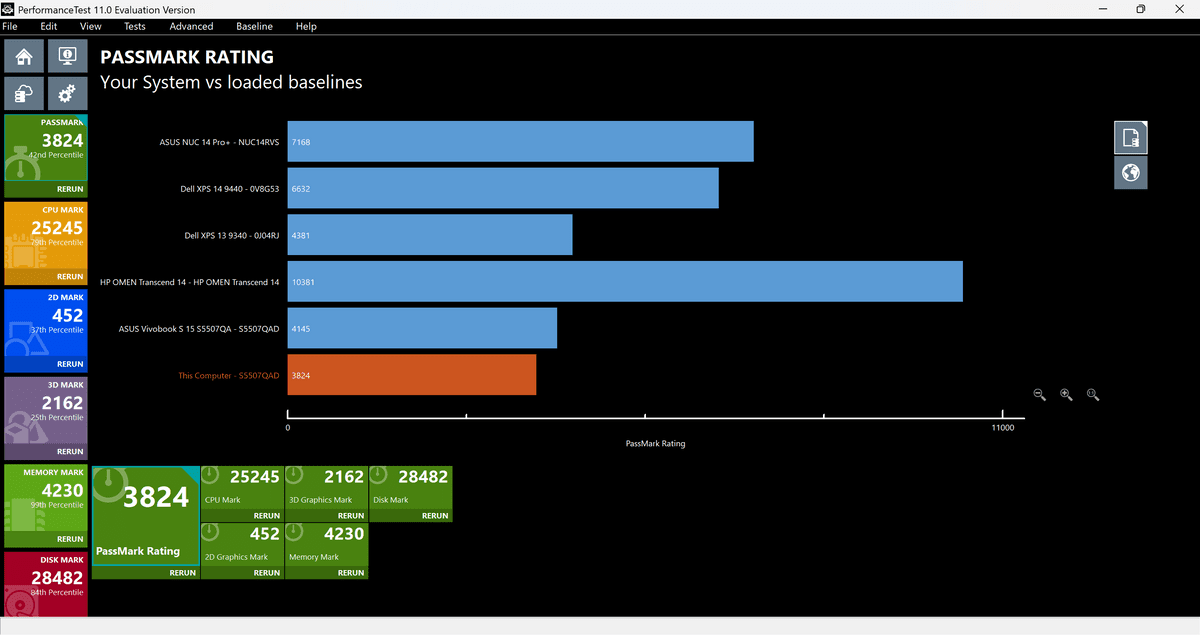
Next, we will test the ARM version. The overall score was 3824, and the percentile was 42%.
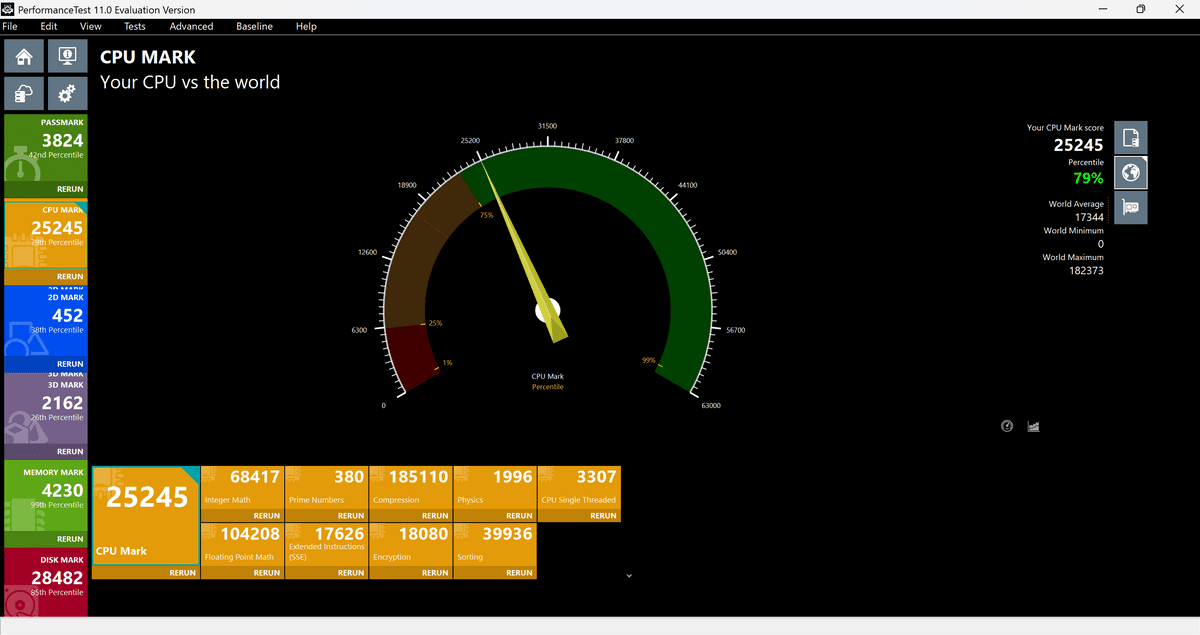
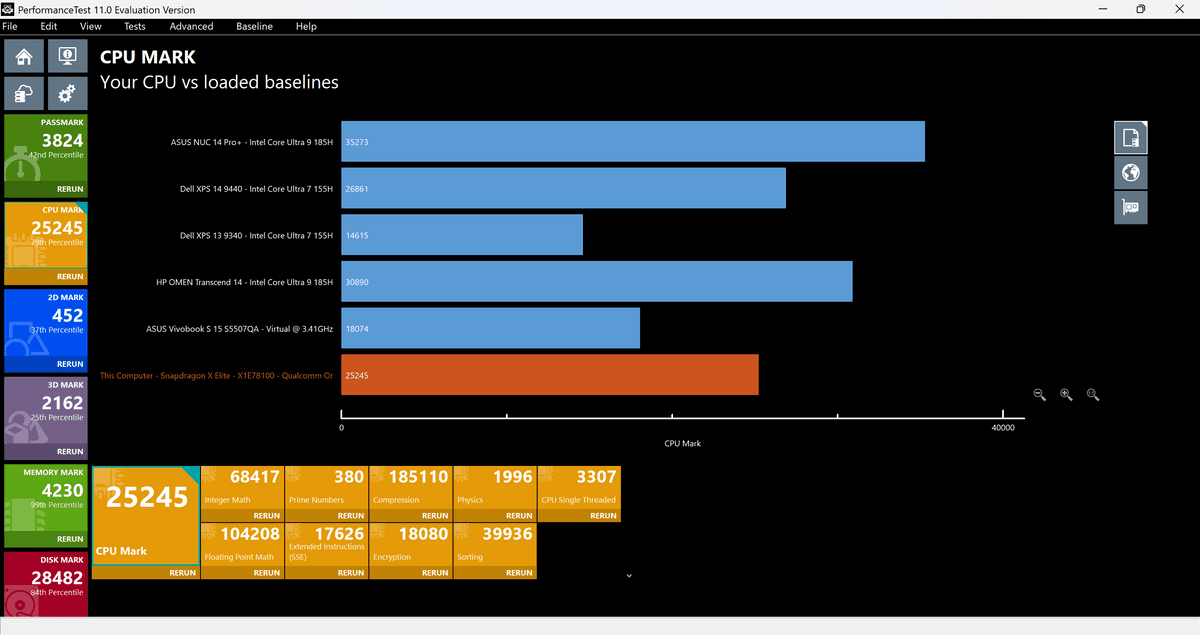
The CPU score was 25245 and the percentile was 79%. The x86 version had scores of 18074 and 62%, so these are good numbers to look forward to when using ARM software.
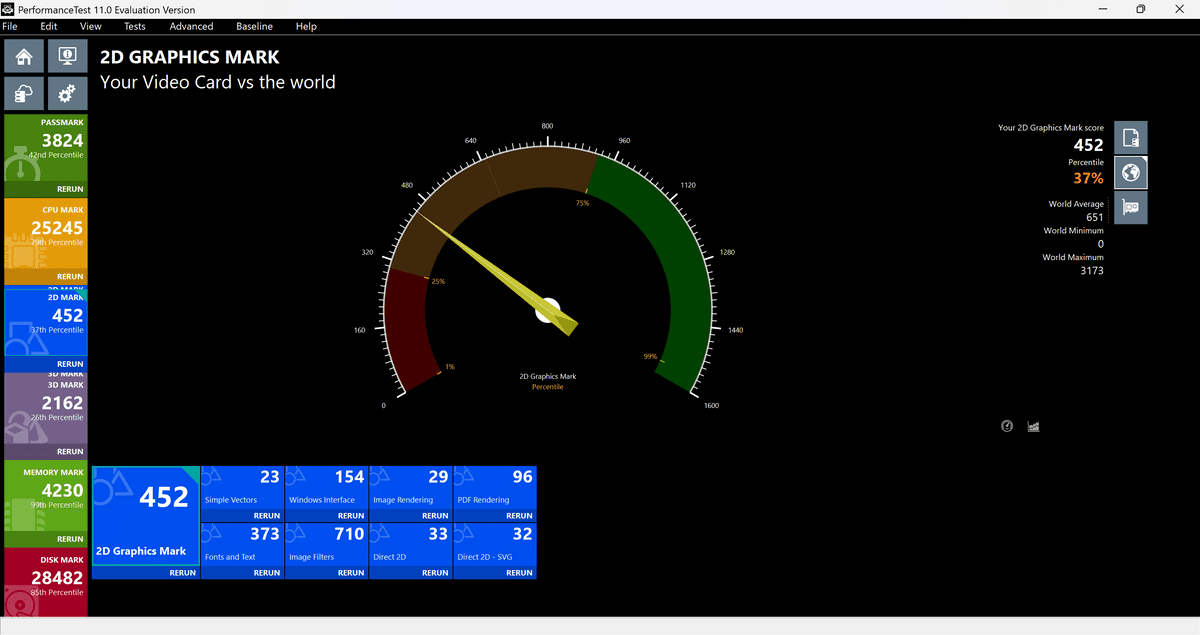
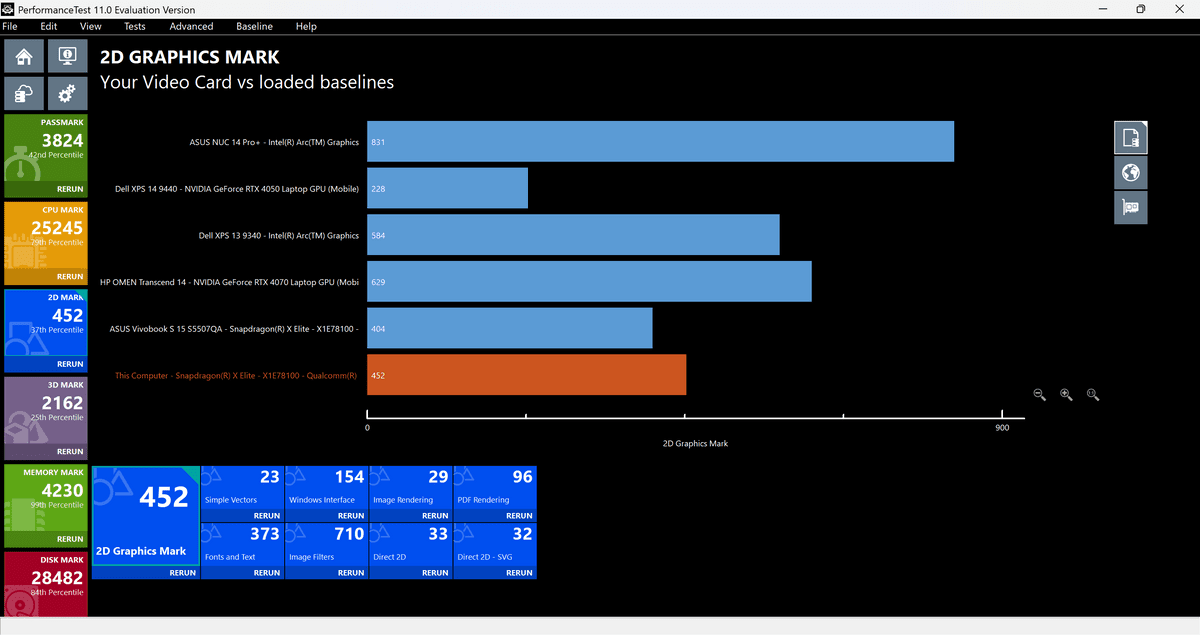
The 2D score was 452, or 37%.
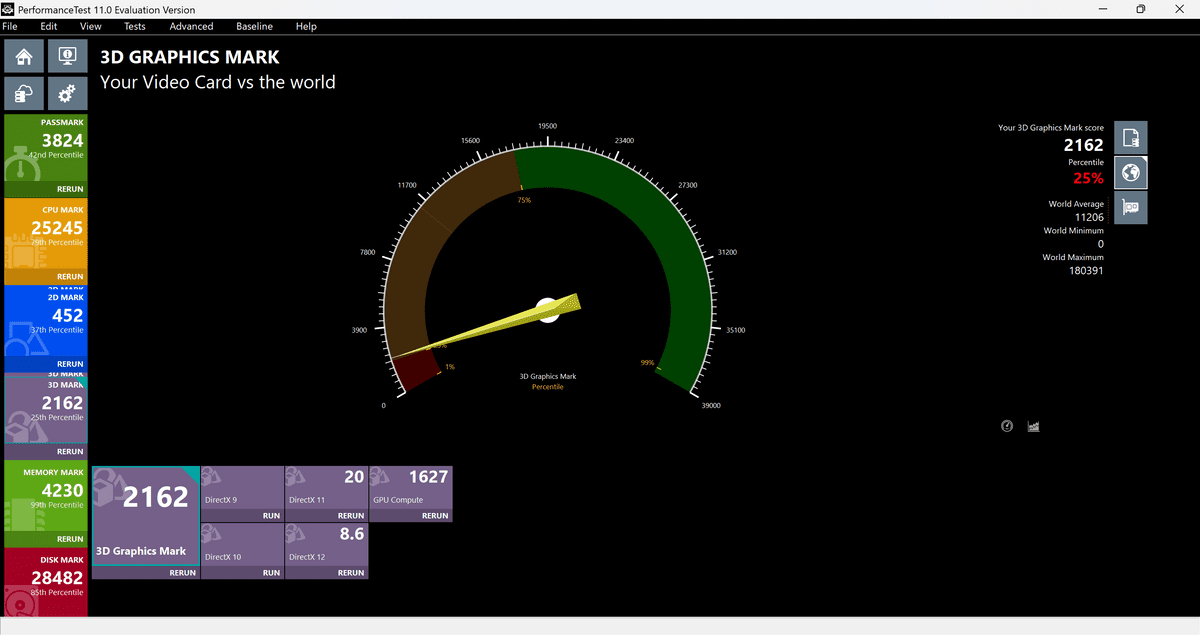
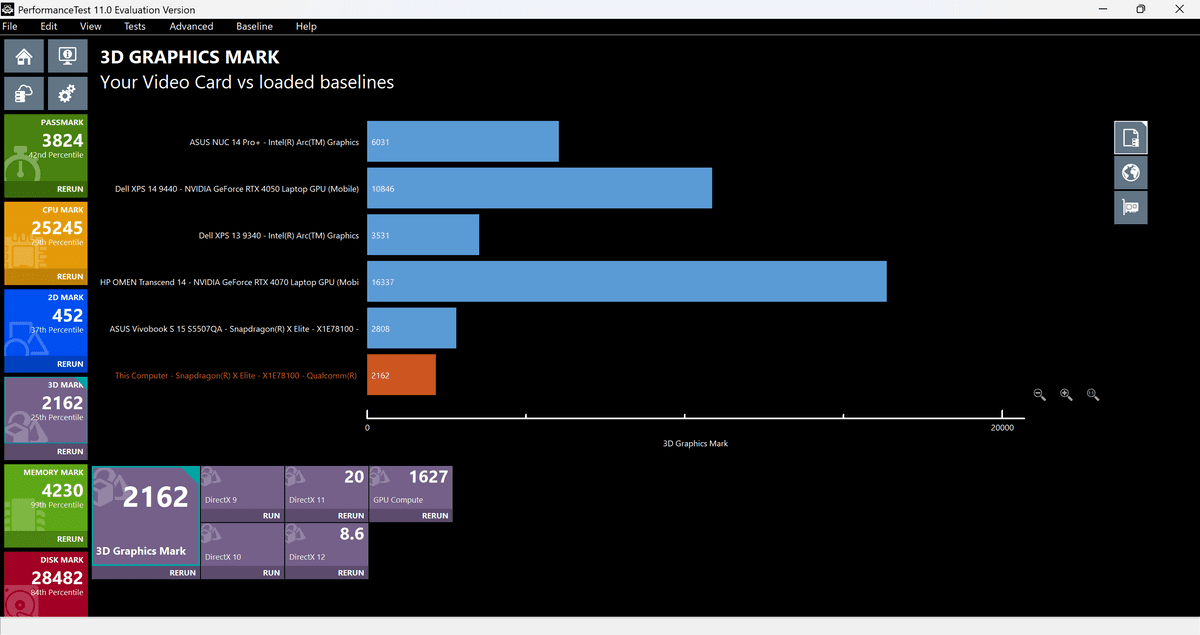
The 3D score was '2162' or '25%'.
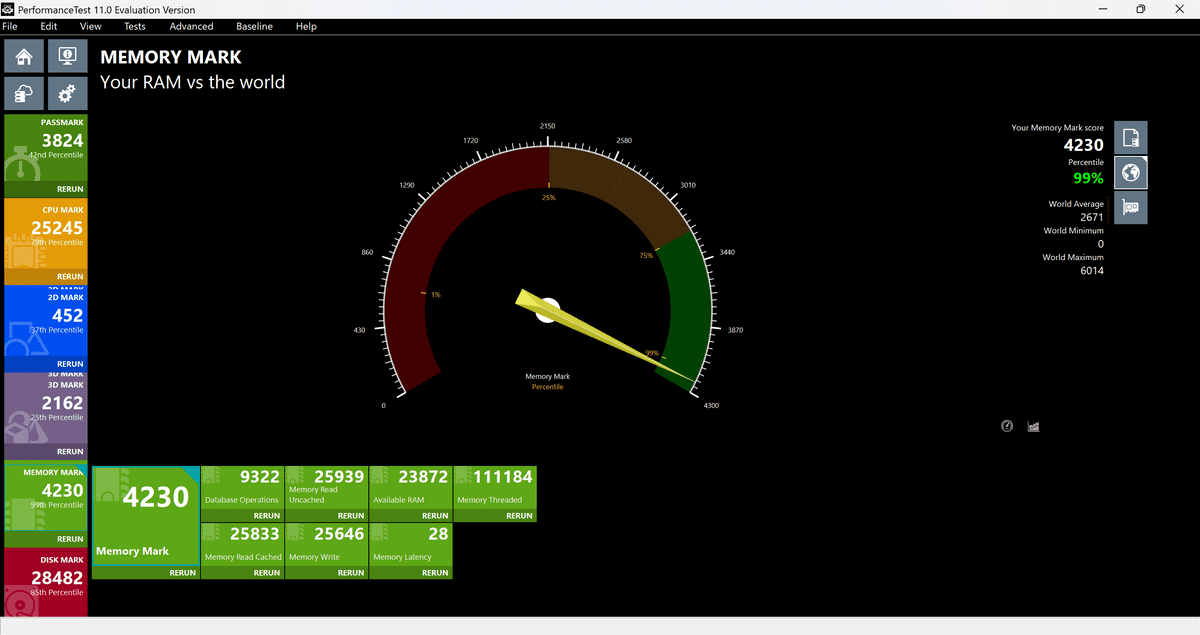
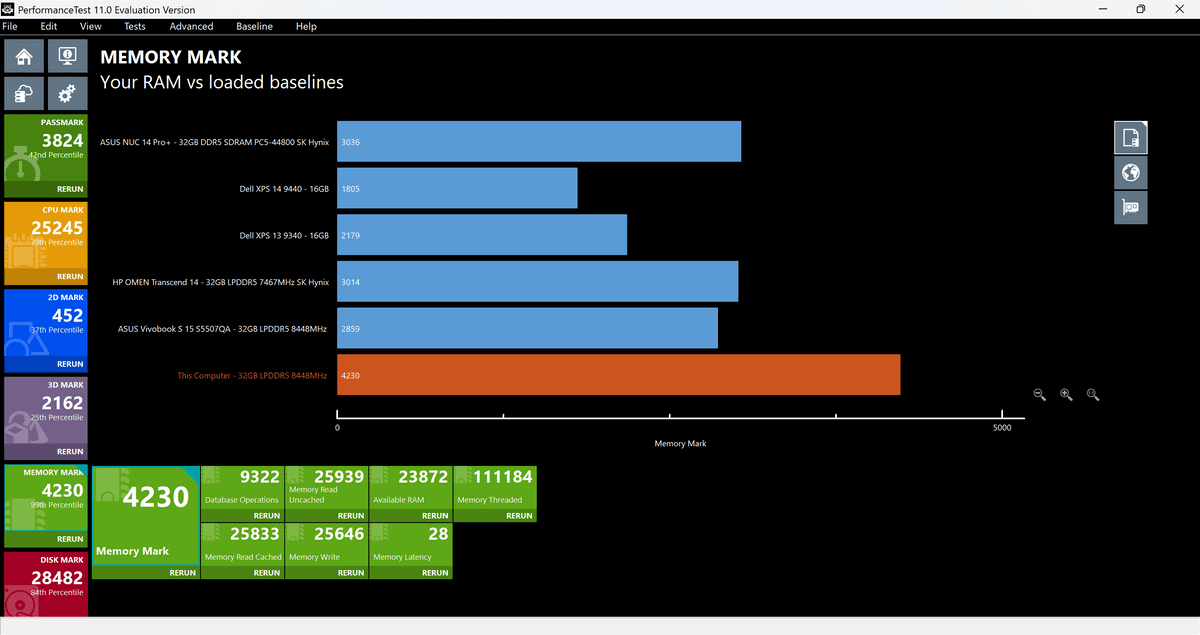
The memory score was 4230, an astonishing 99%.
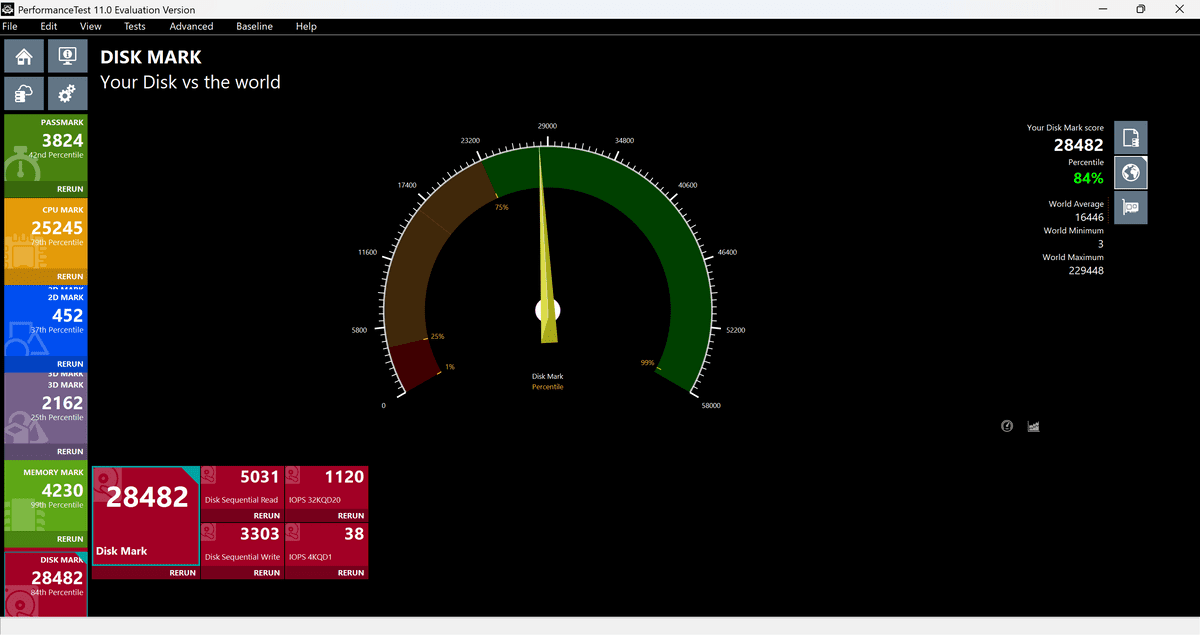
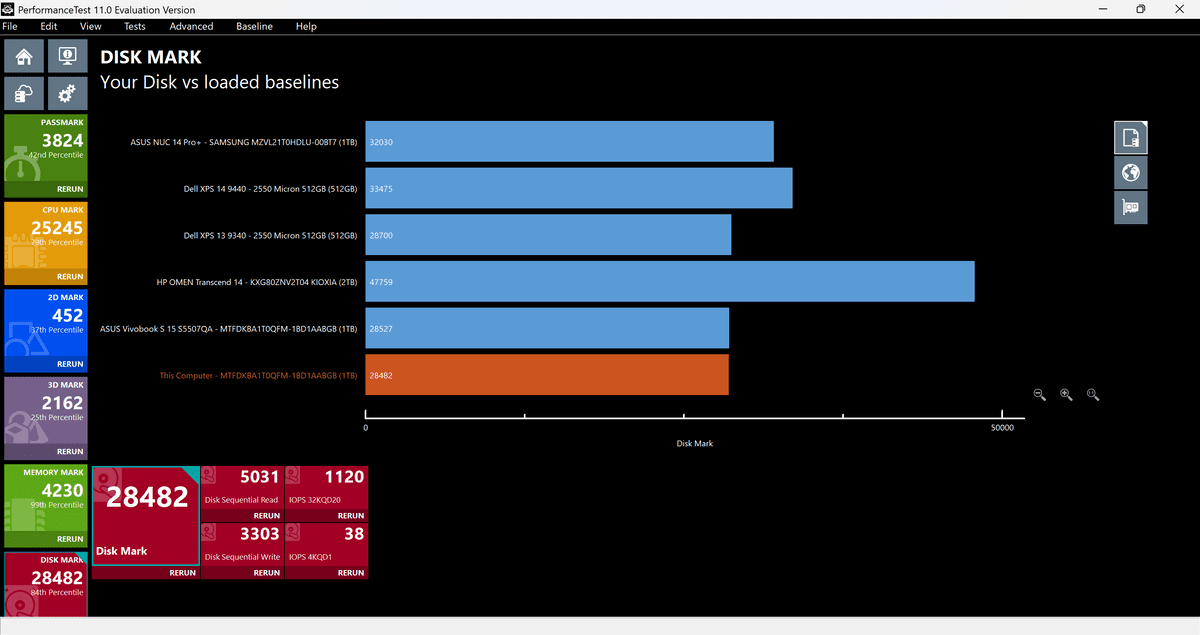
The disk score was '28482' or '84%'.
Next, we will list the results of measuring the Vivobook S 15 with the ARM version (orange) and the x86 version, as well as the results of measuring other PCs with the x86 version. First, the overall score.
CPU score.
2D score.
3D score.
Memory score.
Disk score.
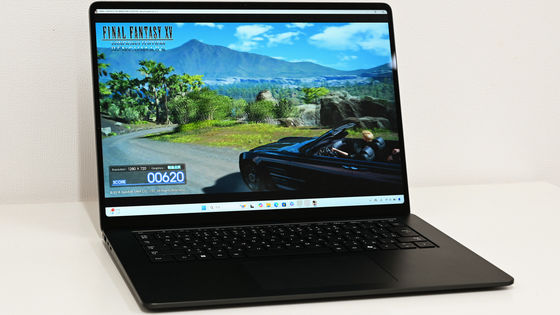
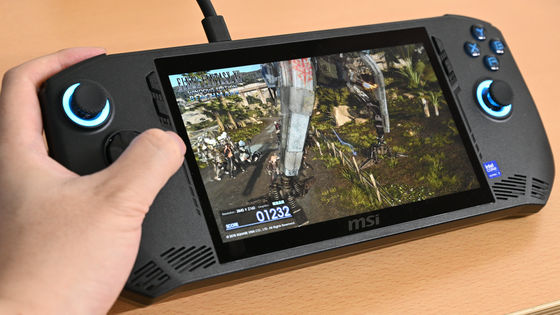
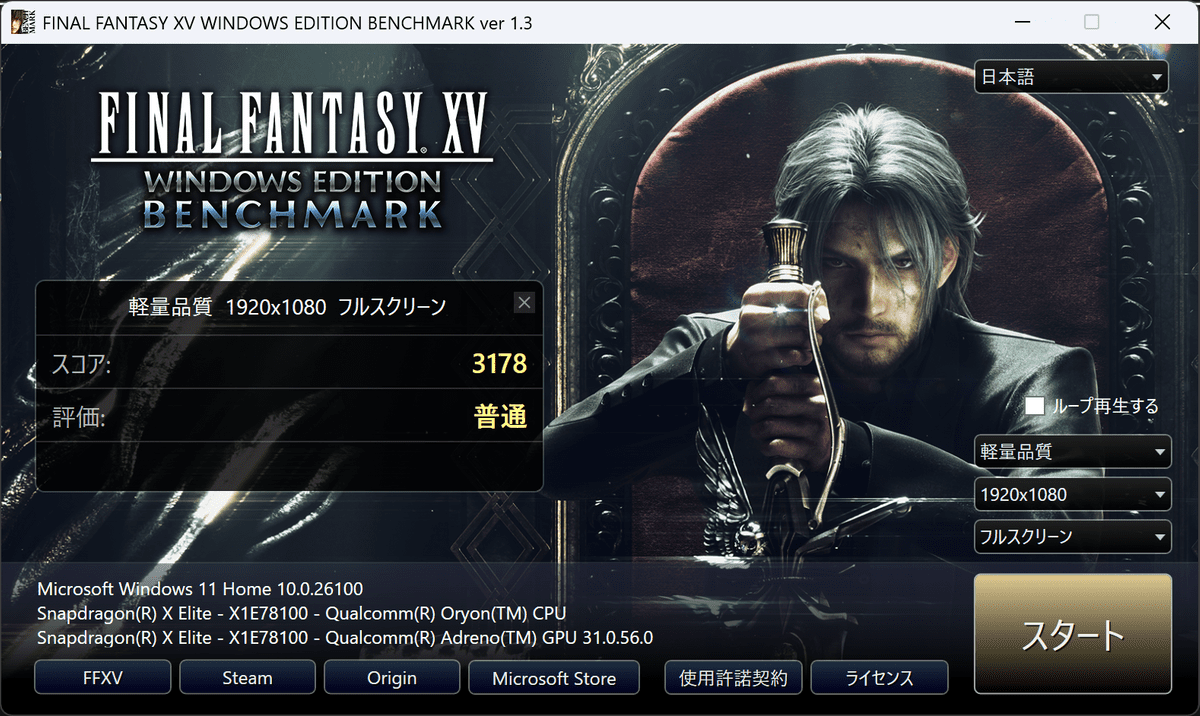
Next, we ran the '

When measured at 'light quality', '1920 x 1080', and 'full screen', the result is '3178', 'normal'.
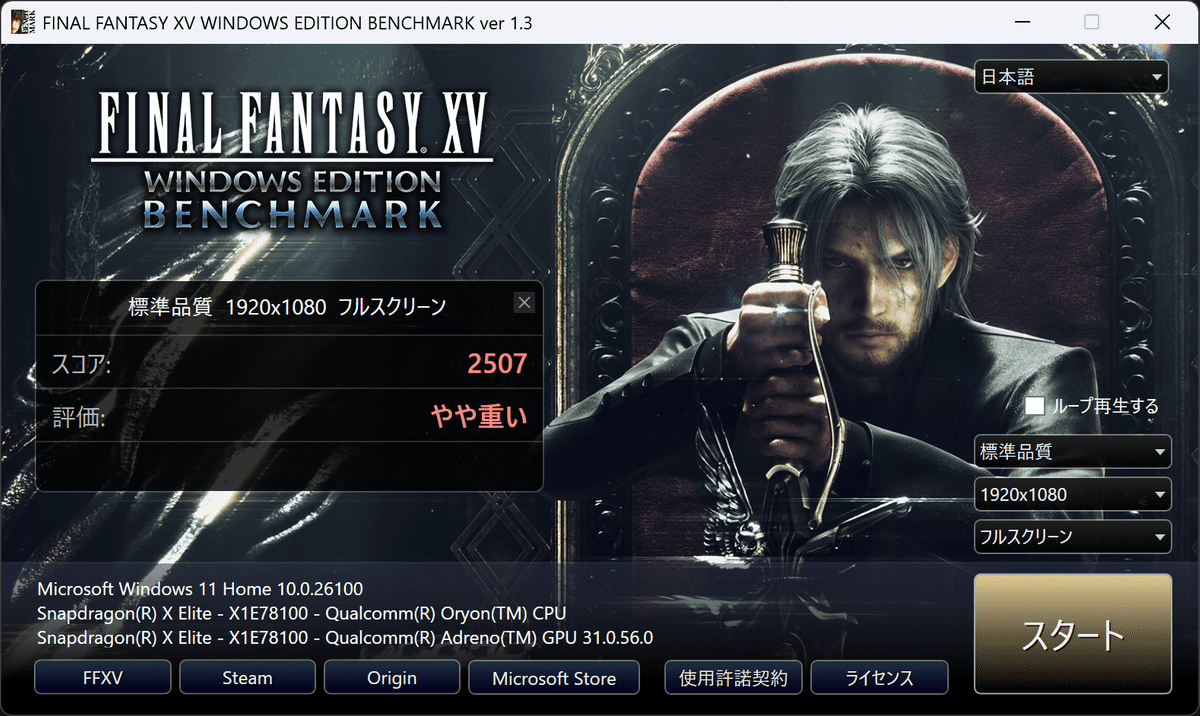
When measured at 'standard quality,' '1920 x 1080,' and 'full screen,' the result was '2507,' which is 'slightly heavy.'
Measured using the '

If you change the settings to 'Standard Quality', it becomes 'somewhat comfortable' at '6701'. When actually playing games at full HD, it seems better to set it to 'Standard to Light Quality'.

We plan to review the 'Recall' feature as soon as it is released by Microsoft.
Related Posts: