I ran various benchmarks on Microsoft's 7th generation Surface Laptop
We ran various benchmarks to see what kind of performance the 7th generation Surface Laptop equipped with Qualcomm's Snapdragon X Elite has.
Introducing the new Copilot+ PC, Surface Laptop (7th Generation) | Microsoft Surface
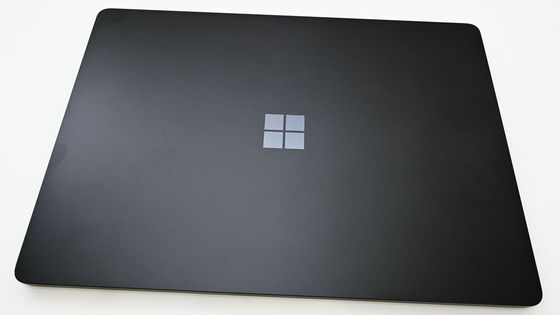
The appearance information of the 7th generation Surface Laptop is published in the following article. The same model is used for benchmarking, with a screen size of 15 inches.
Photo review of Microsoft's 7th generation Surface Laptop with AI processing-specialized NPU and Snapdragon X Elite - GIGAZINE
◆Specifications
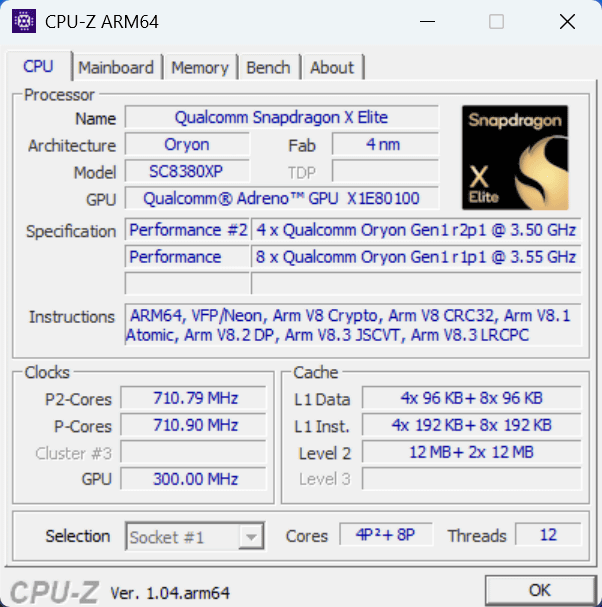
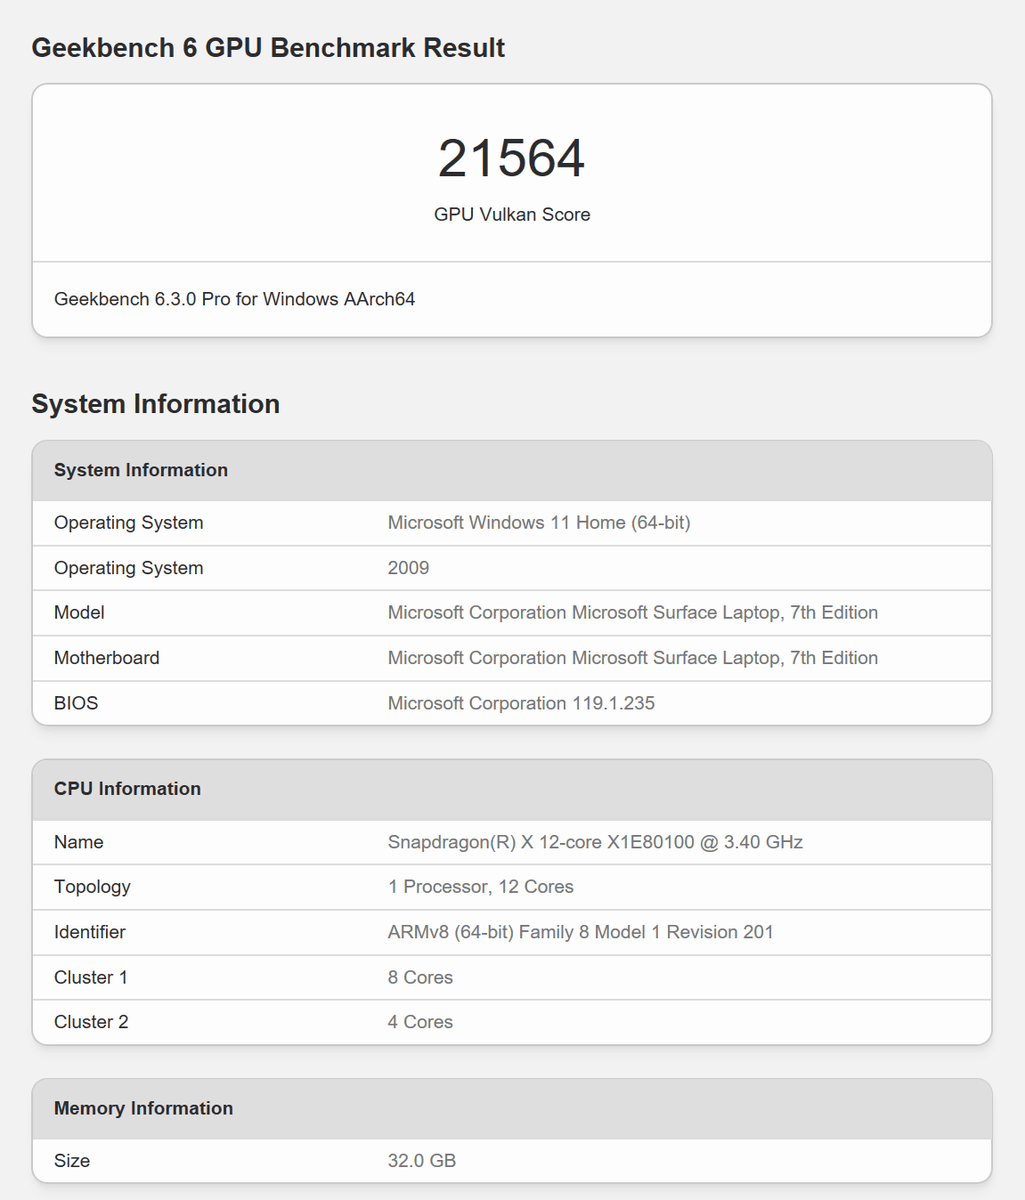
First, I checked the CPU information with
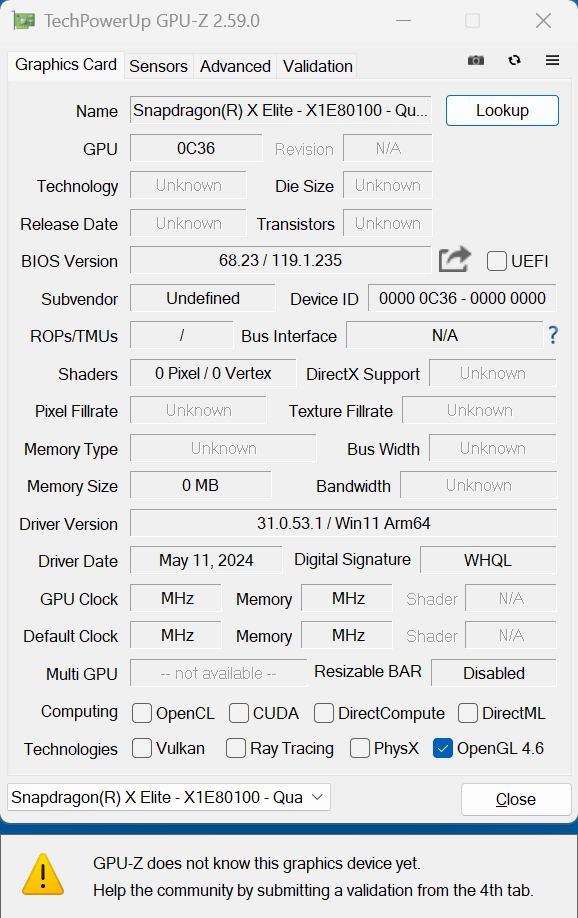
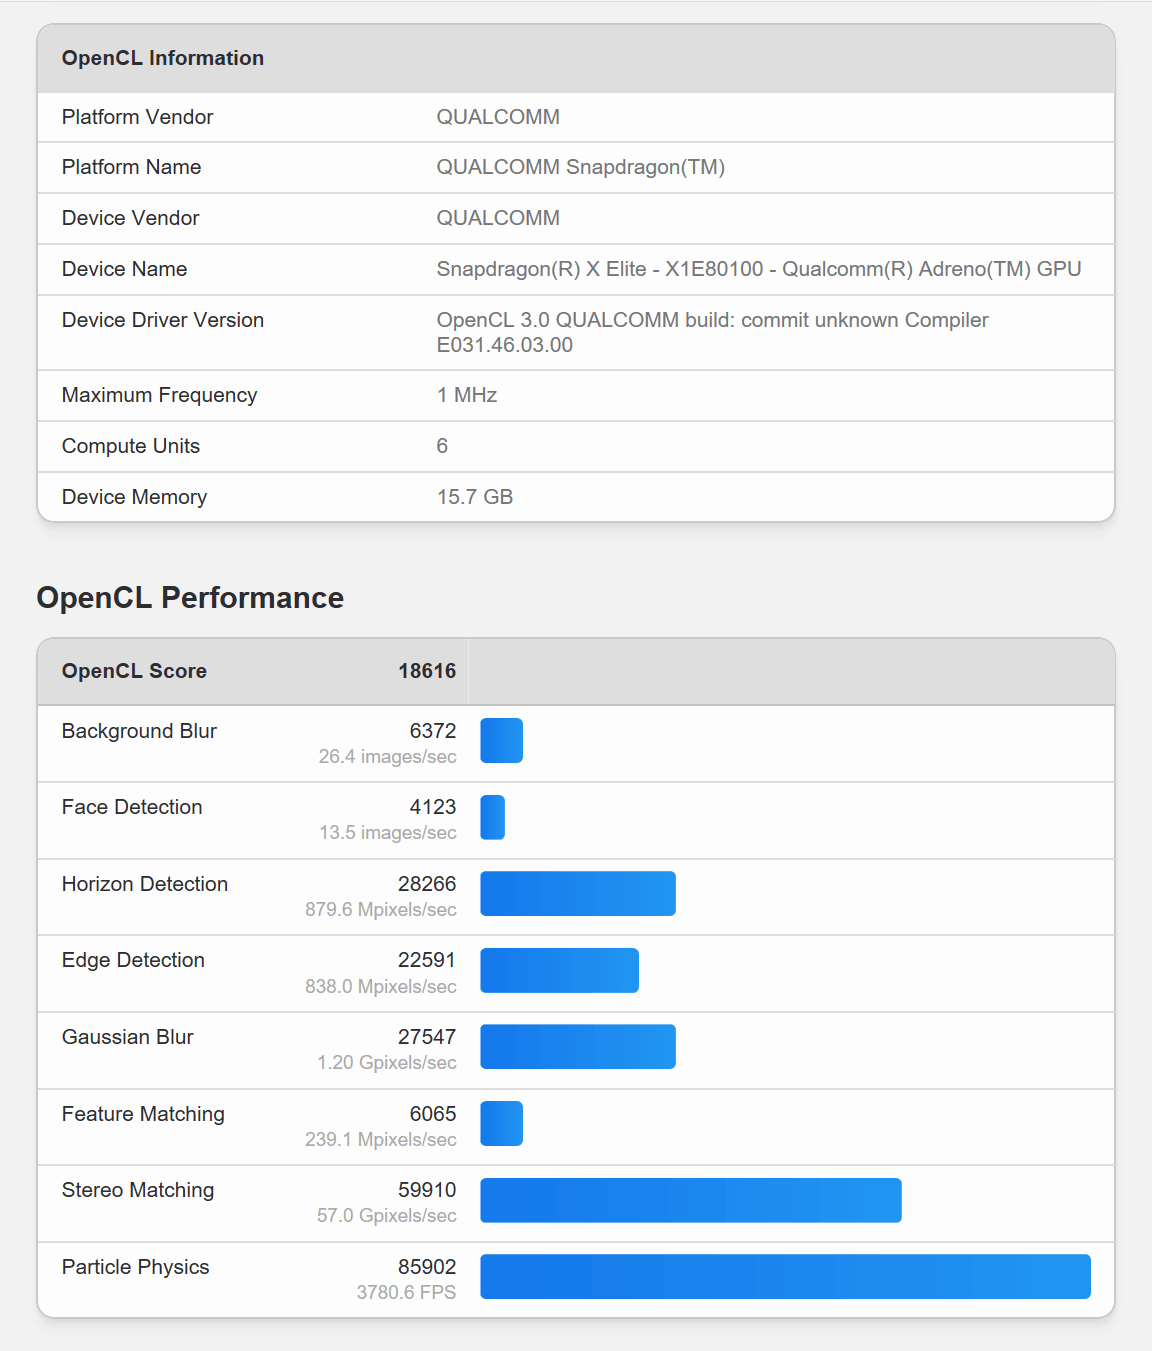
I wanted to check the GPU information in detail using '
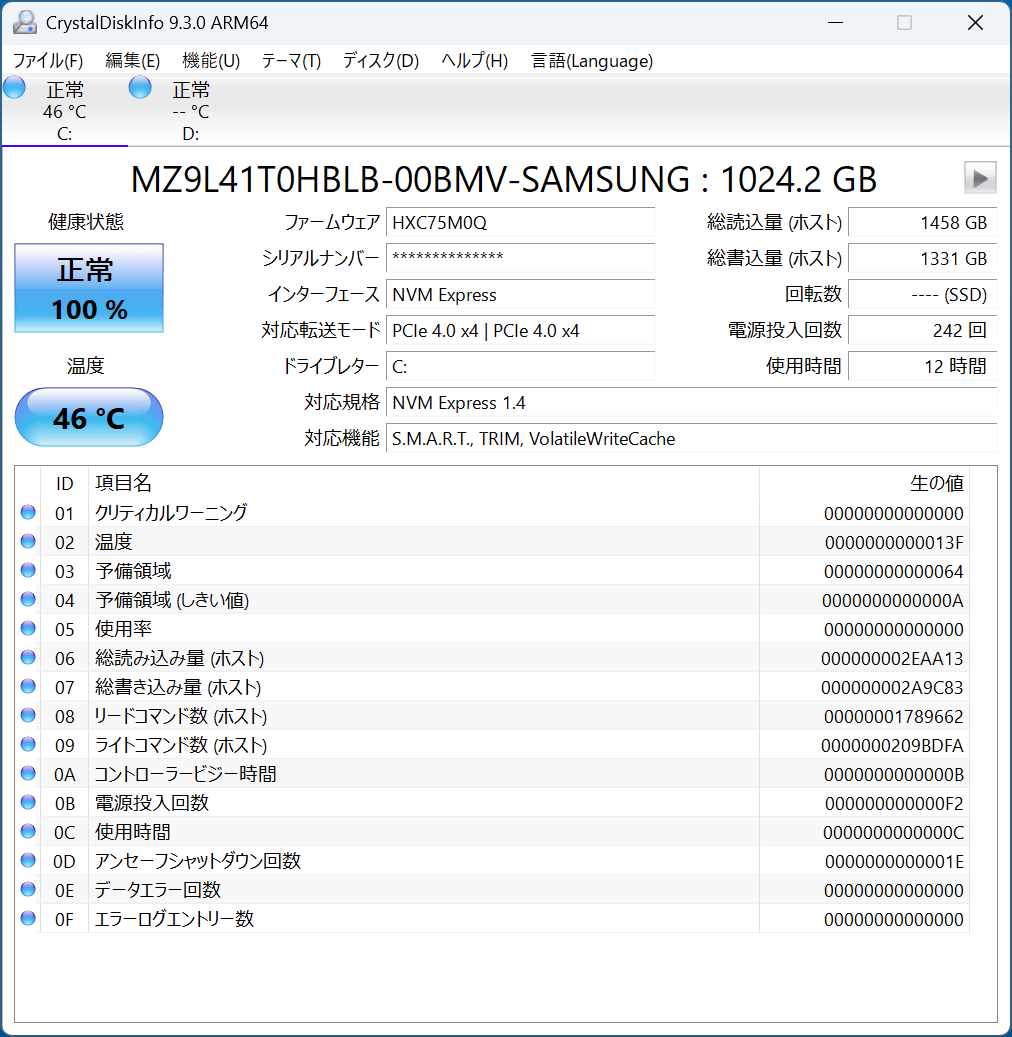
When I checked the storage information on '
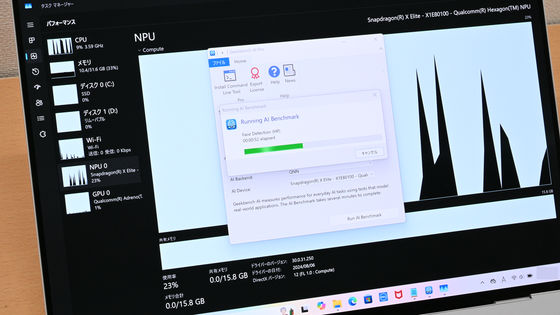
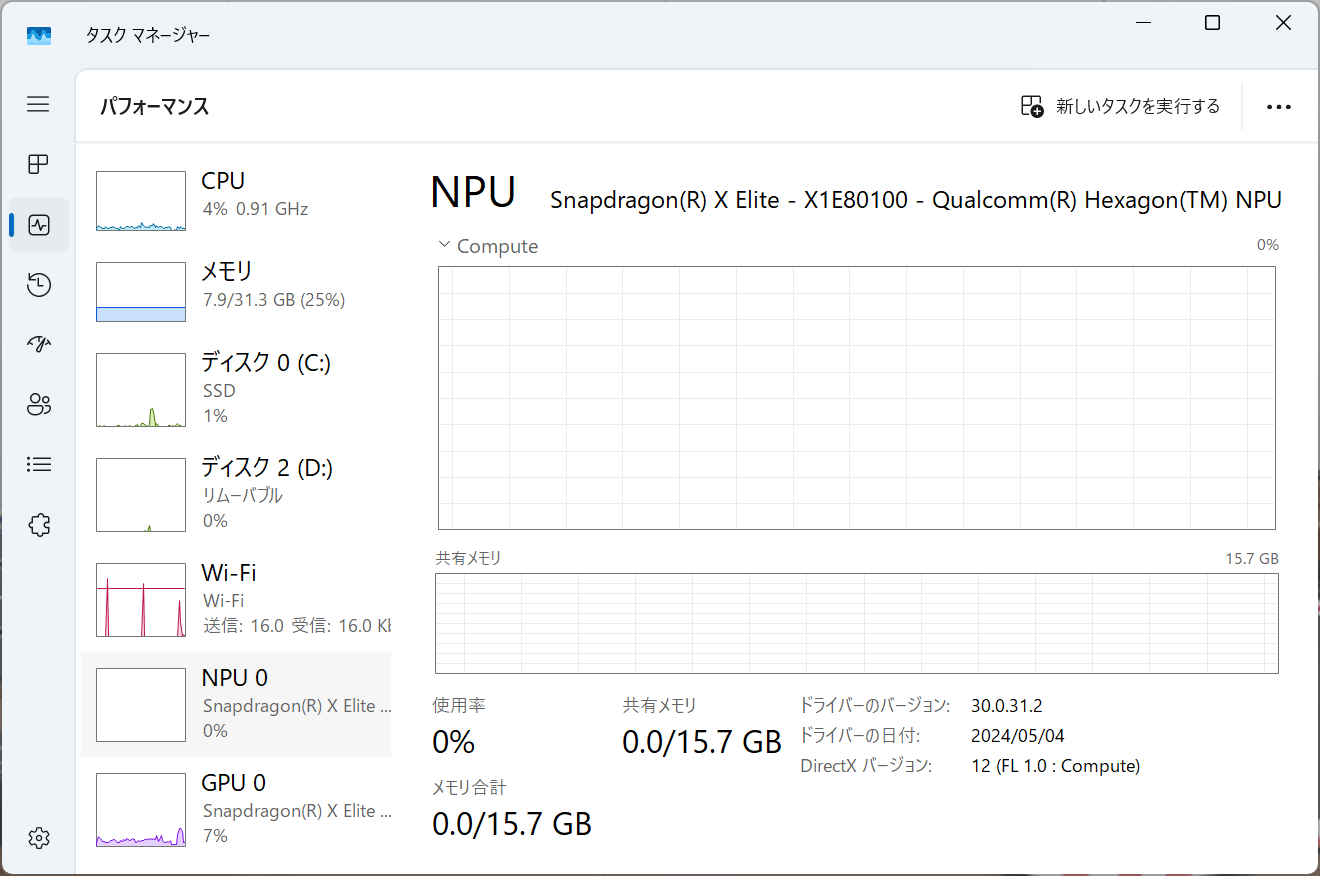
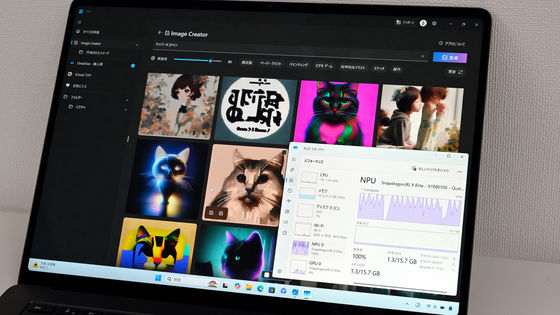
When I checked the NPU information in the task manager, it said 'Qualcomm Hexagon NPU'.
◆Benchmark
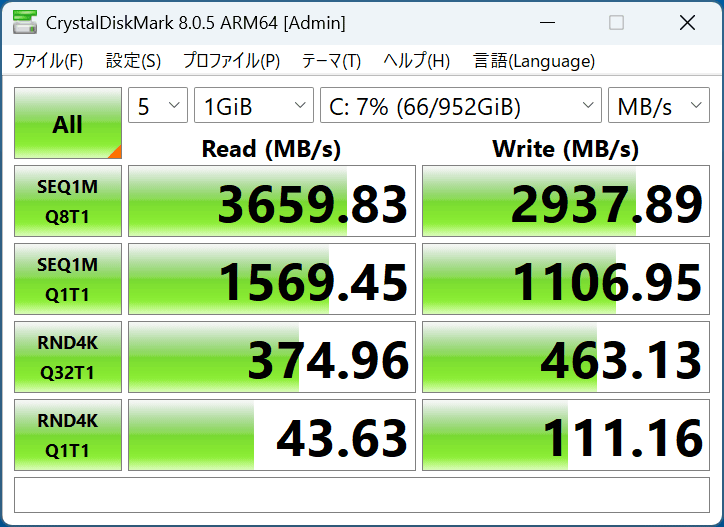
Next, we performed benchmark tests. First, we measured the storage transfer speed with '
When we ran '
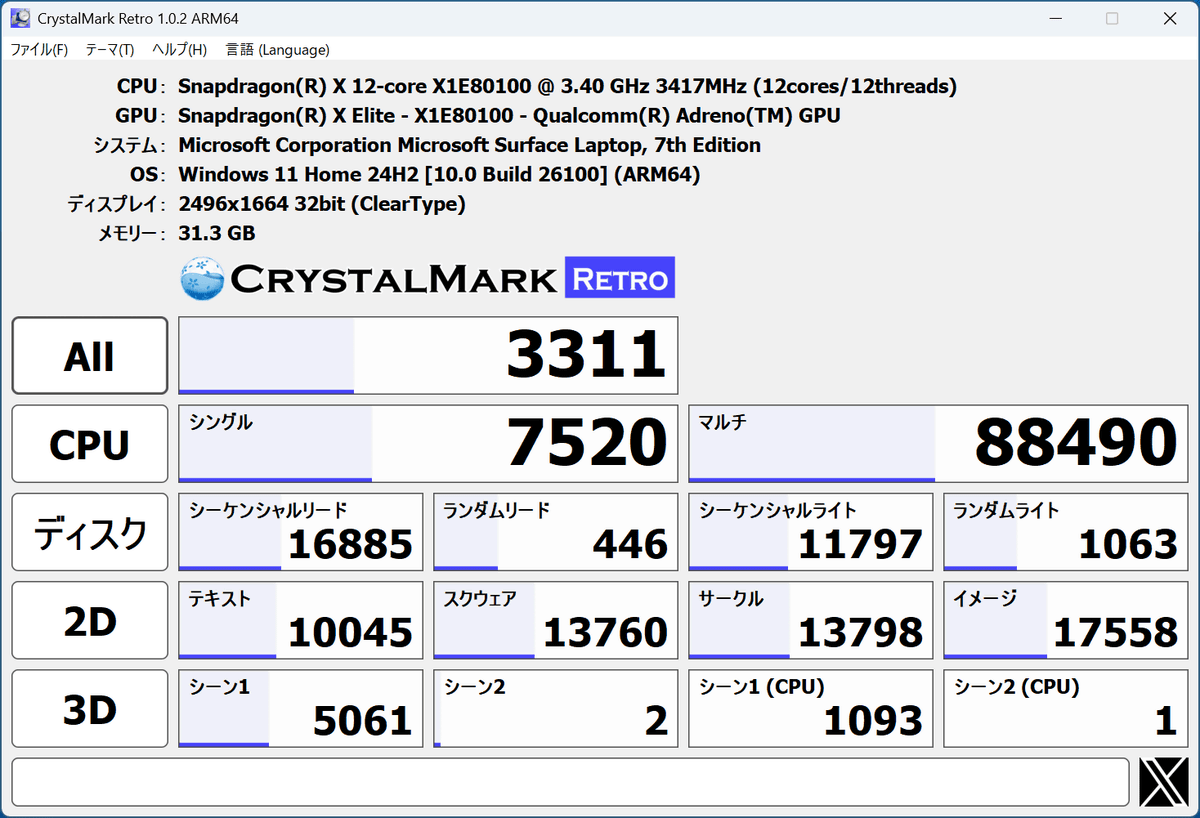
We used
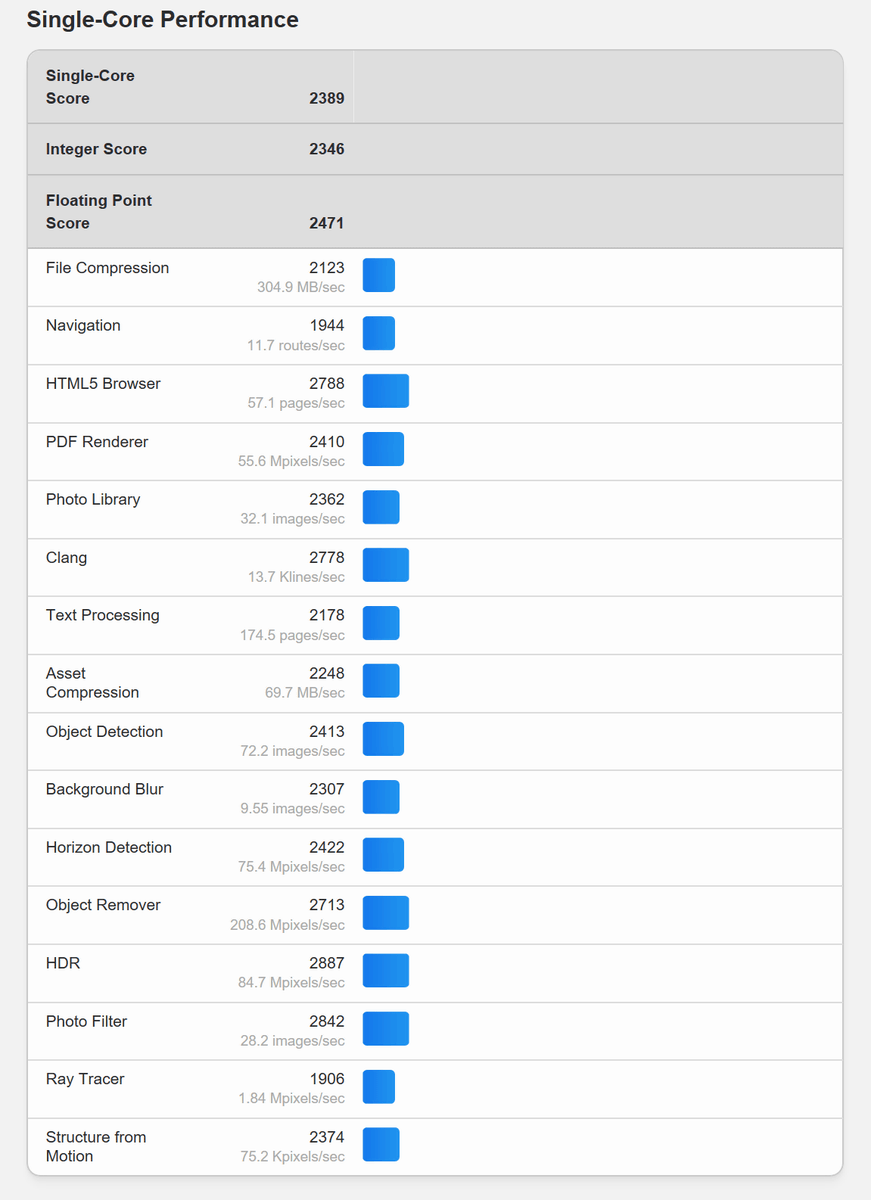
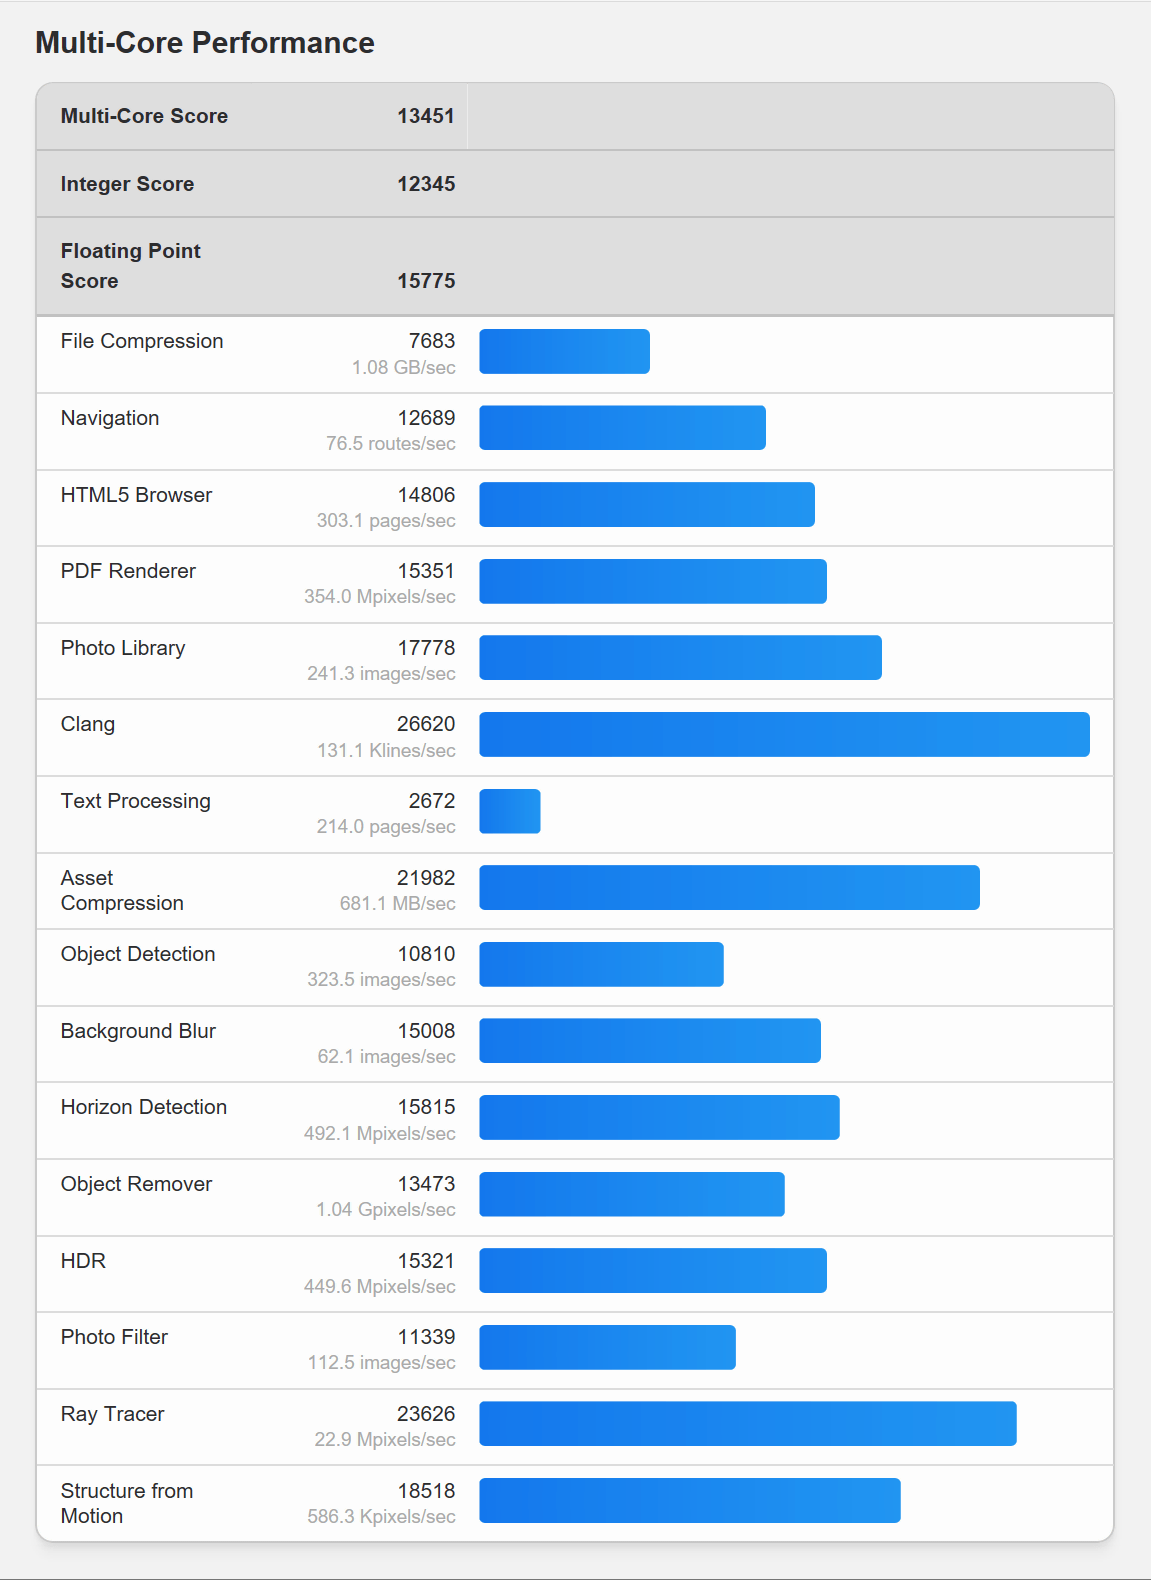
First, the CPU benchmark results were a single-core score of 2389 and a multi-core score of 13451.
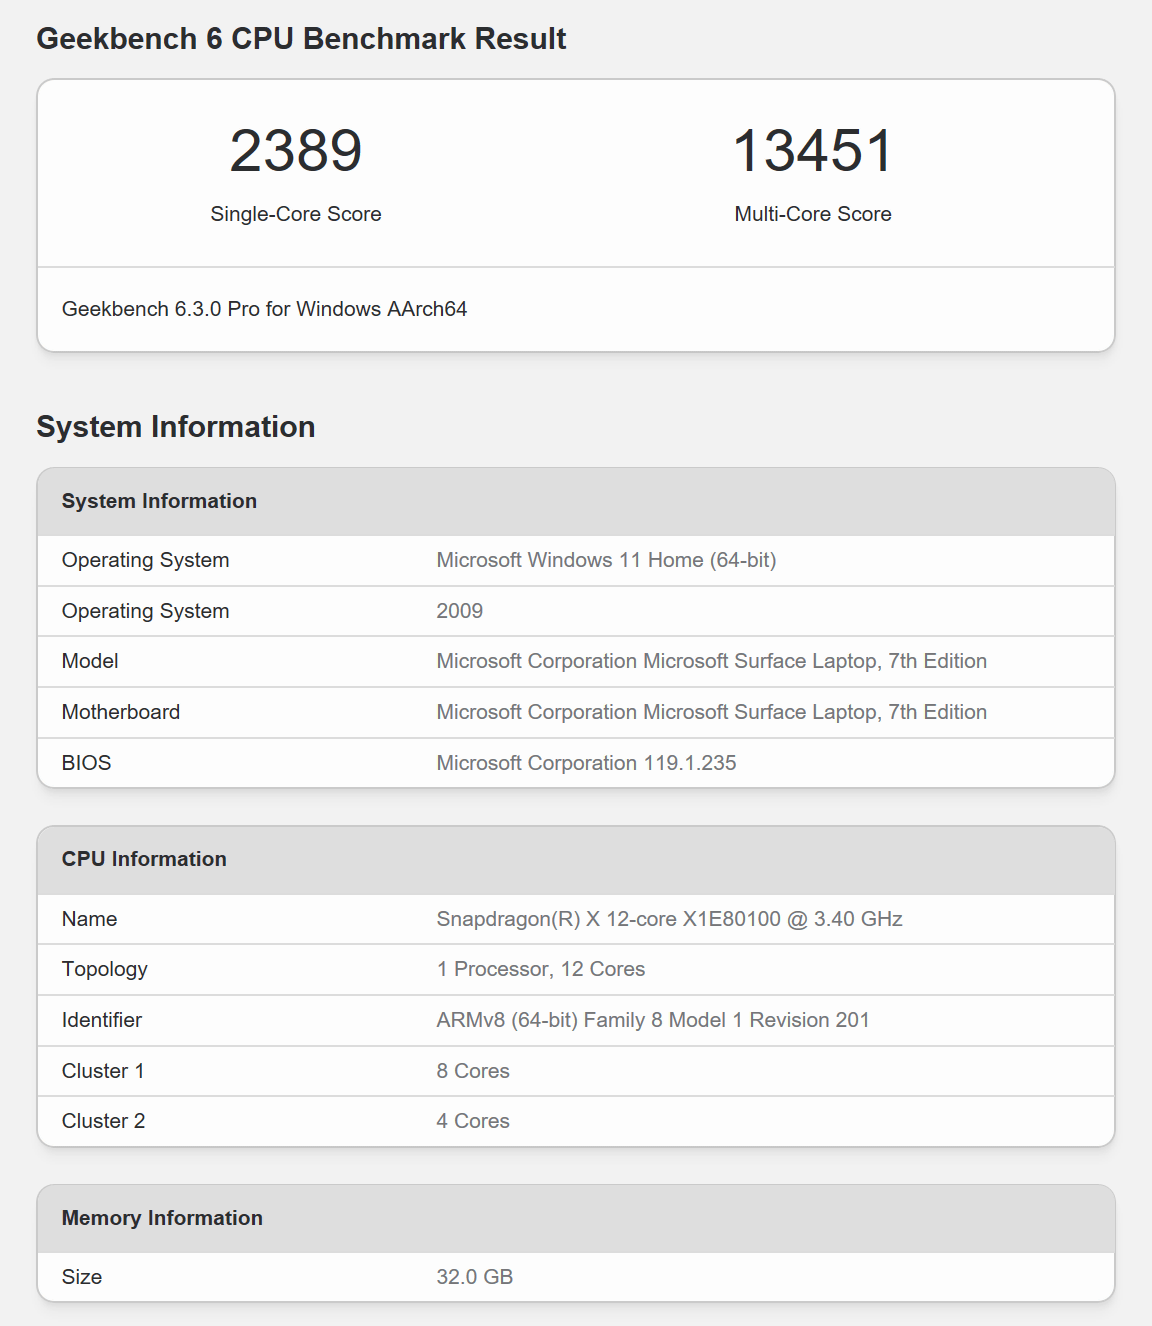
The detailed score for the SingScore was 2346 for integer operations and 2471 for floating point operations.
Similarly, the multi-core score details were 12345 for integer operations and 15775 for floating point operations.
Next, the GPU benchmark results. The OpenCL score was 18616.
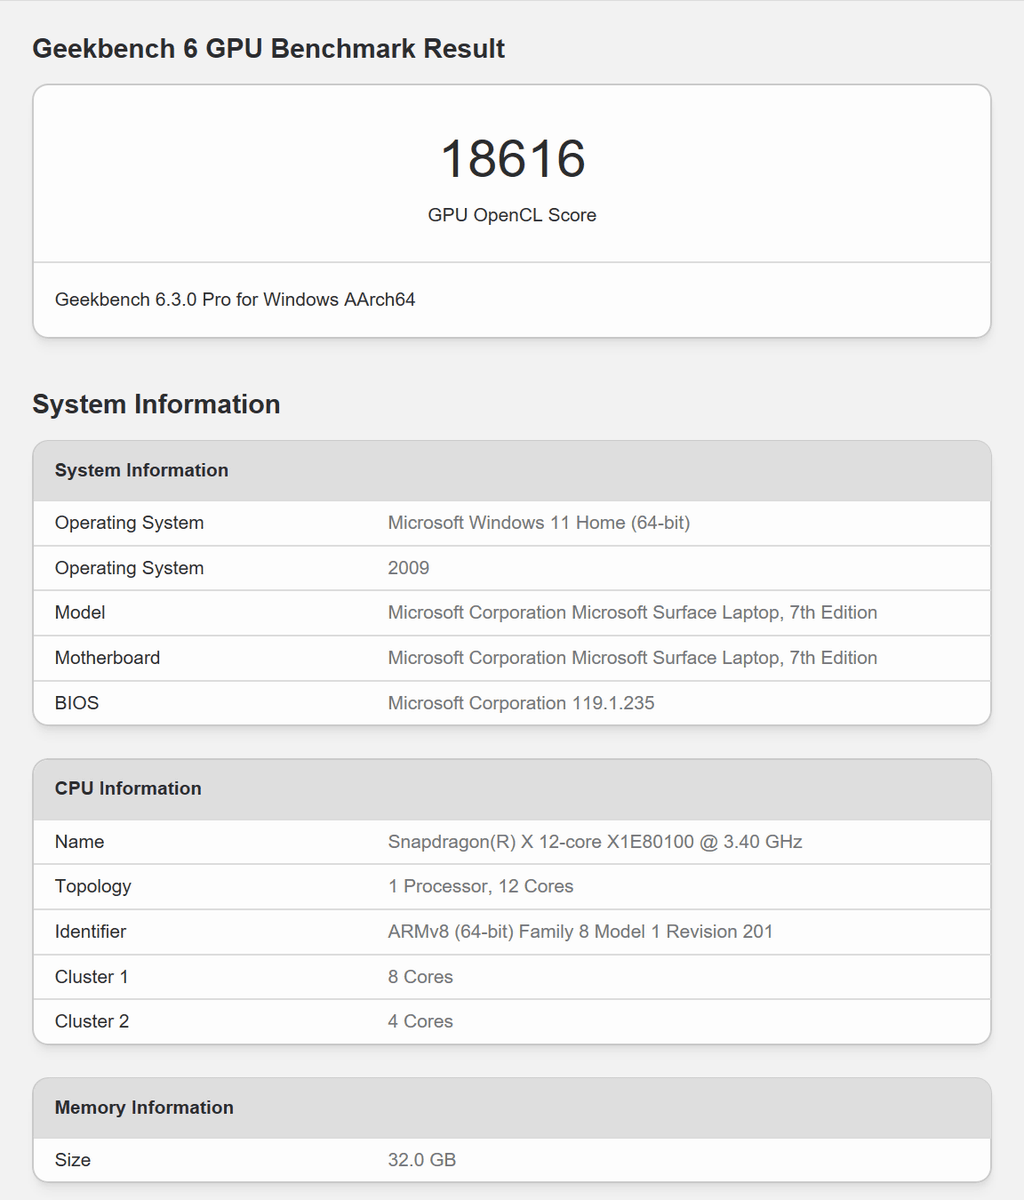
The OpenCL score breakdown looks like this:
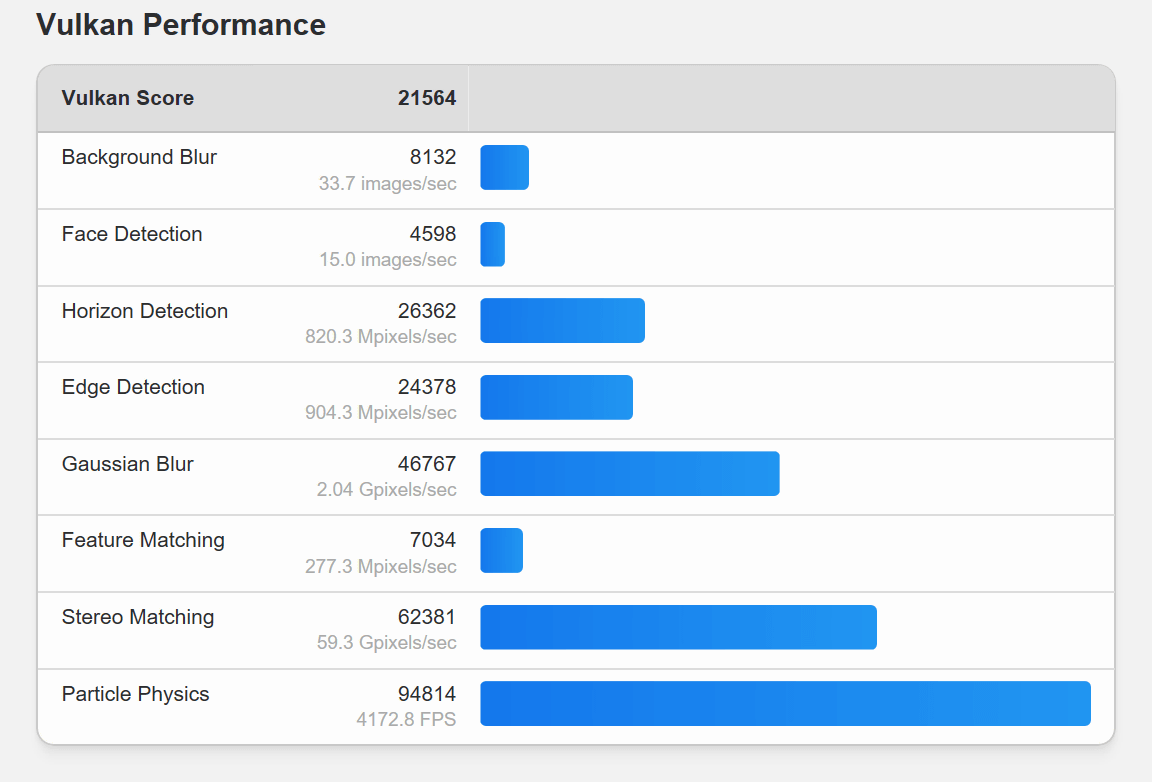
Vulkan's score was '21564'.
The Vulkan score breakdown looks like this:
'
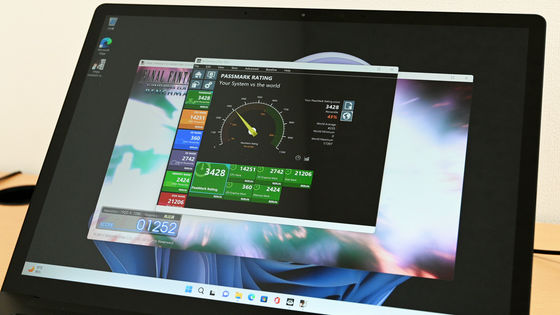
First, the x86 version. The overall score was 3694, which puts it in the 42% percentile of the overall benchmark results using this software. It's almost in the middle.

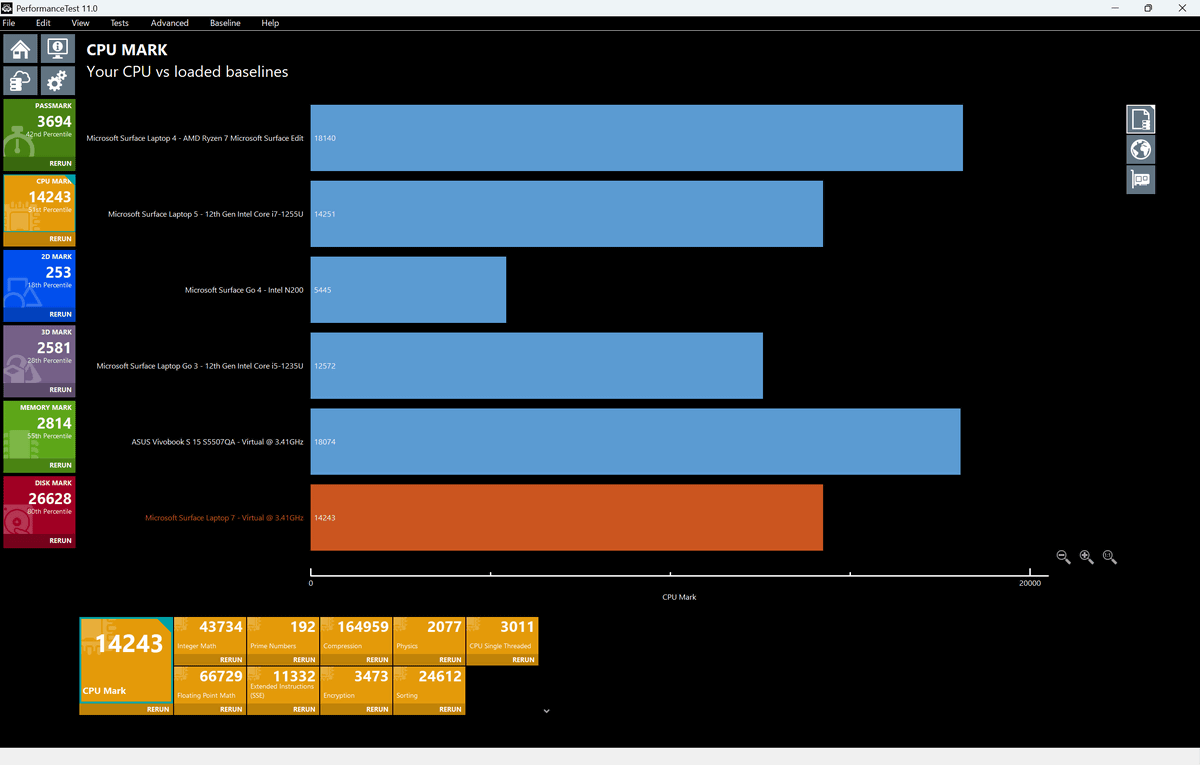
Here are the results compared with the past Surface series, Surface Laptop 4, Surface Laptop 5, Surface Go 4, Surface Laptop Go 3, and the ASUS Vivobook S 15, which is the same Copilot+ PC as this machine. Despite being an emulation, it has the same scores as the Laptop 4 and Laptop 5.
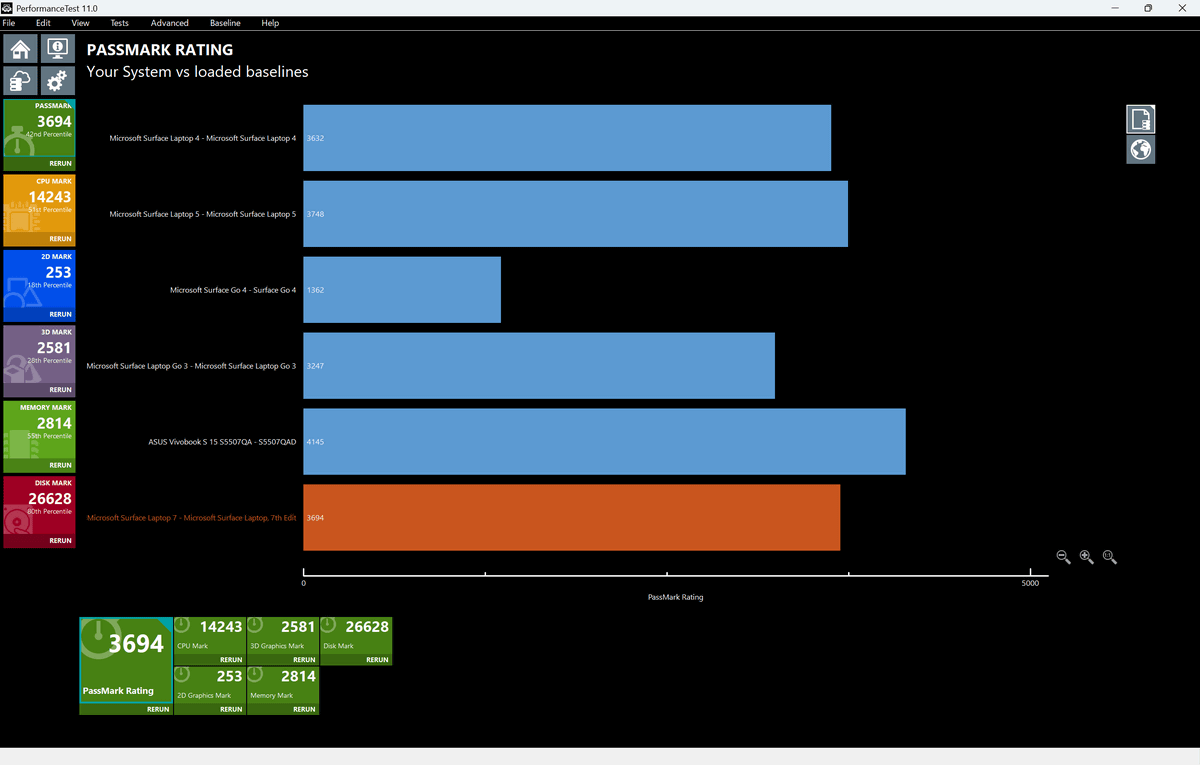
The CPU score was '14243', with a percentile of 51%.
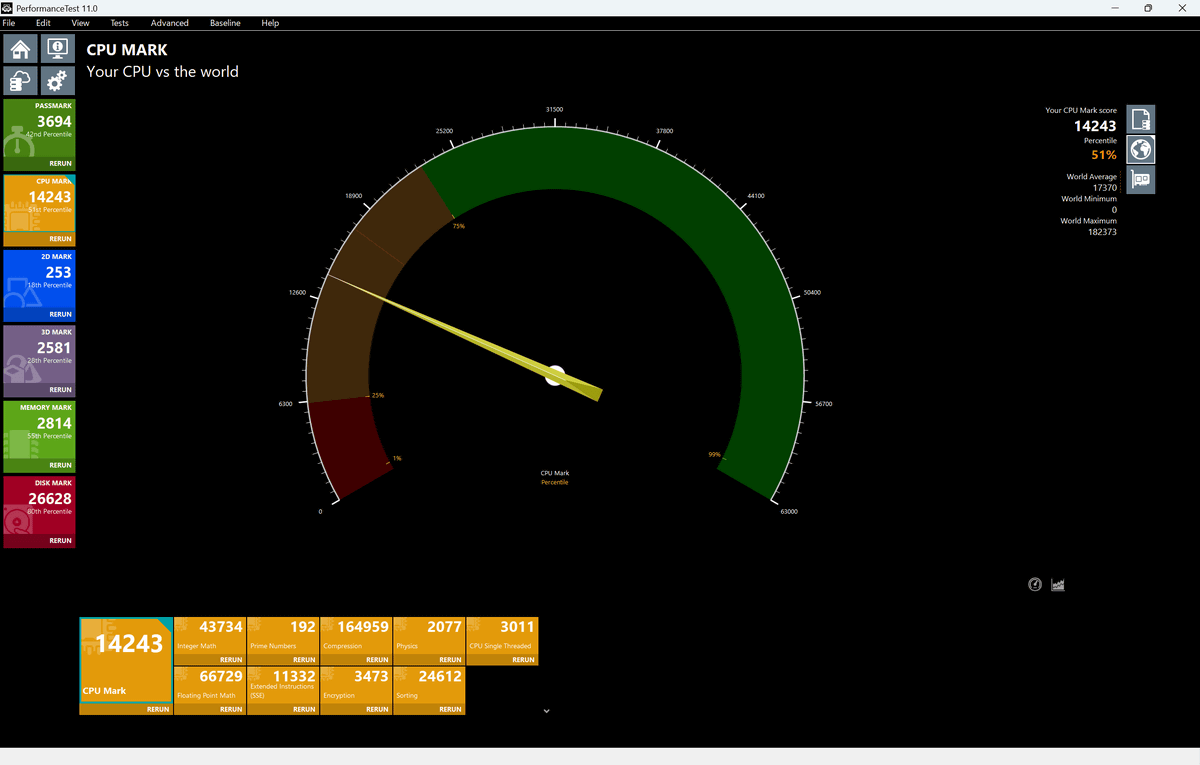
Since it is an emulation, the CPU column is written as 'Virtual @ 3.41GHz'. There is a difference in the score compared to the Vivobook, which was also running emulation, but I was not able to tell if this was due to a difference in the x86 conversion layer or what. The Windows version for the 7th generation Surface Laptop was 'Windows 11 version 24H2 (OS build 26100.1000)', and for the Vivobook it was 'Windows 11 version 24H2 (OS build 26100.863)'.
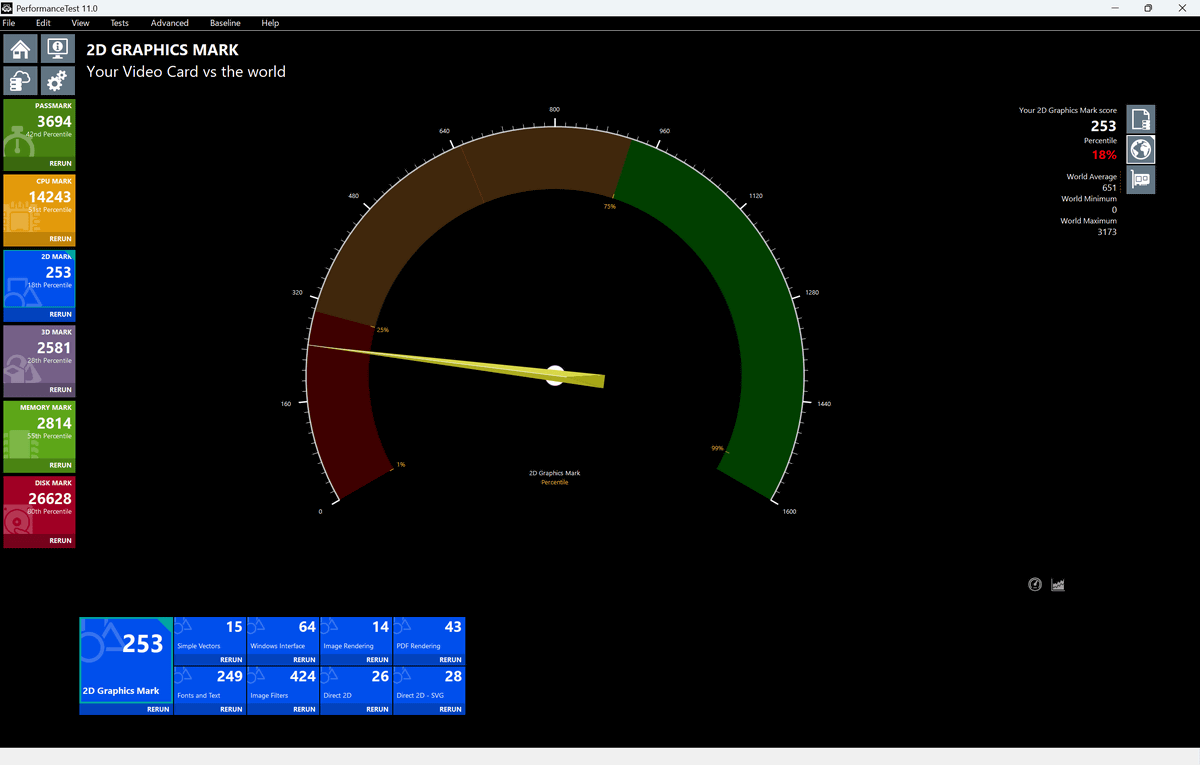
The 2D graphics score was '253', which is in the 18% percentile.
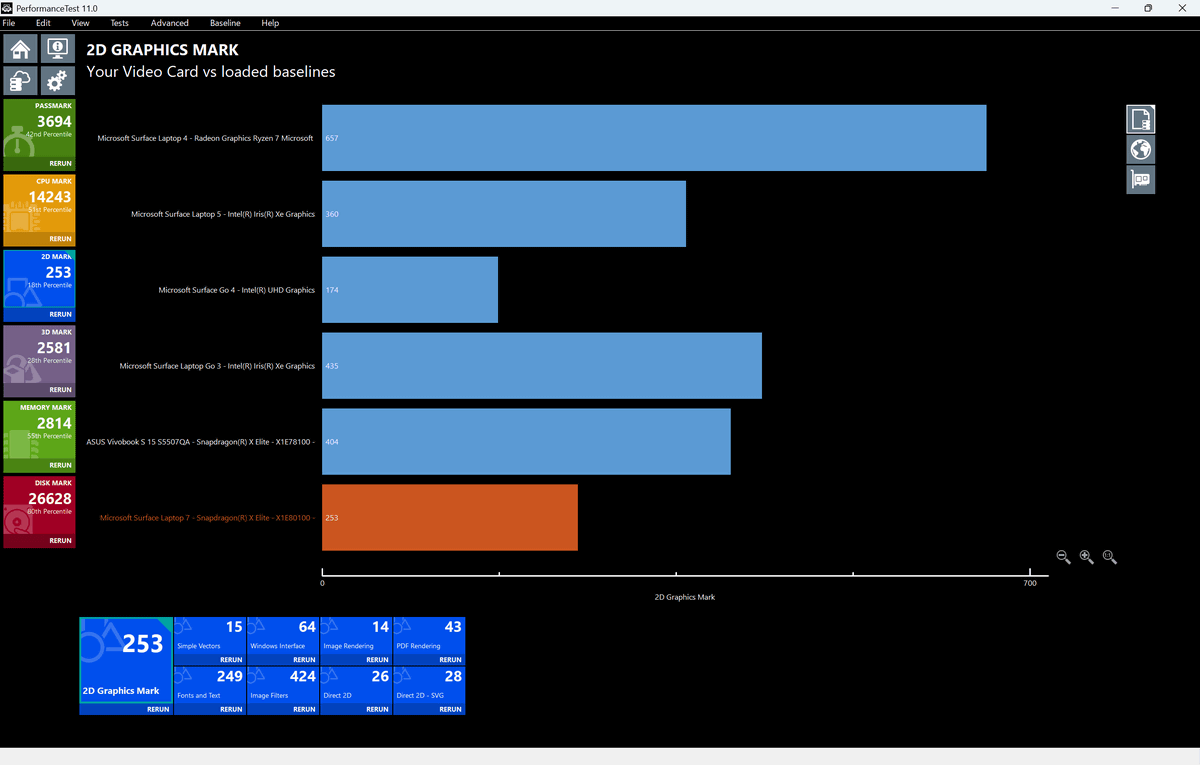
Here's a comparison with other models. Although it doesn't get as high a score as Intel's Iris Xe graphics, it does get a higher score than Intel UHD graphics.
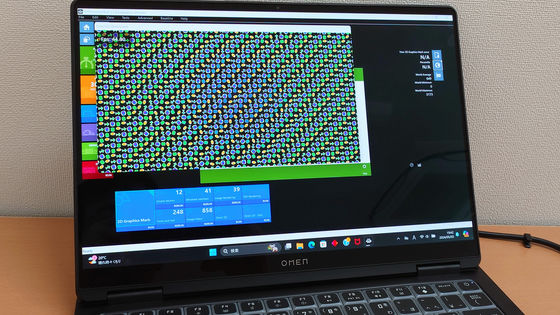
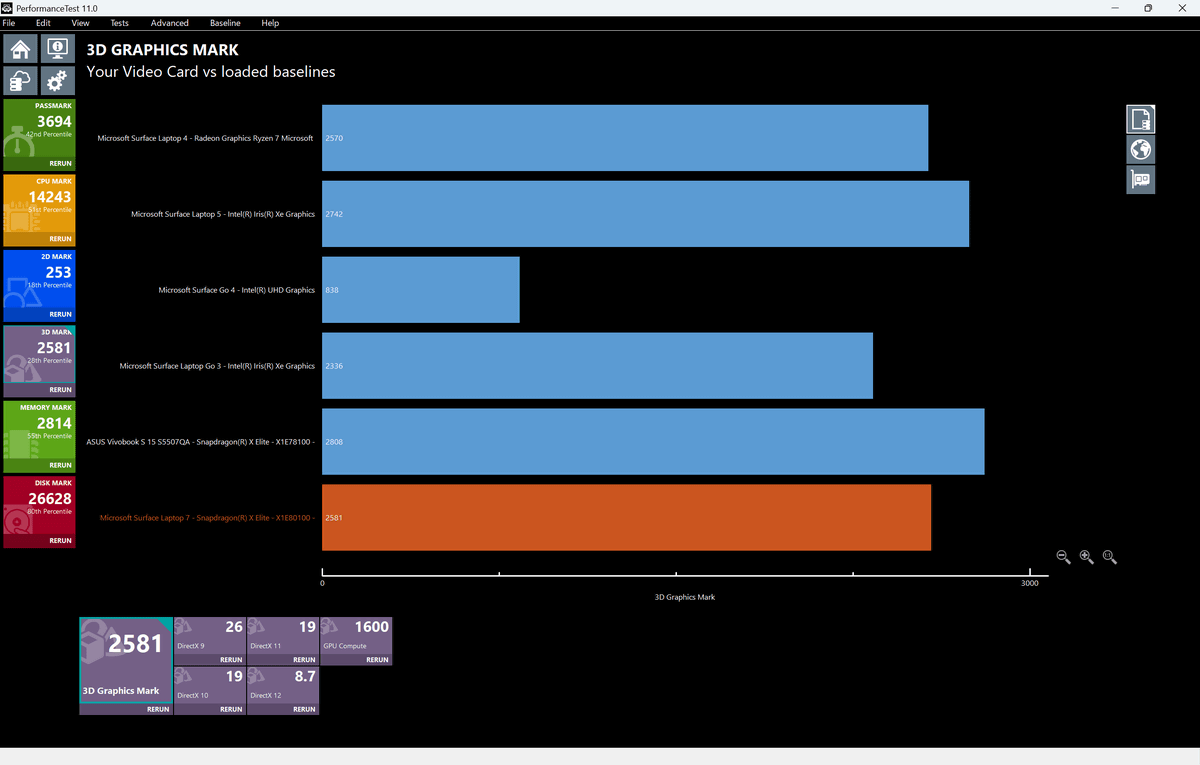
The 3D graphics score was 2581, which is in the 28th percentile.
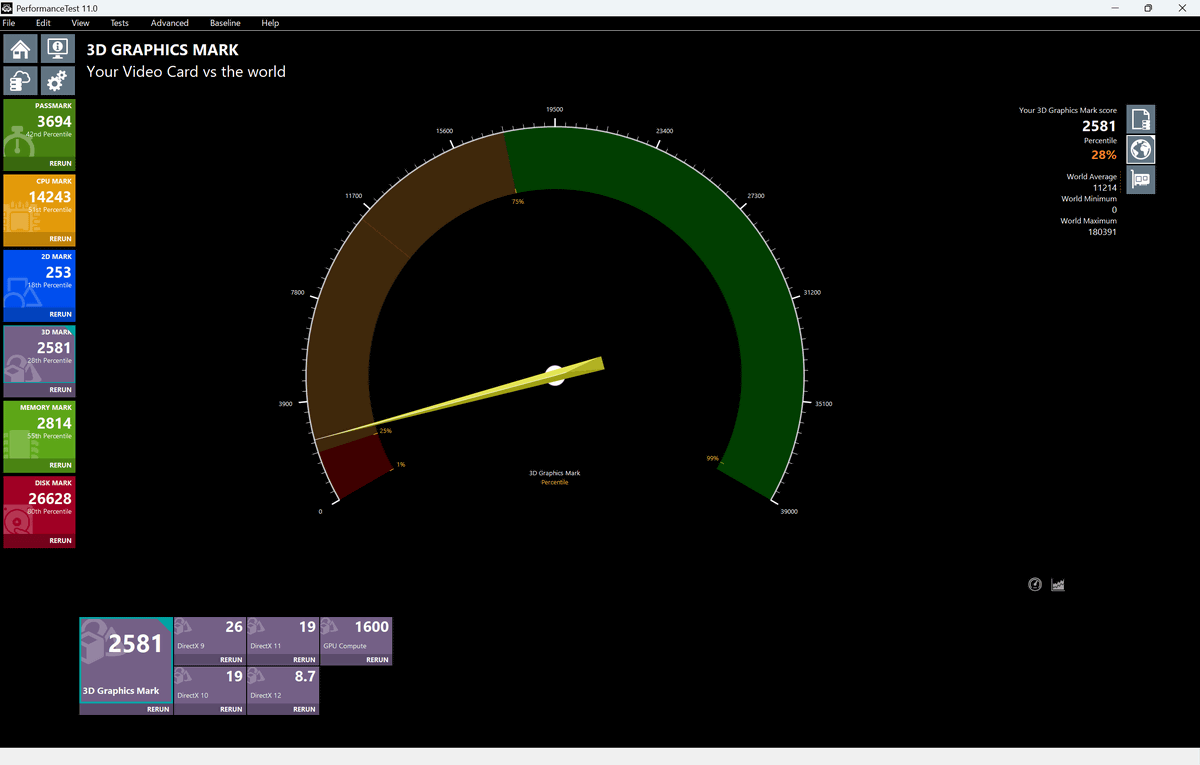
There wasn't much difference in score between this model and the other models listed here.
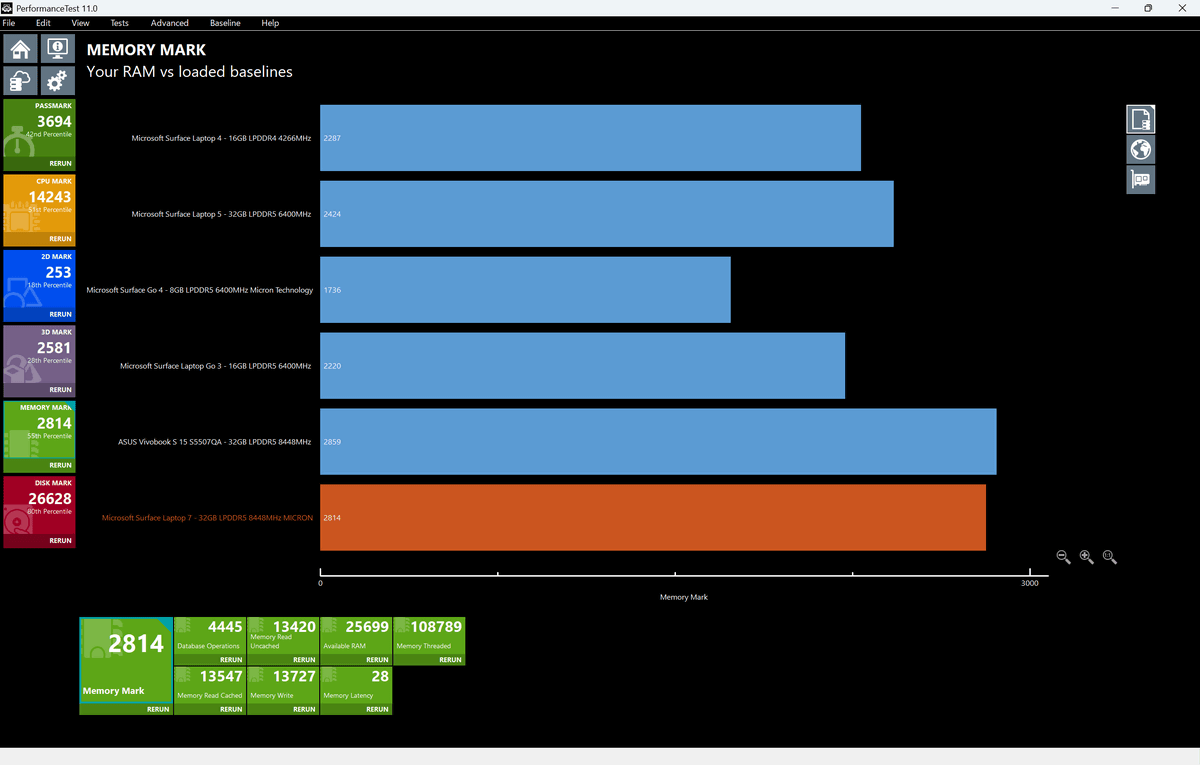
Memory score is 2814. Percentile is 55%.
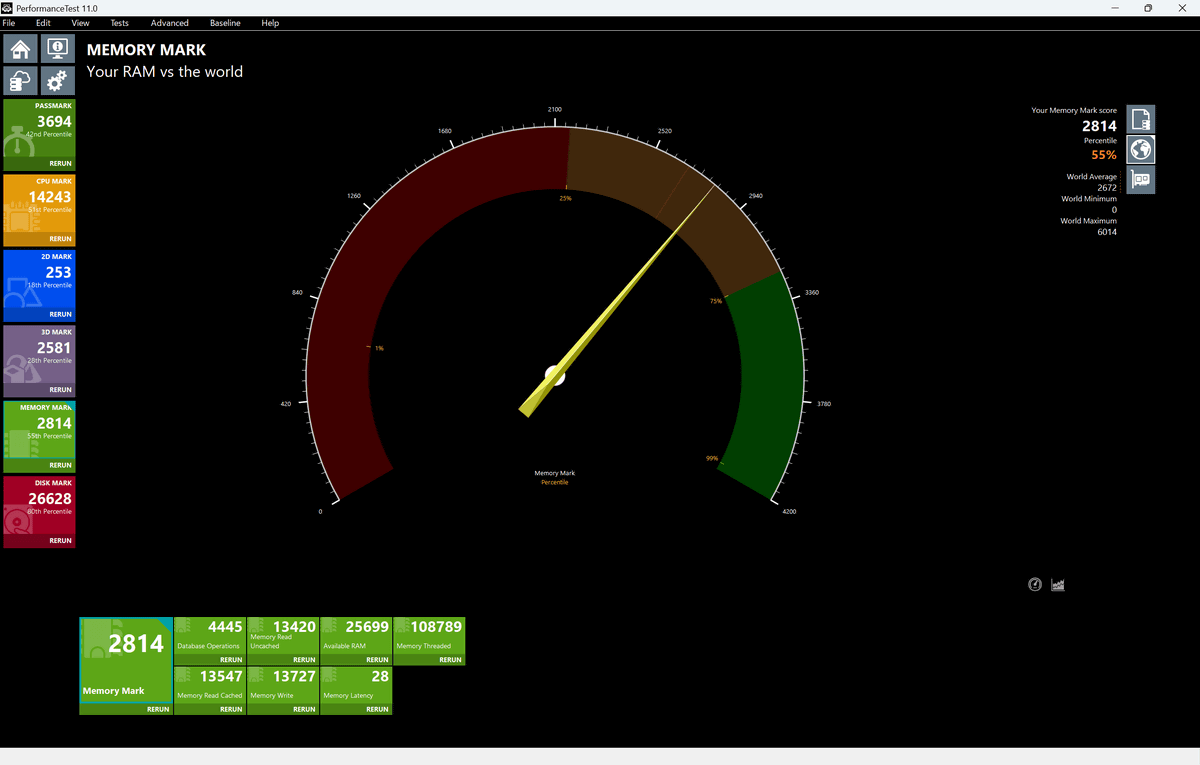
In terms of memory, the score was high, along with the Vivobook, which is also a Copilot+PC.
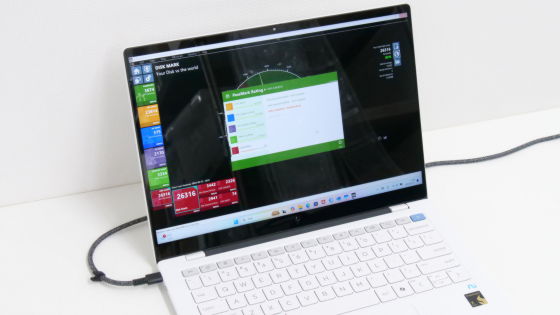
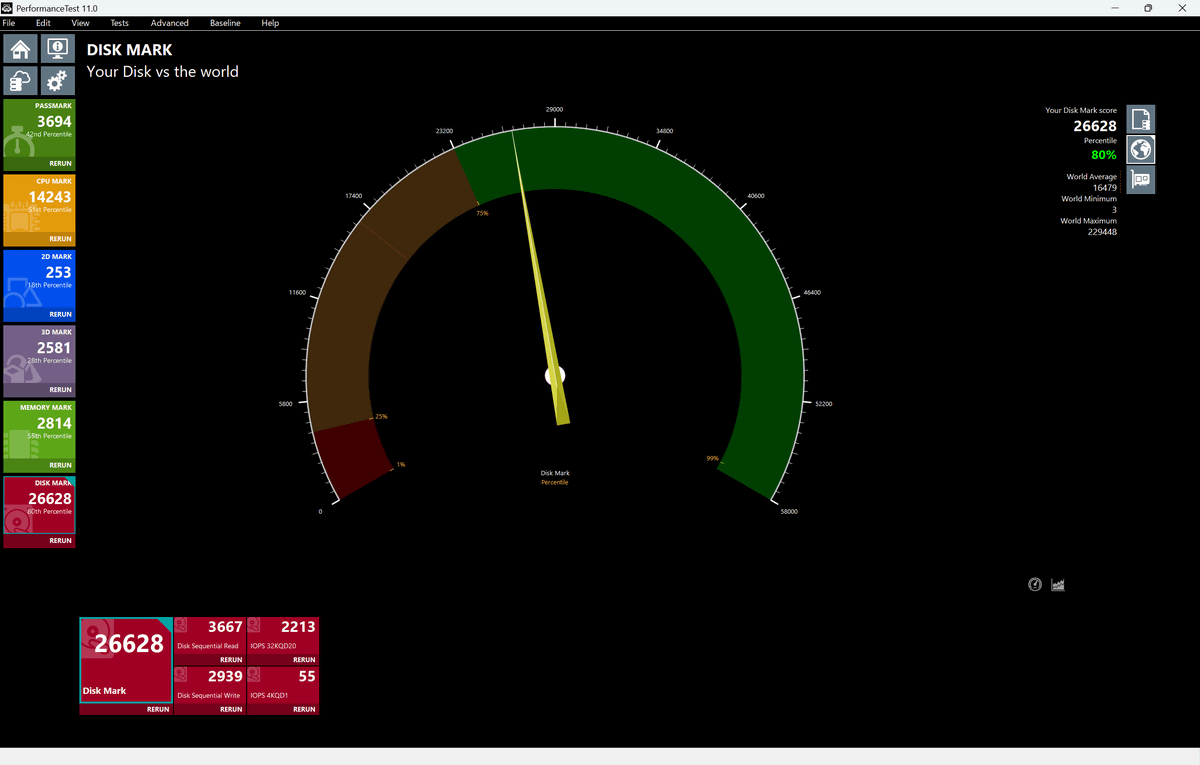
The disk score is 26628, which is in the 80th percentile, so it's quite high.
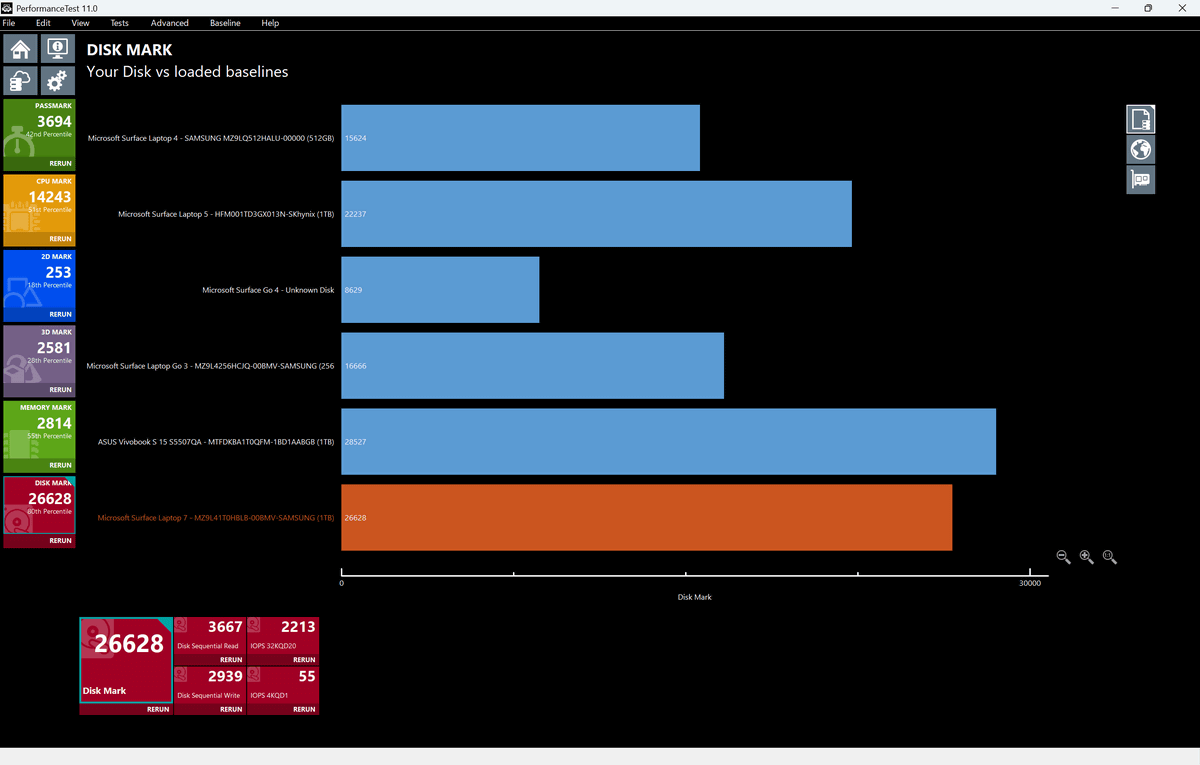
When compared with other models, it stands out along with the Vivobook.
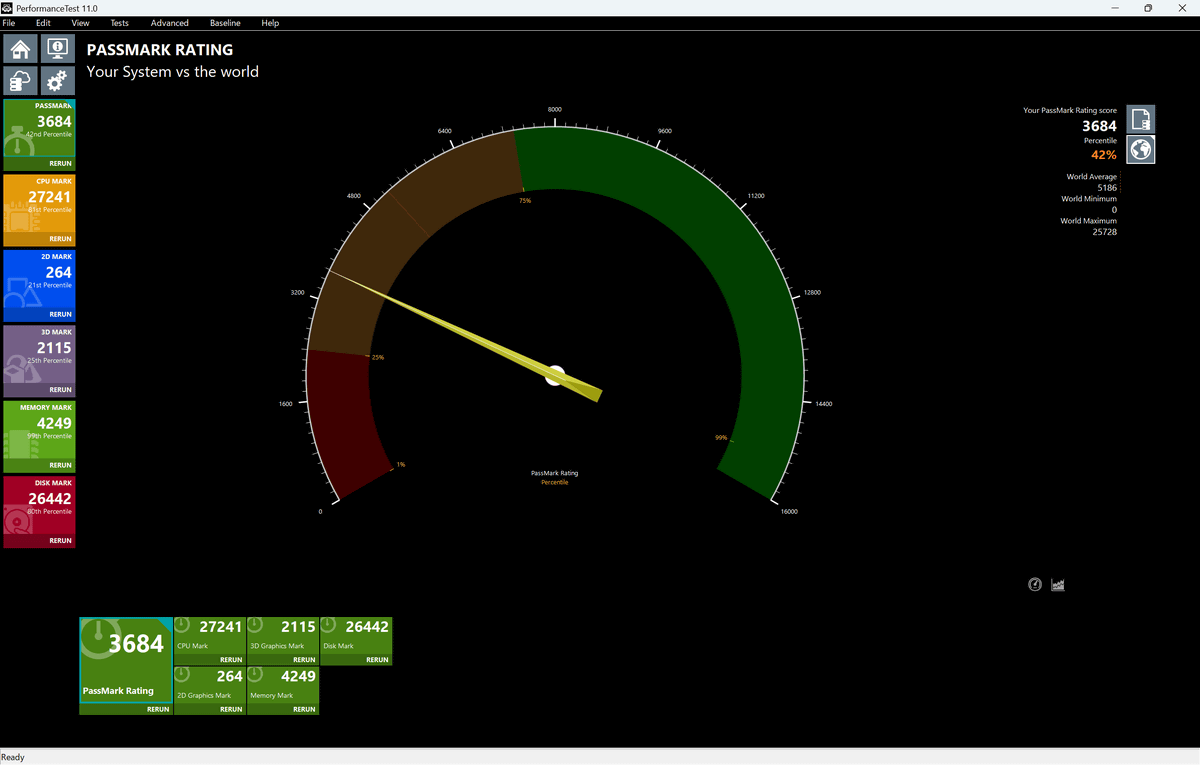
Next, the results for the ARM version. The overall score was 3684, with a percentile of 42%, almost the same as when the x86 version was run.
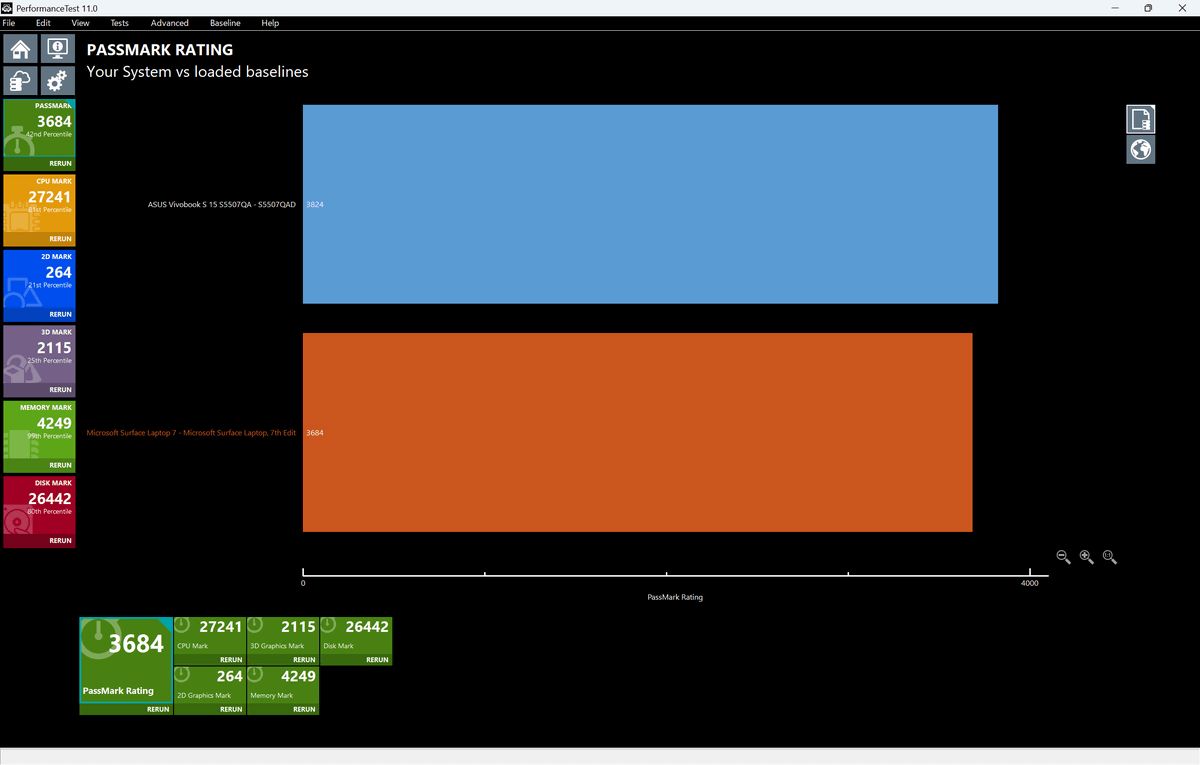
Comparison was only made with the ASUS Vivobook S 15, which also has the same ARM architecture.
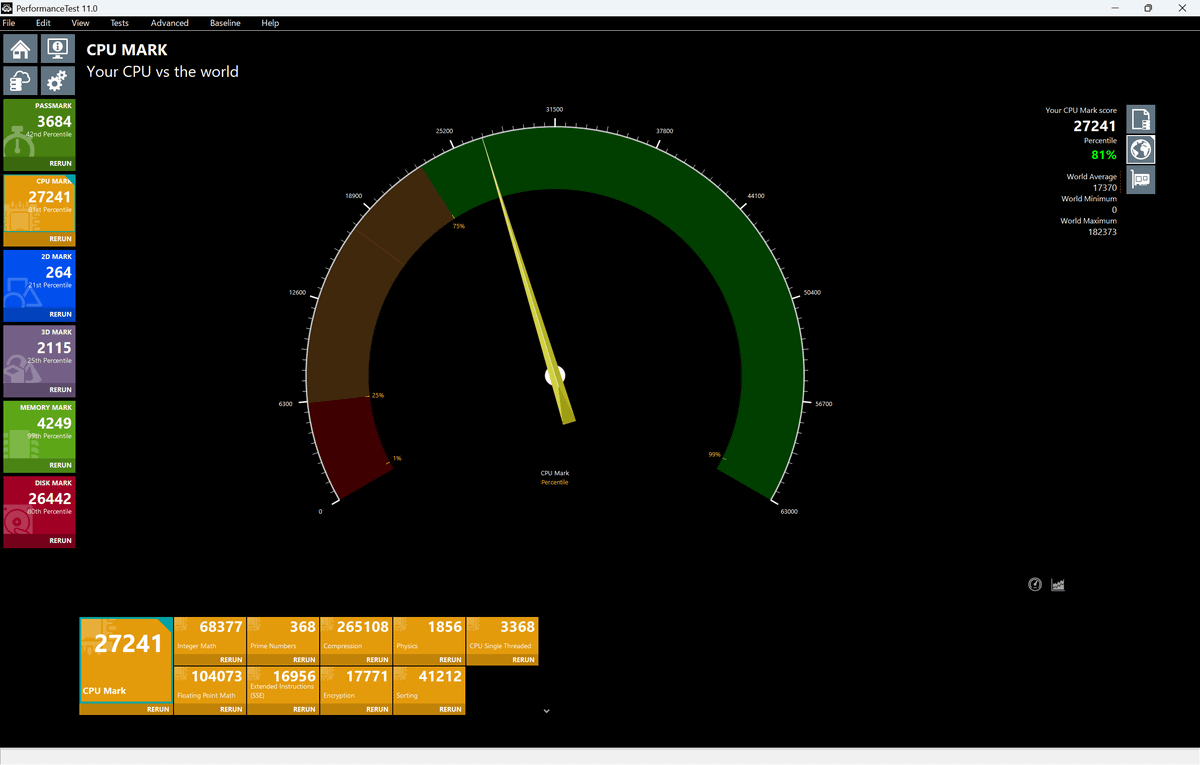
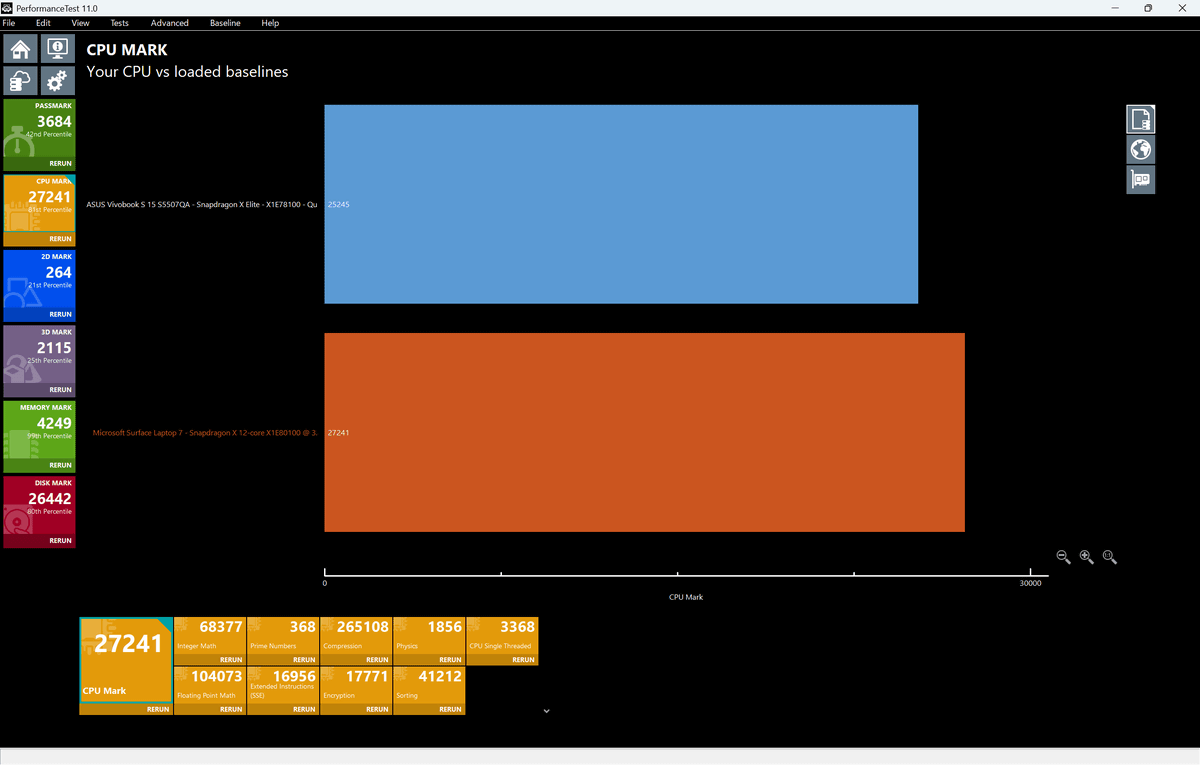
The CPU score was '27241', with a percentile of 81%, which is quite high.
The comparison results look like this.
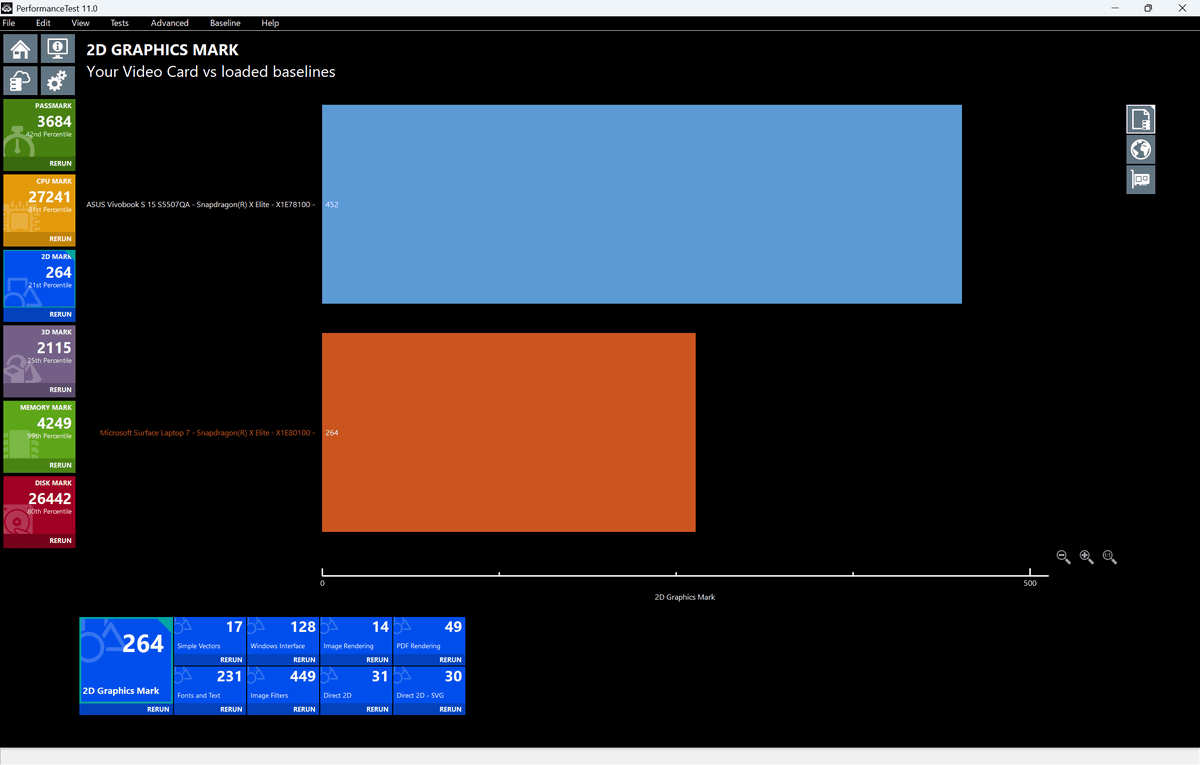
The 2D graphics score was 264, with a percentile of 21%, which is a little low.

It should be equipped with the same Snapdragon X Elite, but there is a difference with the Vivobook.
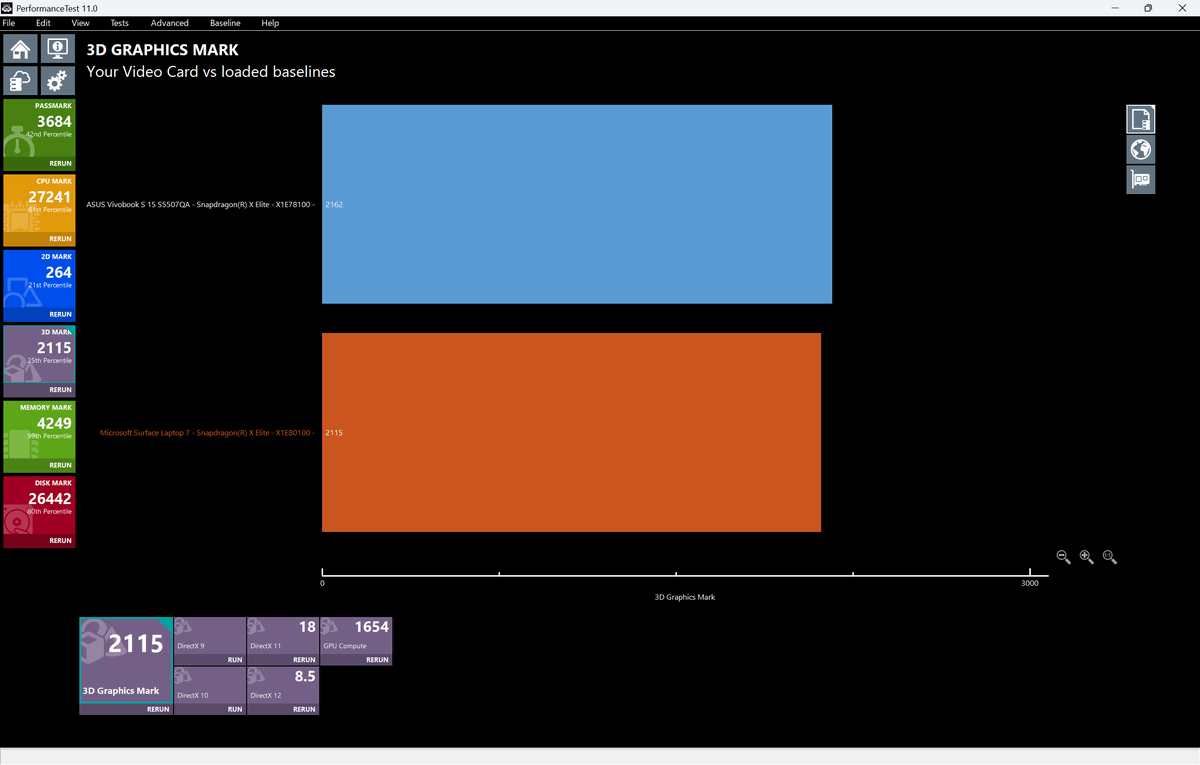
3D graphics score was '2115', percentile was 25%.
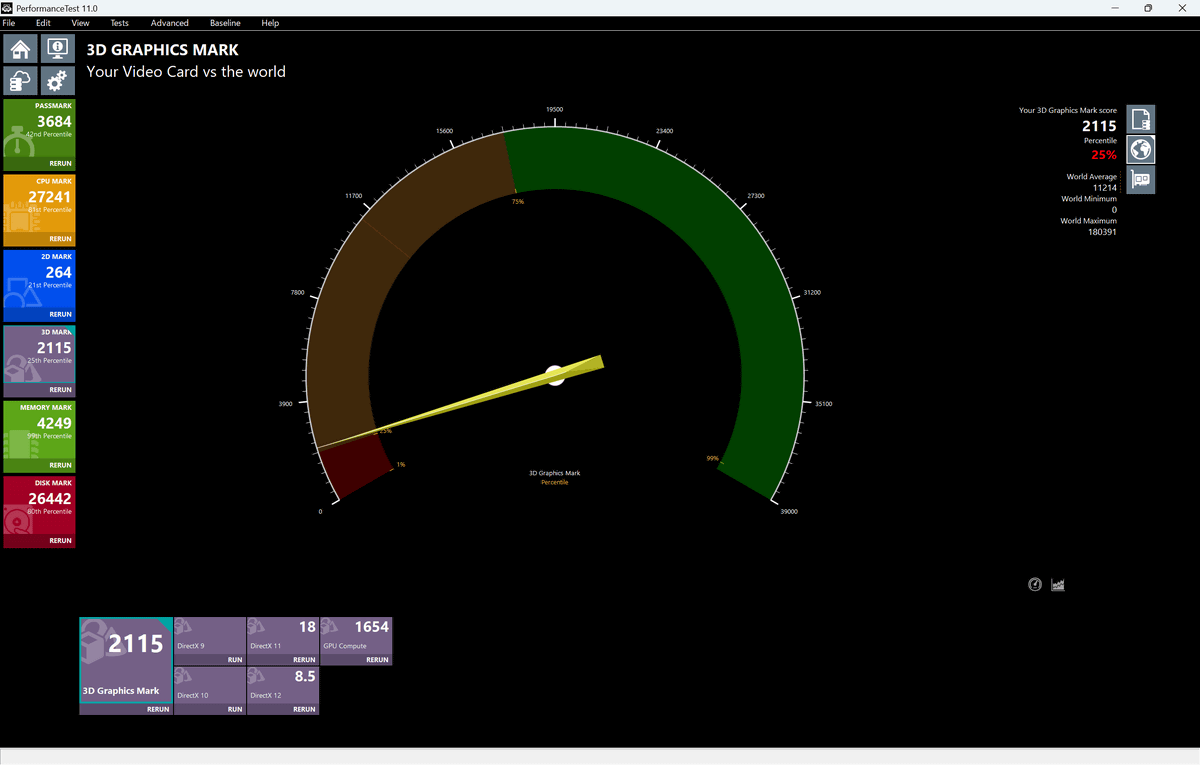
Unlike the 2D, it got almost the same score as the Vivobook.
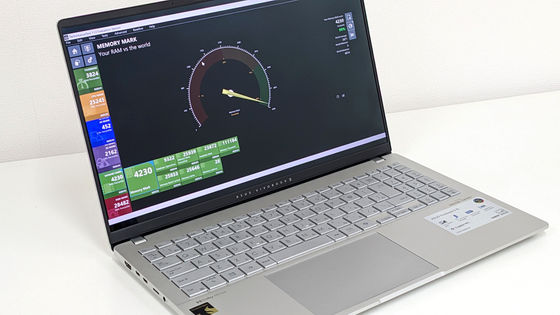
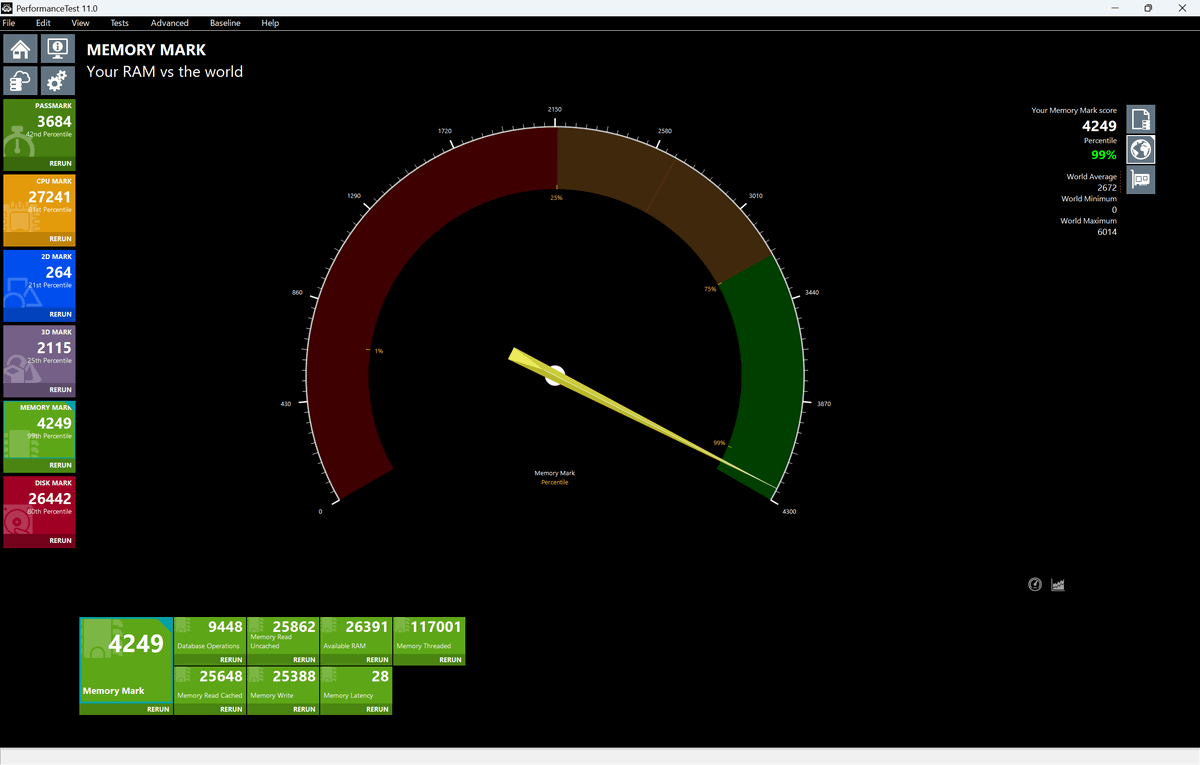
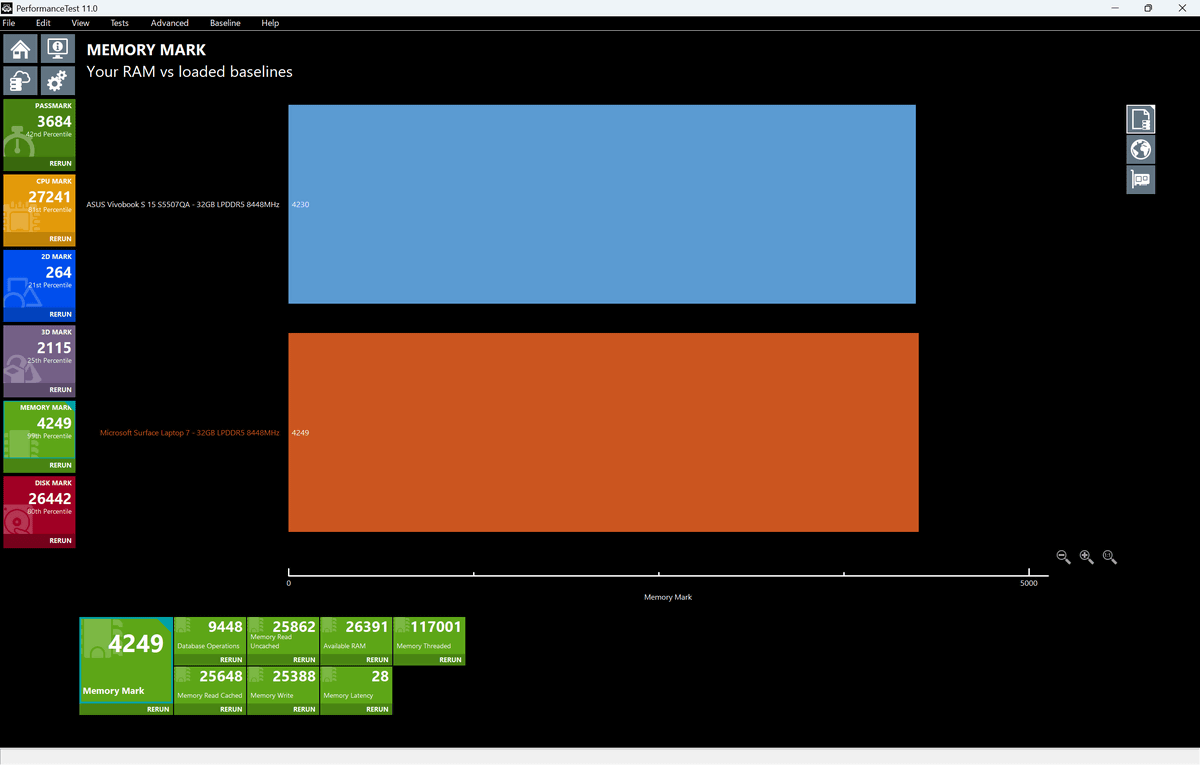
The memory score was 4249, which is in the 99th percentile, placing it in the top 1%.
The comparison results look like this, with the Vivobook also being a bit pricey.
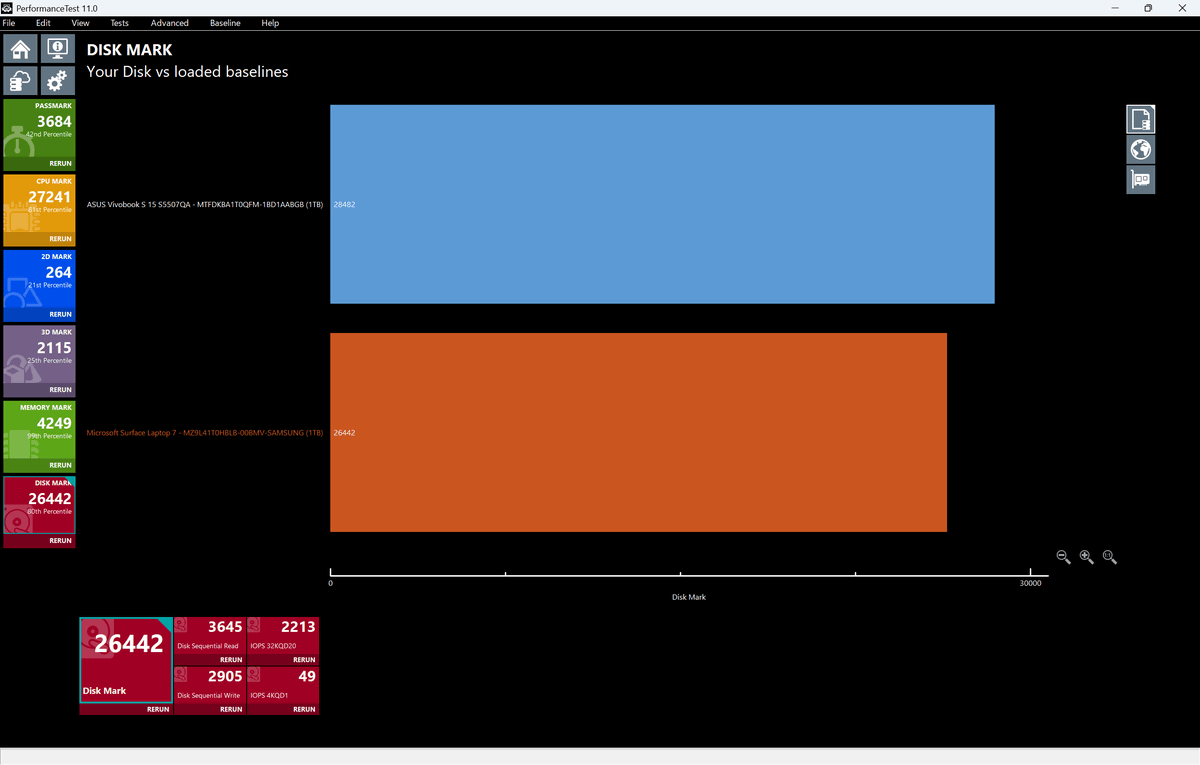
The disk's score was 26442. The percentile was high at 80%.

The comparison results were as follows.
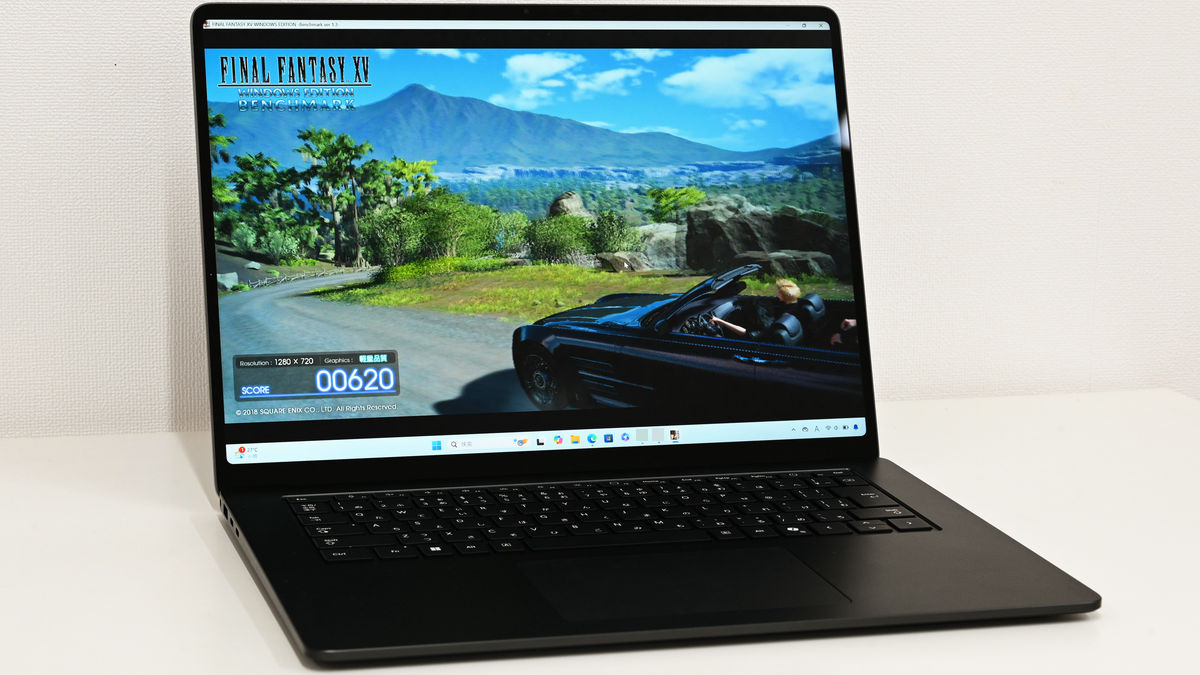
Next, I ran the '
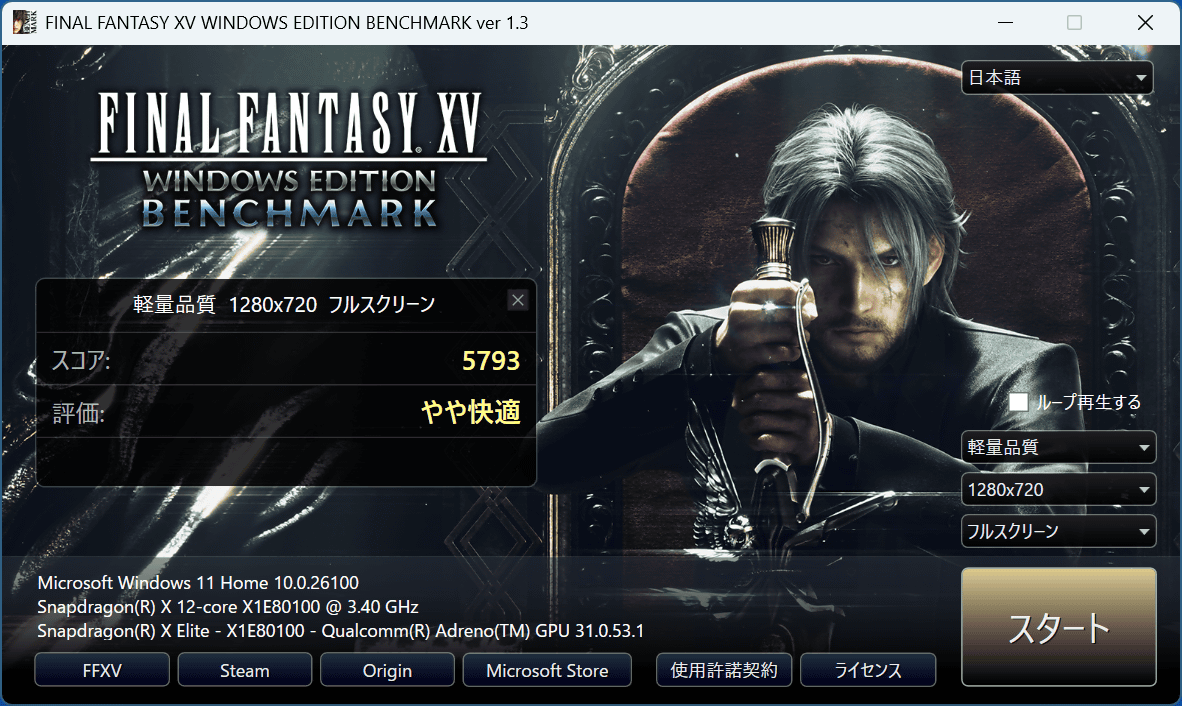
Below are the results of running 'Light Quality', 'Standard Quality', and 'High Quality' at full screen at four resolutions each. As expected, since this is not a device primarily intended for playing games, the operation is heavy at any resolution other than the minimum.
| Quality/Resolution | 3840×2160 | 2560×1440 | 1920×1080 | 1280×720 |
|---|---|---|---|---|
| Lightweight quality | 1362 (Difficult to operate) | 2321 (heavy) | 3192(Regular) | 5793 (somewhat comfortable) |
| Average quality | 1063 (Difficult to operate) | 1812 (Difficult to operate) | 2431 (heavy) | 4855 (somewhat comfortable) |
| high quality | 781 (Difficult to operate) | 1219 (Difficult to operate) | 1534 (Difficult to operate) | 2275 (heavy) |
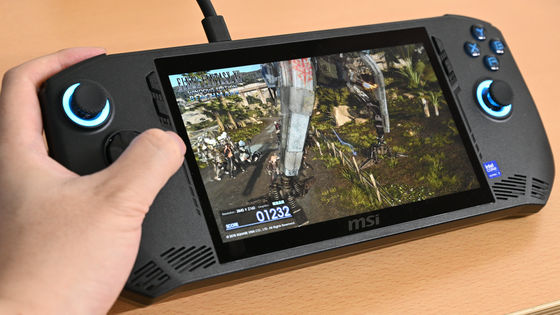
'We also ran the Final Fantasy XIV: Golden Legacy benchmark . This benchmark has five quality settings, and the resolution can be set to any resolution your PC can handle, which means there are a huge number of possible combinations, so we ran it at a resolution of 1920x1080 only.

The results are as follows, with all quality except the highest being 'average.'
| Quality/Resolution | 1920×1080 |
|---|---|
| Standard Note | 5151(Regular) |
| Standard Desktop | 5565(Normal) |
| High Quality Notes | 5109(Normal) |
| High Quality Desktop | 4455(Normal) |
| Best Quality | 3090 (recommended setting change) |
We will continue to measure battery life, heat, noise, etc. and compile information.
Continued
I tried running Microsoft's genuine local image generation AI on the Copilot+ PC-certified '7th generation Surface Laptop' and checked whether practical applications such as Photoshop and ATOK work - GIGAZINE
Related Posts: