A benchmark review that thoroughly compares Apple's 'M2' chip and AMD's 'Ryzen 7 PRO 6850U' is released

Prepare the ``
Apple M2 vs. AMD Ryzen 7 PRO 6850U Performance In Nearly 200 Benchmarks - Phoronix
https://www.phoronix.com/review/apple-m2-amd-ryzen
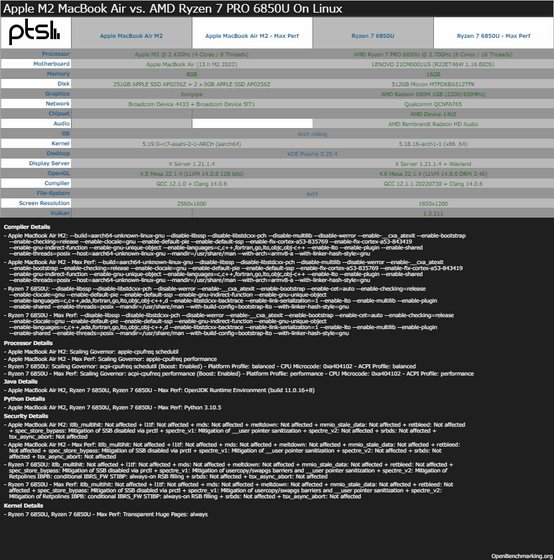
Phoronix adopted Arch Linux , which is Linux that runs on Apple Silicon, in order to match the conditions of the M2-equipped MacBook Air and ThinkPad X13 Gen 3 as much as possible when performing benchmark tests. Also, in order to maximize the performance of each CPU, set the ACPI profile, which is a standard for power management and hardware configuration management, to 'performance mode' and CPU frequency scaling to 'performance priority'. doing. In addition, since the M2-equipped MacBook Air does not support Linux power / temperature sensors, ``We cannot accurately compare the performance per watt of the M2 and Ryzen 7 PRO 6850U,'' Phoronix wrote. .
The specifications of the M2-equipped MacBook Air and ThinkPad X13 Gen 3 that ran the benchmark test are as follows. The difference in specifications is that the M2-equipped MacBook Air has 8 GB of memory (RAM) and 251 GB of storage (ROM), while the ThinkPad X13 Gen 3 has 16 GB of RAM and 512 GB of ROM.
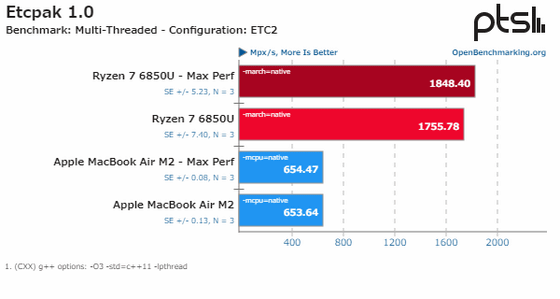
◆Etcpak 1.0
The score when benchmarking with
Ryzen 7 PRO 6850U wins in multithread performance comparison
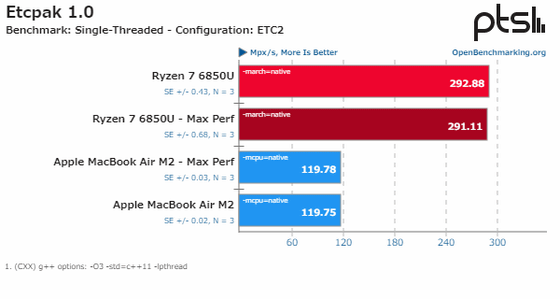
Ryzen 7 PRO 6850U records more than double the score difference even in single thread performance
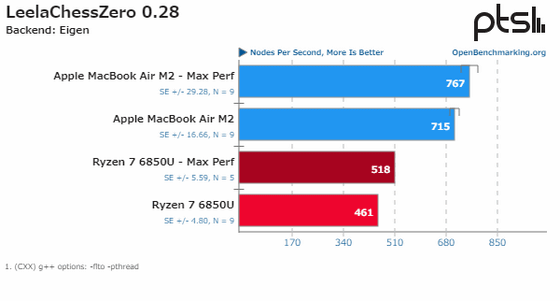
◆ Leela Chess Zero 0.28
A graph that scores performance when running version 0.28 of
Here the MacBook Air with M2 recorded a better score
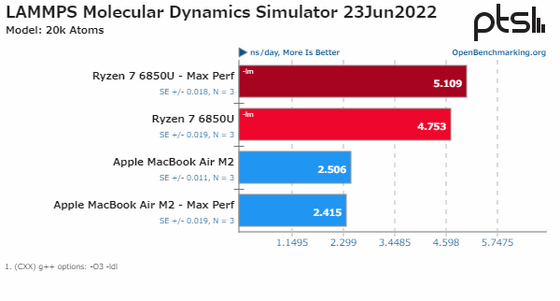
◆LAMMPS Molecular Dynamics Simulator
The graph below scores the performance of LAMMPS , a molecular dynamics program at Sandia National Laboratories. A higher number means better performance.
This is the overwhelming victory of Ryzen 7 PRO 6850U
◆WebP Image Encode 1.1
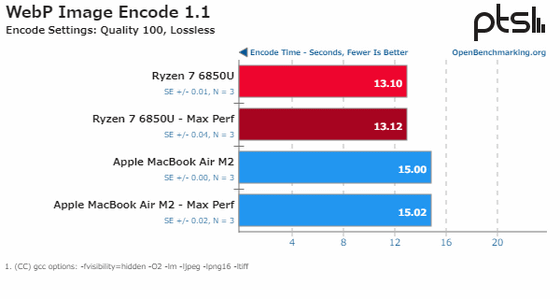
The graph below scores the time it takes to encode an image into
As a result, Ryzen 7 PRO 6850U is superior, although it is a small difference.
◆simdjson 2.0
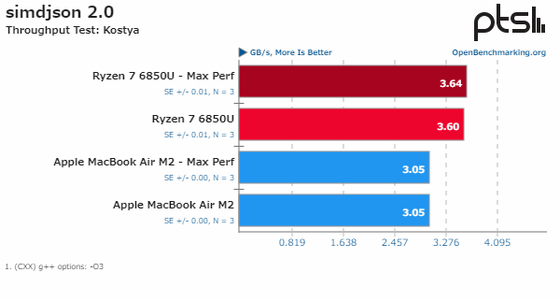
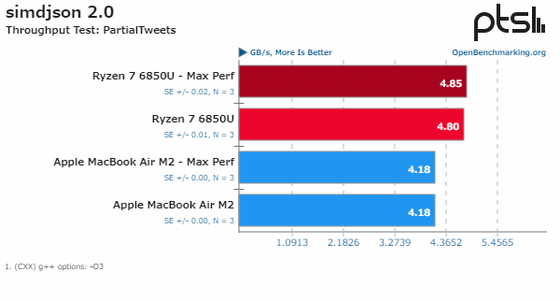
The graph below scores the data transfer speed when using
Although we tested it in two ways, the result was that the Ryzen 7 PRO 6850U was superior in both formats.
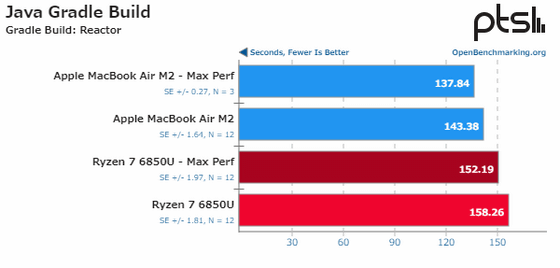
◆Java Gradle Build
The graph below scores the time it takes to build a Java application with
MacBook Air with M2 wins by a small margin
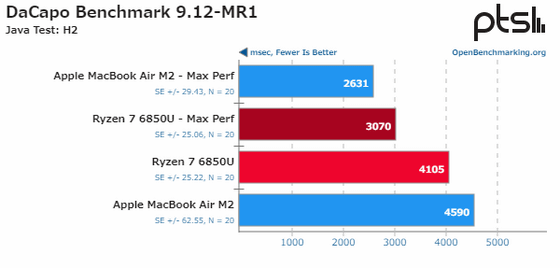
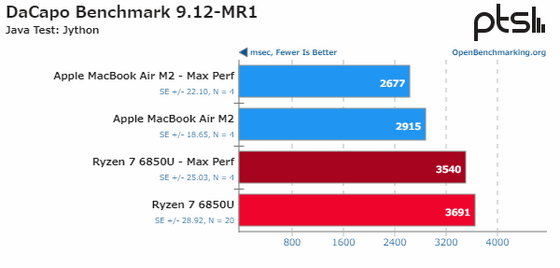
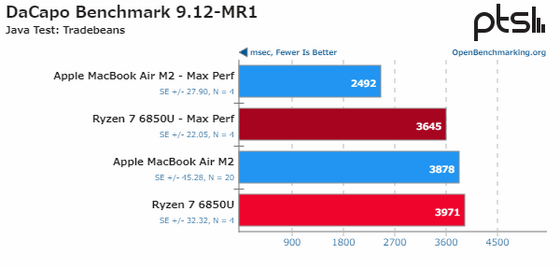
◆DaCapo Benchmark 9.12-MR1
The graph below shows the score when using the benchmark software '
Java Test: H2
Java Test: Jython
Java Test: Tradebeans
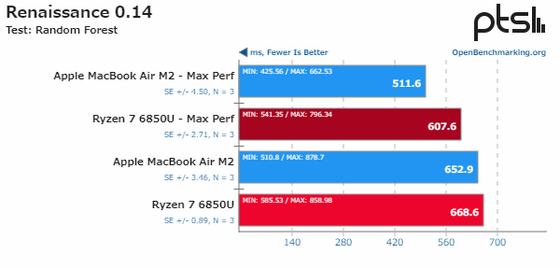
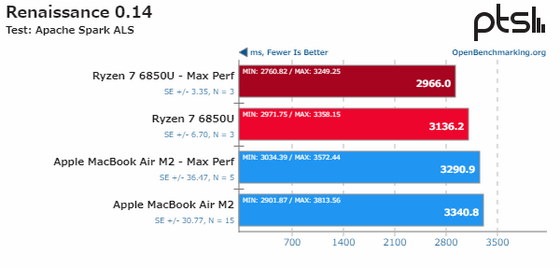
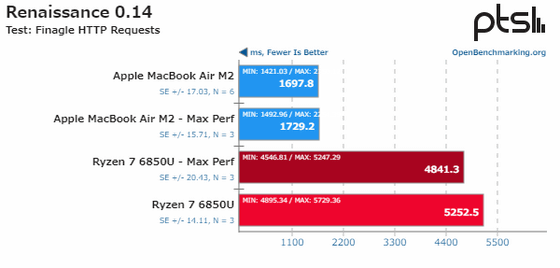
◆ Renaissance 0.14
The graph below shows the score when using the benchmark software '
Random Forest
Apache Spark ALS
Finagle HTTP Requests
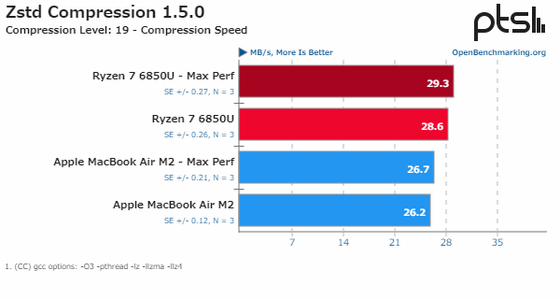
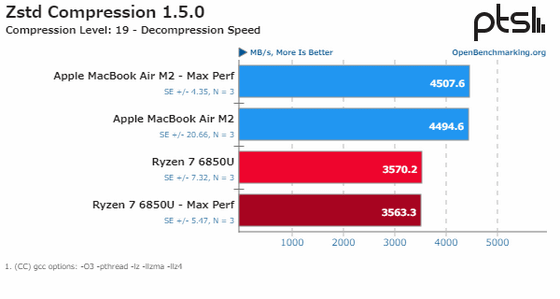
◆Zstd Compression 1.5.0
The graph below shows the data compression speed when using the real-time compression algorithm
Compression speed at compression level 19
Decompression speed at compression level 19
◆GNU Radio
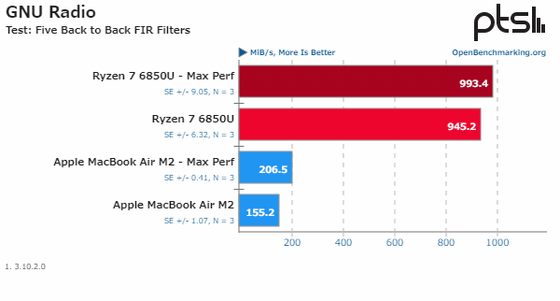
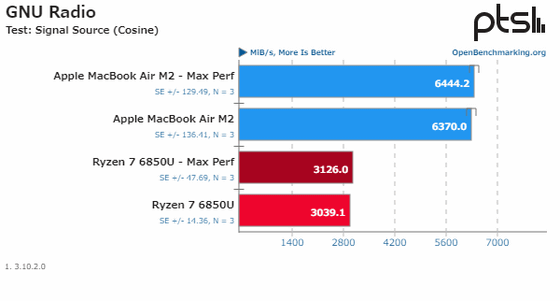
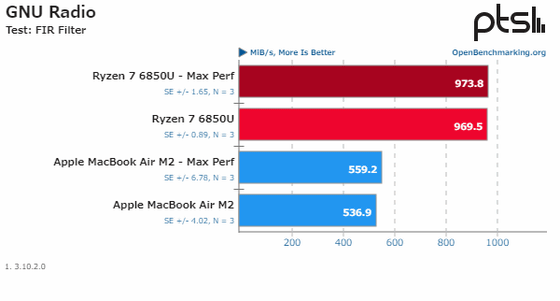
The graph below shows the data transfer speed when using '
When passing through 5 FIR filters in succession
When tested with a signal source
When passed through an FIR filter
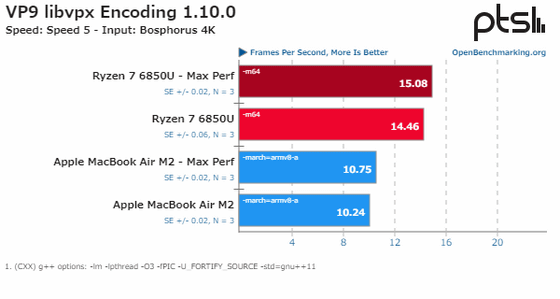
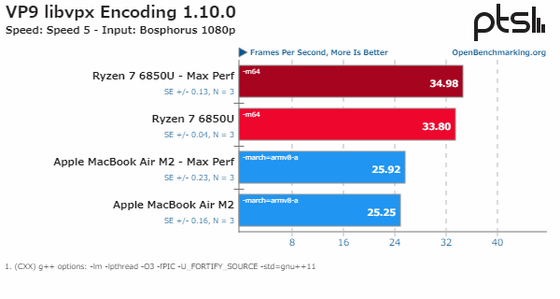
◆Vp9 libvpx Encoding 1.10.0
The graph below shows the data compression speed when compressing a video using VP9 , a video compression codec developed by Google. A higher number means better performance.
When compressing 4K video
When compressing 1080p video
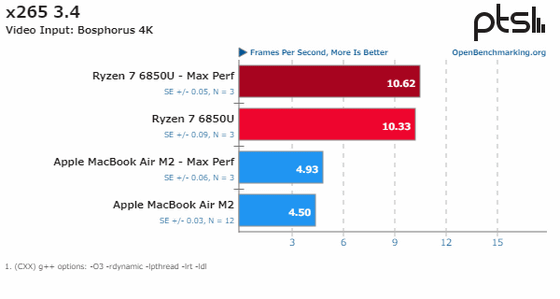
x265 3.4
The graph below shows the data compression speed when compressing 4K video using the video compression standard
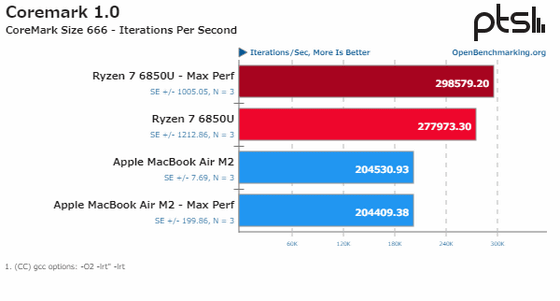
◆Coremark 1.0
The graph below shows the score when using the benchmark software '
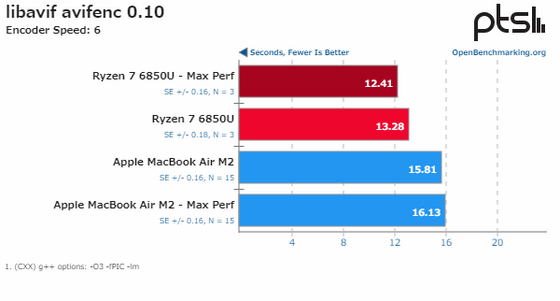
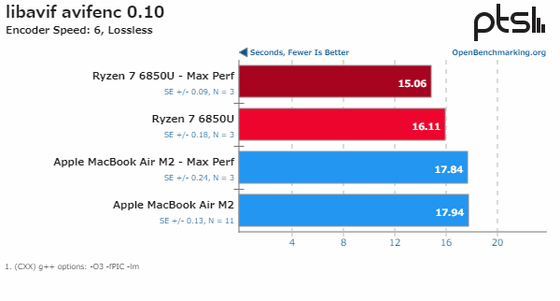
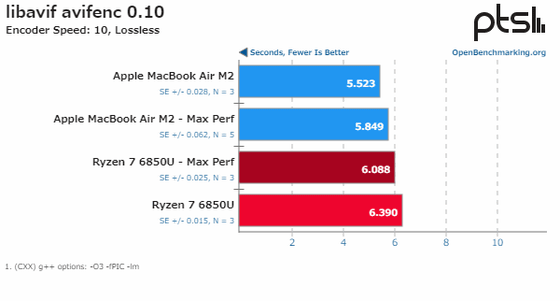
◆libavifavifenc 0.10
The graph below summarizes the time it takes to create an AVIF file using
When the setting is encoder speed 6
If the settings are encoder speed 6 and lossless
When the setting is encoder speed 10 and lossless
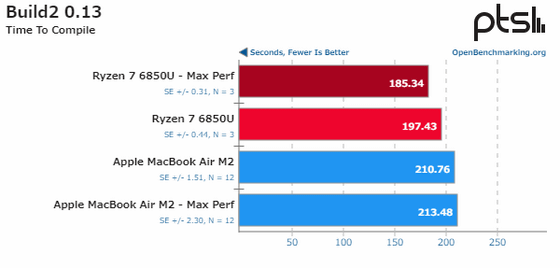
◆Build2 0.13
The graph below summarizes the time required to compile using
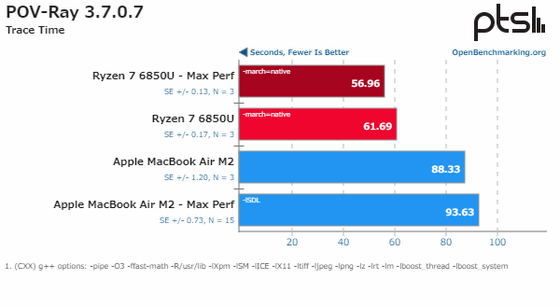
◆POV-Ray 3.7.0.7
The graph below summarizes the time required for tracing when using the ray tracing software '
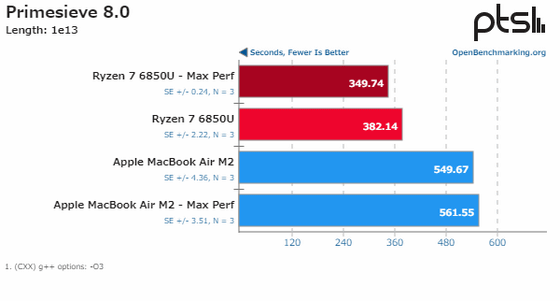
◆Prime Sieve 8.0
The graph below summarizes the processing time when using
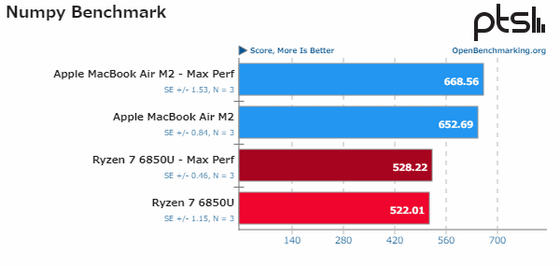
◆ Numpy Benchmark
The graph below summarizes the
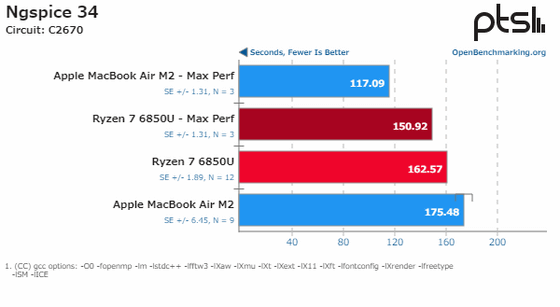
◆Ngspice 34
The graph below summarizes the processing time of the open source electric and electronic circuit simulator
Circuit: C2670
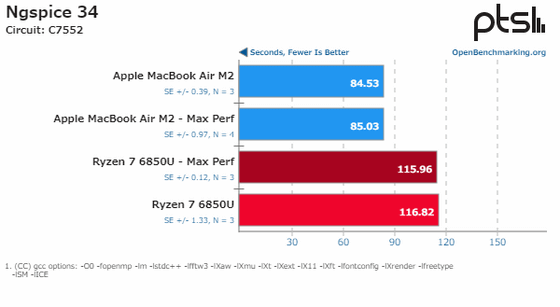
Circuit: C7552
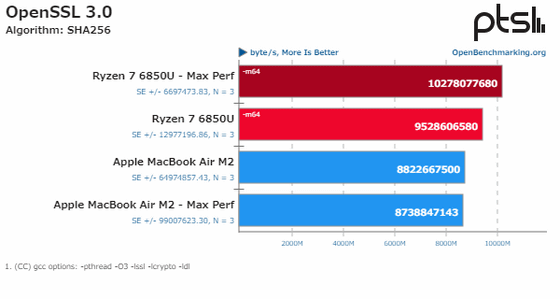
◆ OpenSSL 3.0
The graph below summarizes the data transfer speed when calculating the hash value of SHA256 with the open source library OpenSSL version 3.0. A higher number means better performance.
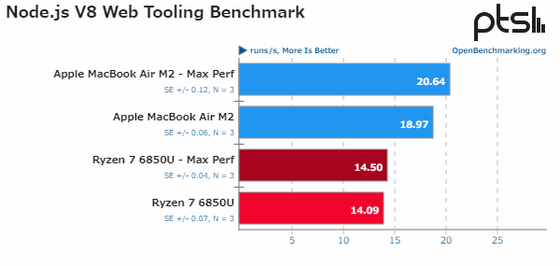
◆Node.js V8 Web Tooling Benchmark
The graph below summarizes the scores of the benchmark software
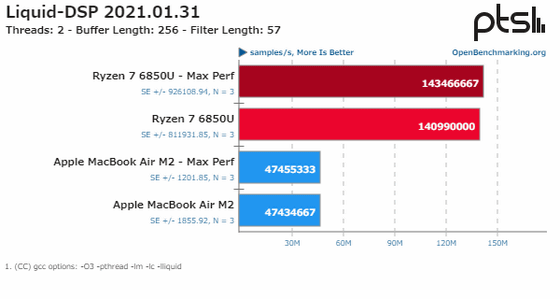
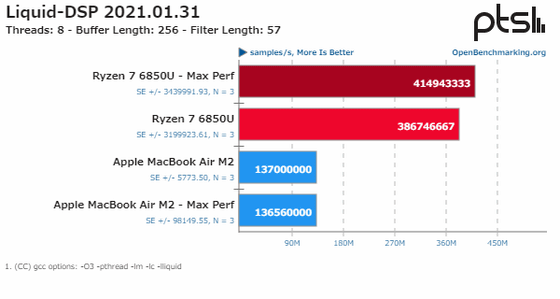
◆Liquid-DSP 2021.01.31
The graph below summarizes the data processing speed when using the open source signal processing library
Thread: 2, Buffer length: 256, Filter length: 57
Thread: 8, Buffer Length: 256, Filter Length: 57
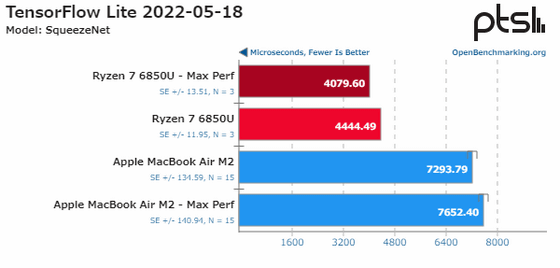
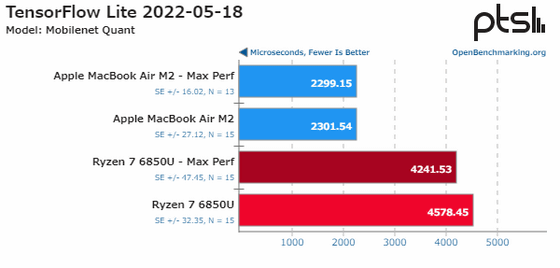
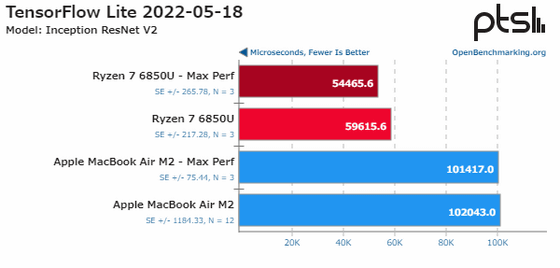
◆TensorFlow Lite 2022-05-18
The graph below summarizes the time taken to process data when using
Model: SqueezeNet
Model: Mobilenet Quant
Model: Inception ResNet V2
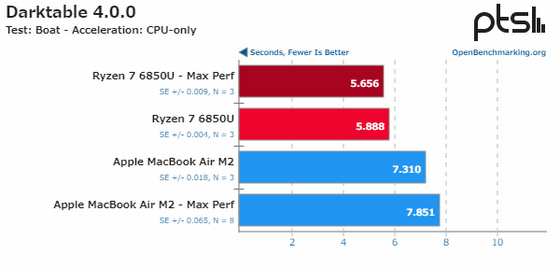
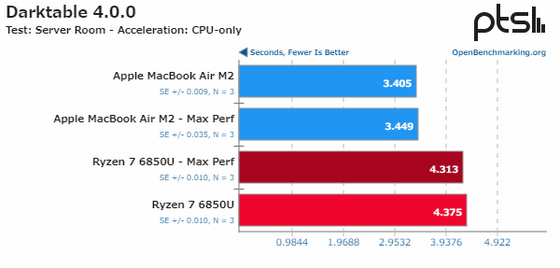
◆Darktable 4.0.0
The graph below summarizes the time taken for data processing when using
Test: Boat
Test: server room
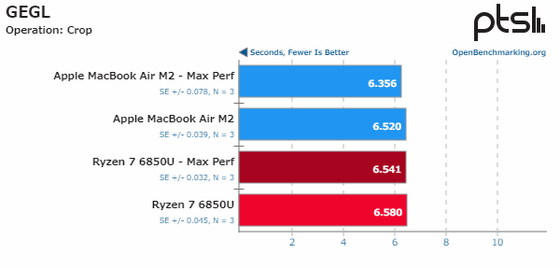
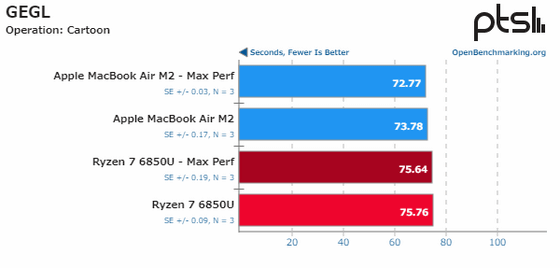
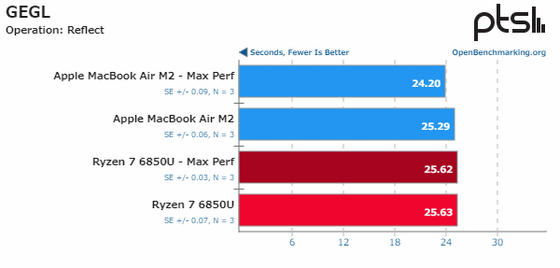
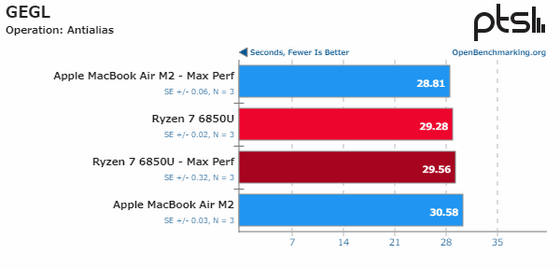
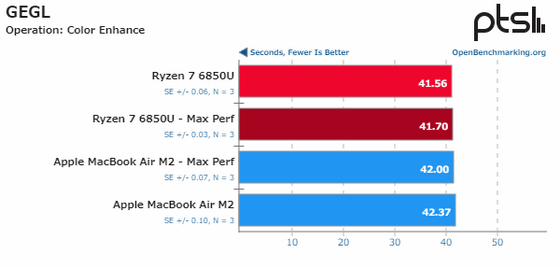
◆GEGL
The graph below summarizes the time required for data processing when using the programming library
Execution processing: Crop
Execution processing: cartoon conversion
Execution processing: Reflection
Execution processing: anti-aliasing
Execution processing: color enhancement
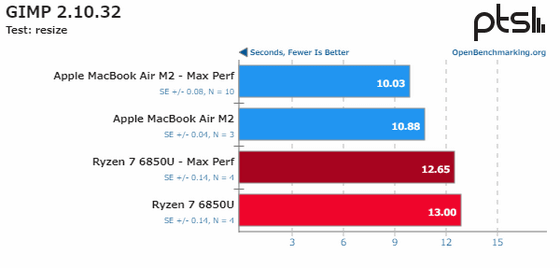
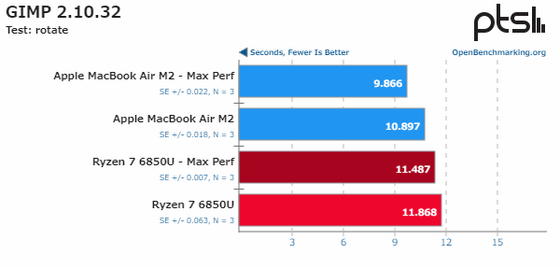
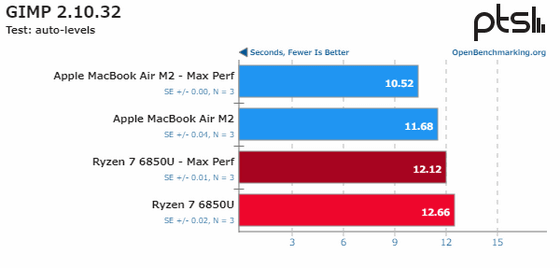
◆ GIMP 2.10.32
The graph below summarizes the time taken for data processing when using the photo retouching software
Execution processing: Resize
Execution processing: rotation
Execution processing: automatic level correction
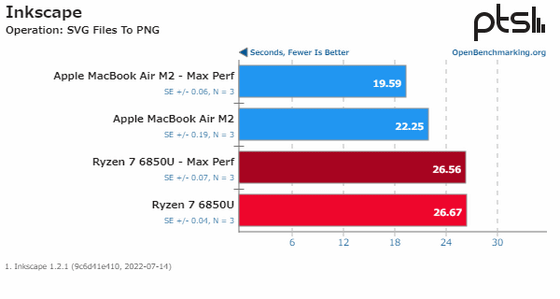
◆Inkscape
The graph below summarizes the time it takes to convert an SVG file to a PNG file using
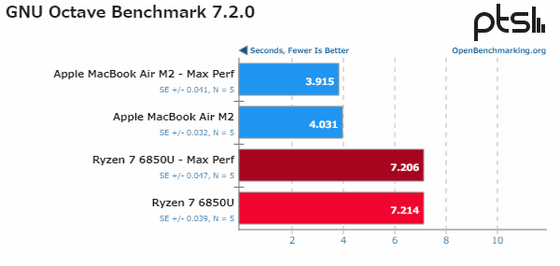
◆GNU Octave Benchmark 7.2.0
The graph below summarizes the results of measuring the time it takes to call a C ++ executable file from GNU Octave using the benchmark software
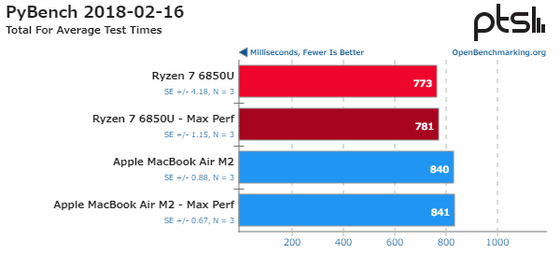
◆ PyBench 2018-02-16
The graph below summarizes the results of measuring the average test time of various functions with Python benchmark software
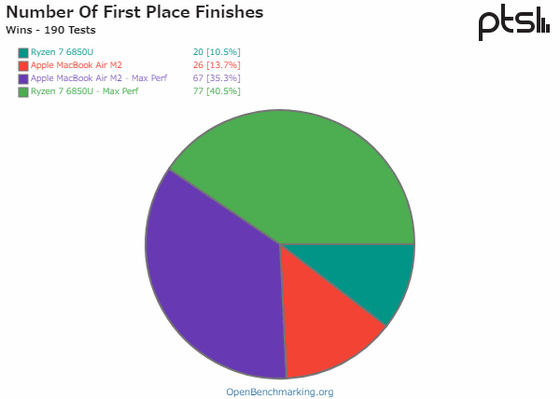
Among the 190 types of benchmark tests that were conducted, the ones with the highest scores were classified as follows. Ryzen 7 PRO 6850U (yellow-green) 20 types (10.5%), M2 (orange) 26 types (13.7%), M2 maximum performance (purple) 67 types (35.3%), Ryzen 7 PRO 6850U maximum performance ( Blue-green) is 77 types (40.5%).
Taking the average value of all benchmark tests is as follows. A higher number means better performance.
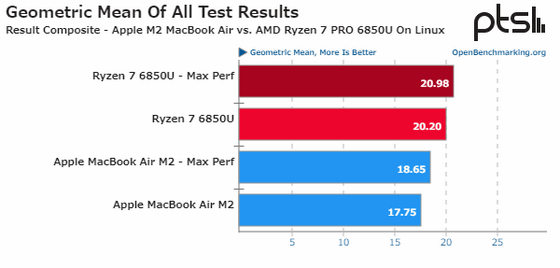
In addition, Phoronix wrote that how close the M2-equipped MacBook Air can be to the score of Ryzen 7 PRO 6850U, ``whether the target software is optimized for AArch64 '' and ``depends heavily on a subset of workloads.'' , and points out that the low score is partly due to the limited Linux support in Apple Silicon.
Related Posts:


