'Seismic Explorer' is an earthquake map that allows you to filter earthquakes that have occurred around the world by magnitude and period and display the epicenter on a 3D map
' Seismic Explorer ' is a service that allows you to filter earthquakes that have occurred around the world by magnitude and period and display them on a map. It is also possible to map earthquake occurrences in chronological order and view the depth of the epicenter of earthquakes that occurred in a specific area on a 3D map, so I tried using it to see what kind of service it is.
Seismic Explorer
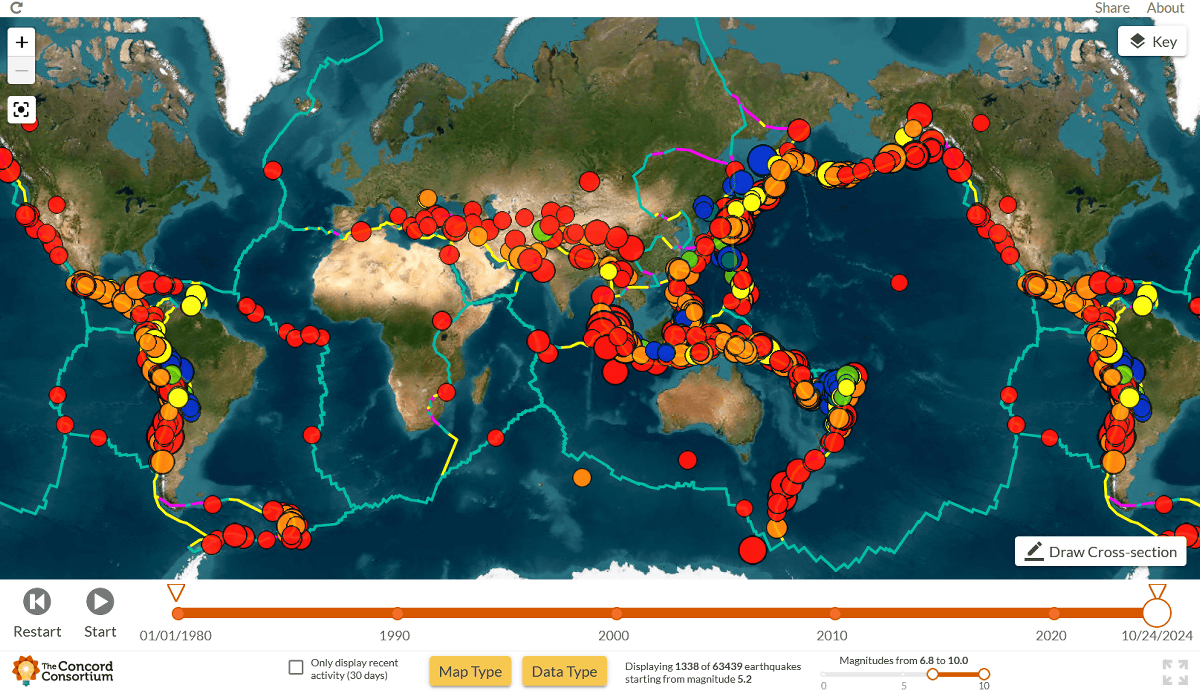
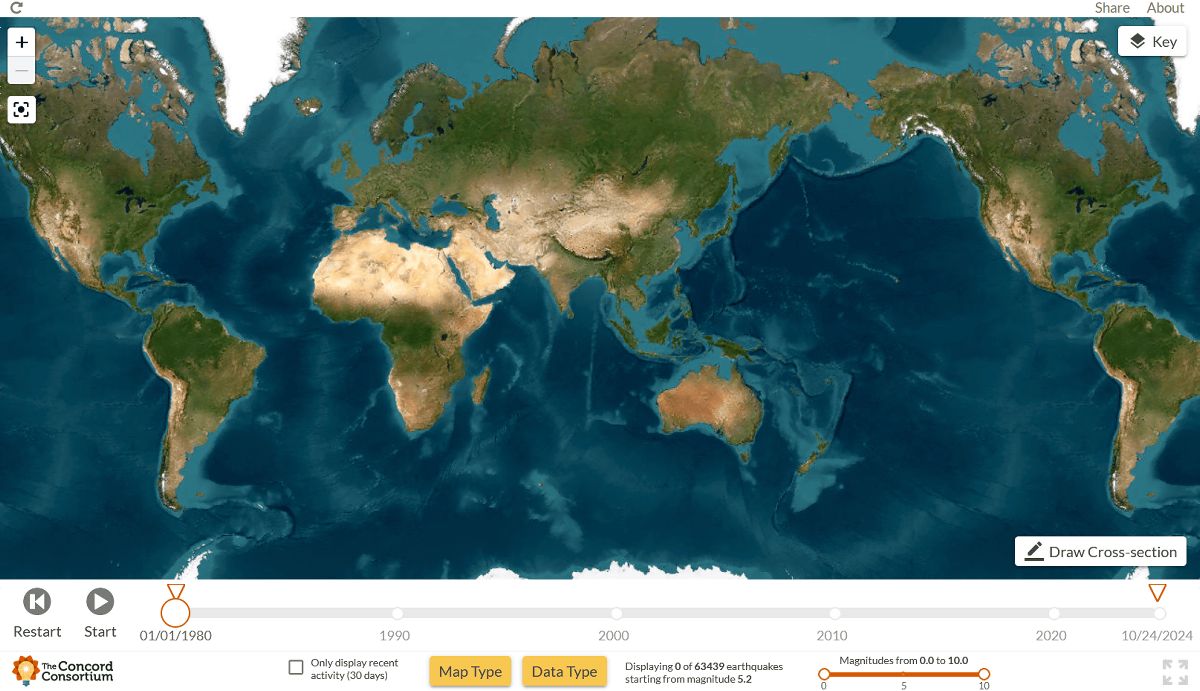
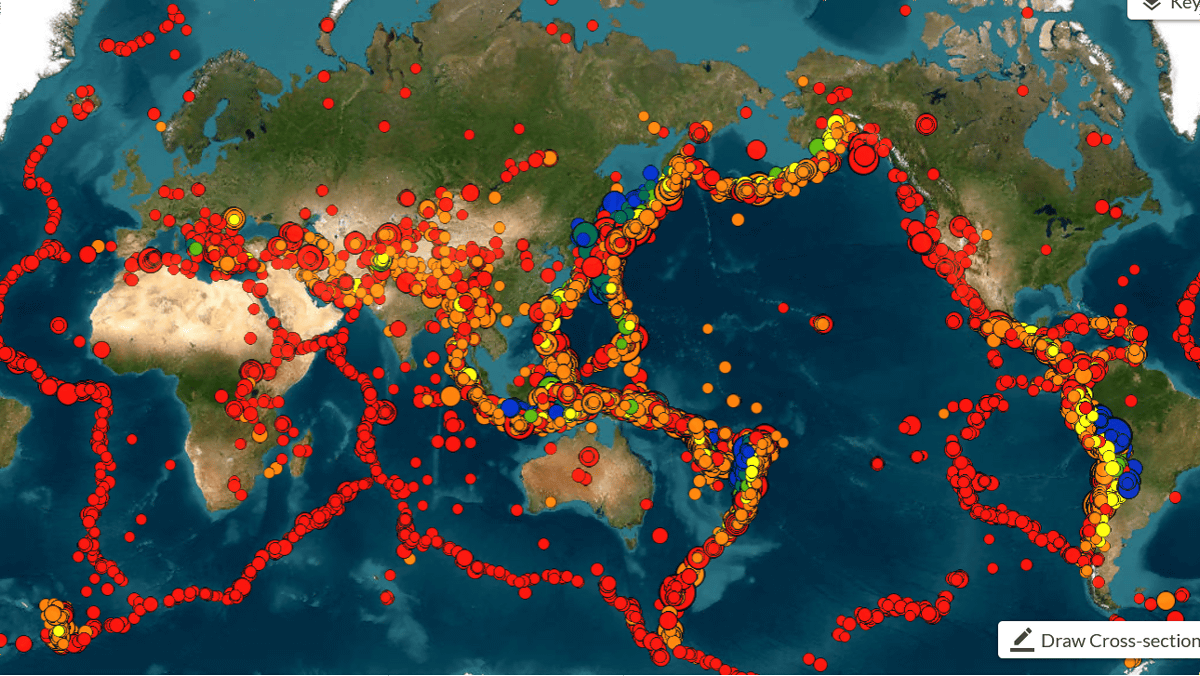
When you access the 'Seismic Explorer' site, you will see a world map like the one below.
Seismic Explorer makes it possible to display earthquakes that have occurred since January 1, 1980 in chronological order on a map. Here's what it looks like when you actually use it:
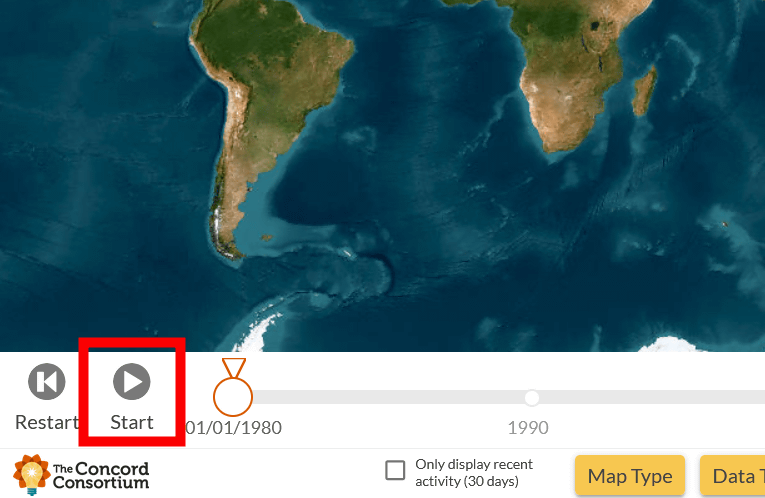
To display earthquakes on a map in chronological order, project the area you want to check and click the 'Start' icon at the bottom left of the screen.
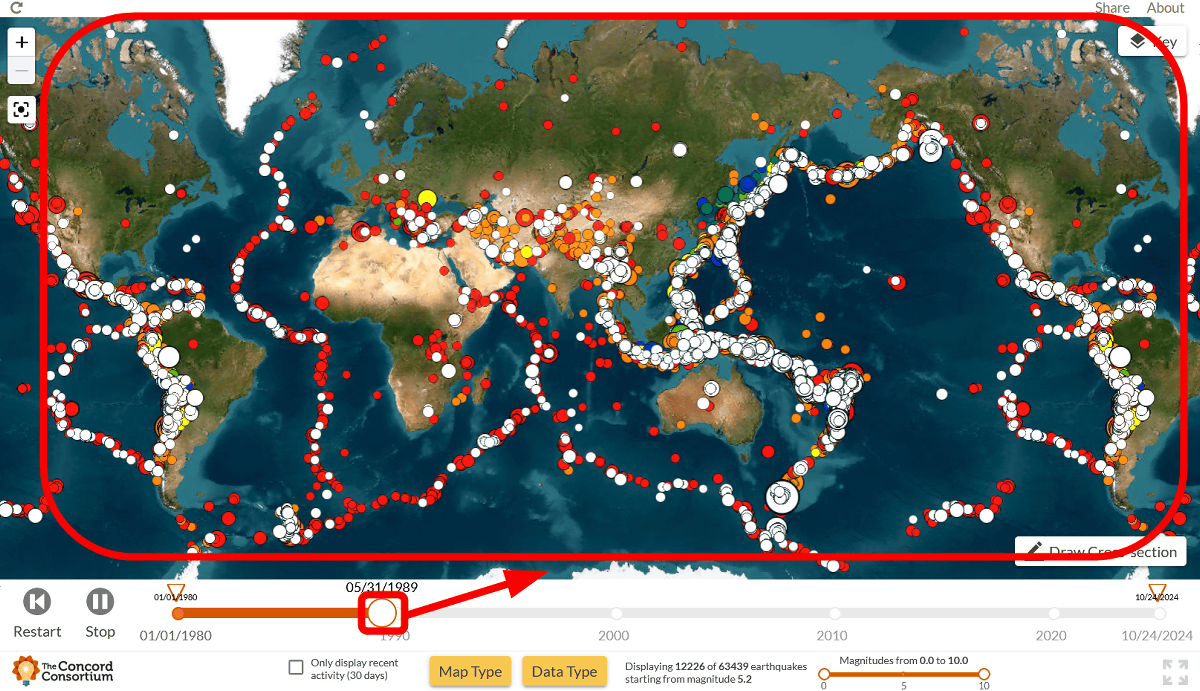
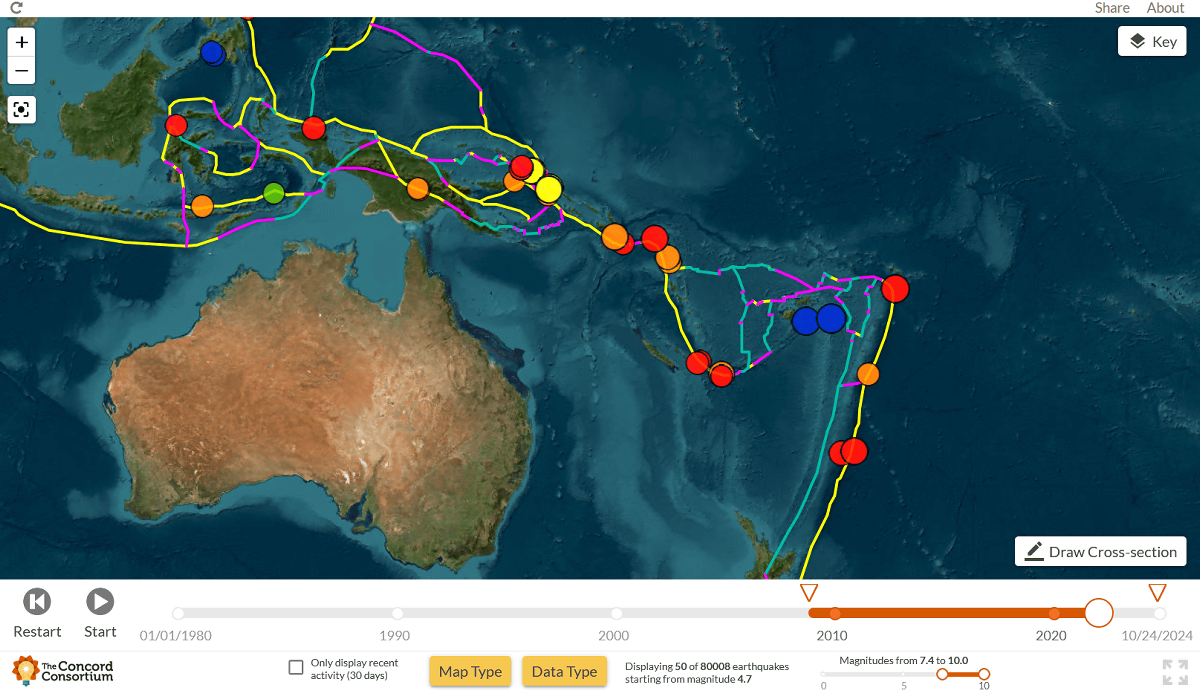
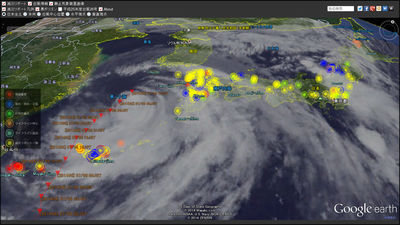
The date bar displayed at the bottom of the screen will then advance, and earthquakes that occurred at that time will be mapped in real time.
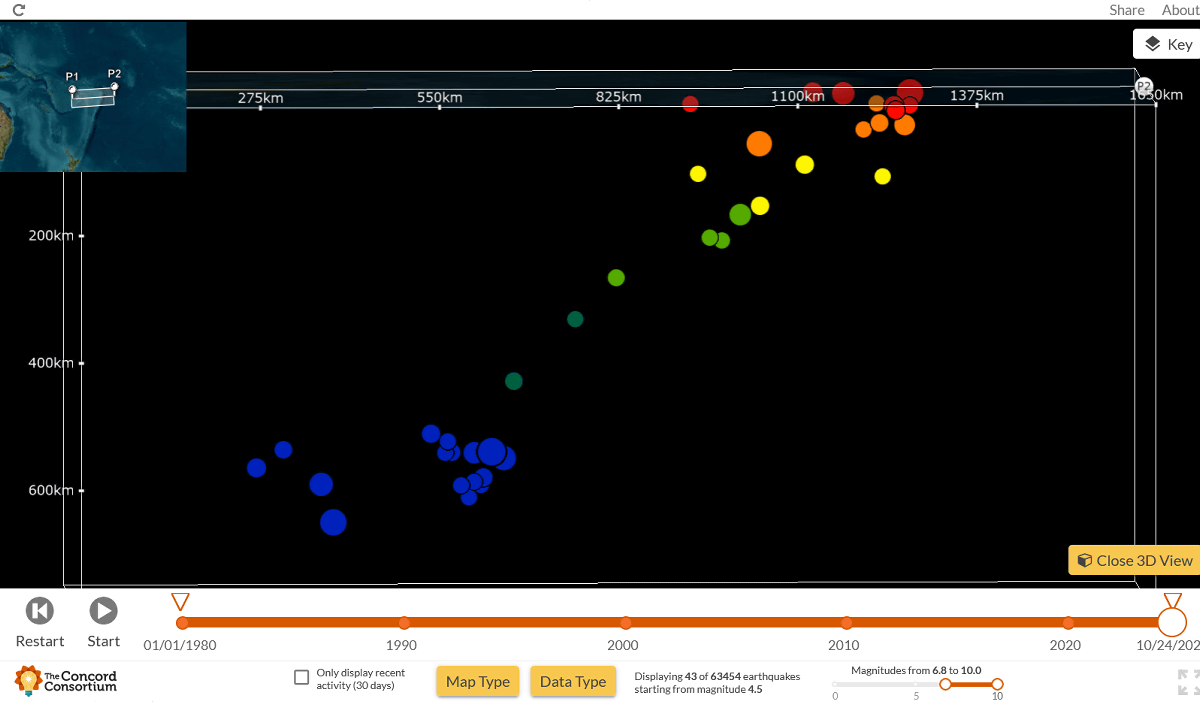
The size of the circle indicates the magnitude of the earthquake, and the color indicates the depth of the epicenter. Red indicates the shallowest epicenter, 10 to 30 km, orange is 30 to 100 km, followed by yellow, yellow-green, dark green, and blue.
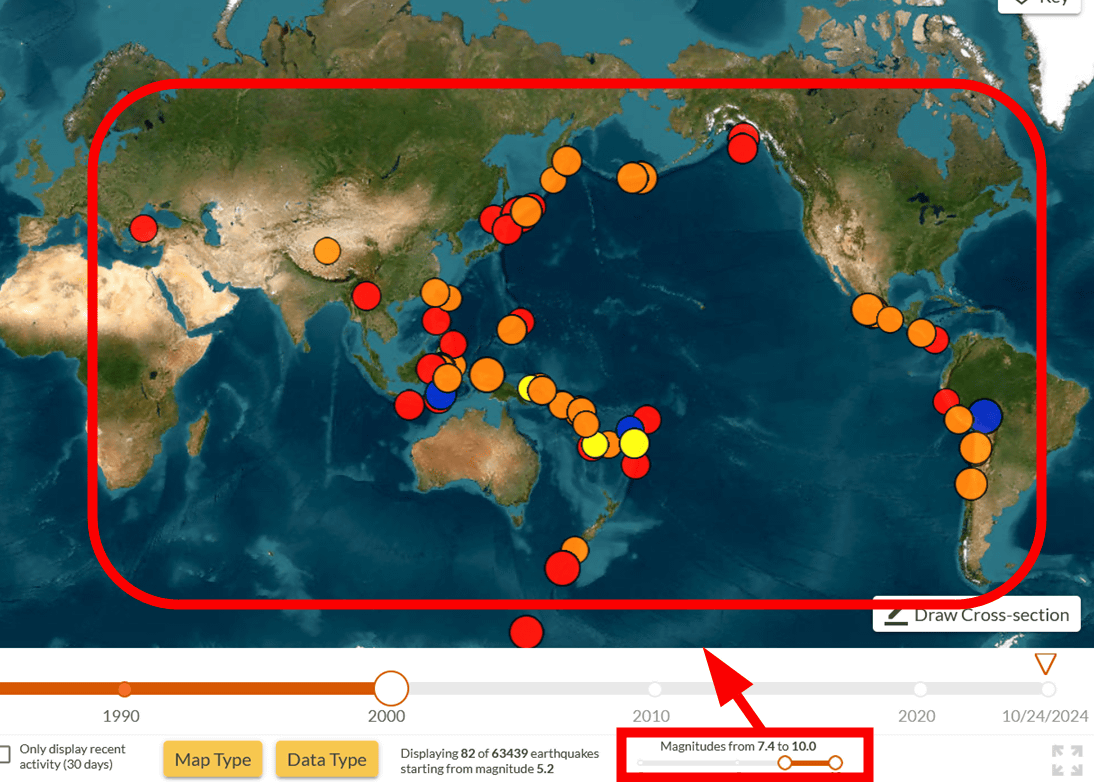
You can also move the slider at the bottom right of the screen to specify a range of magnitudes to display.
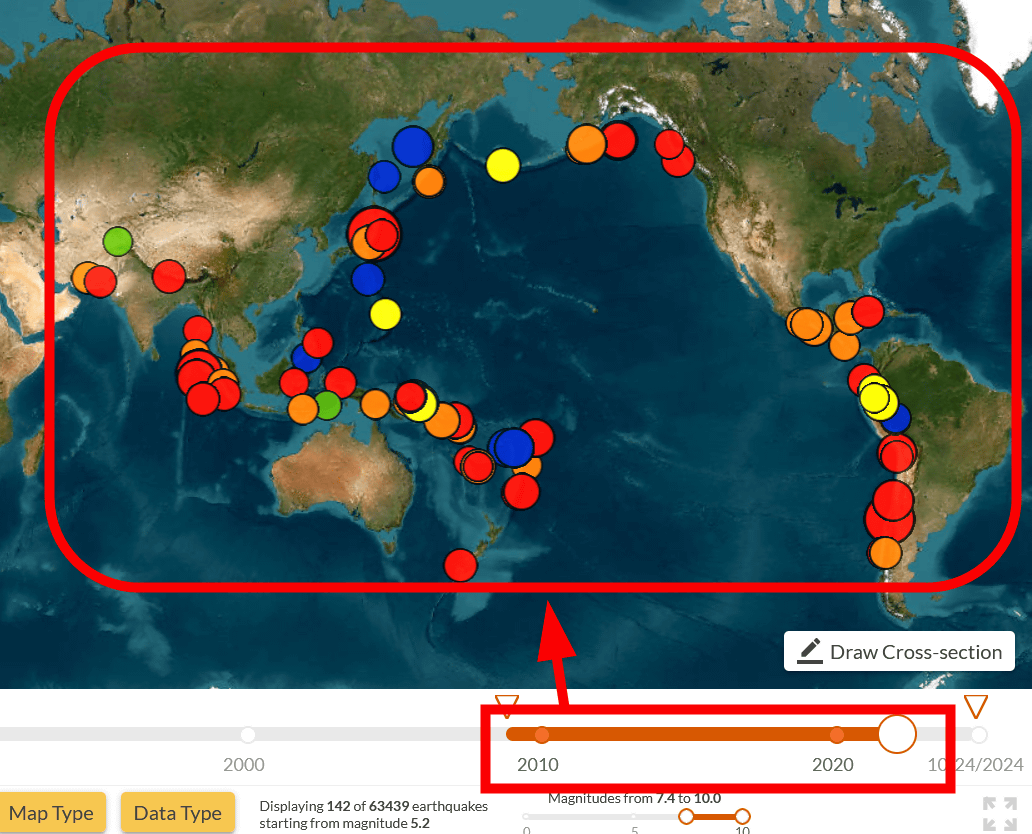
You can also specify the period freely.
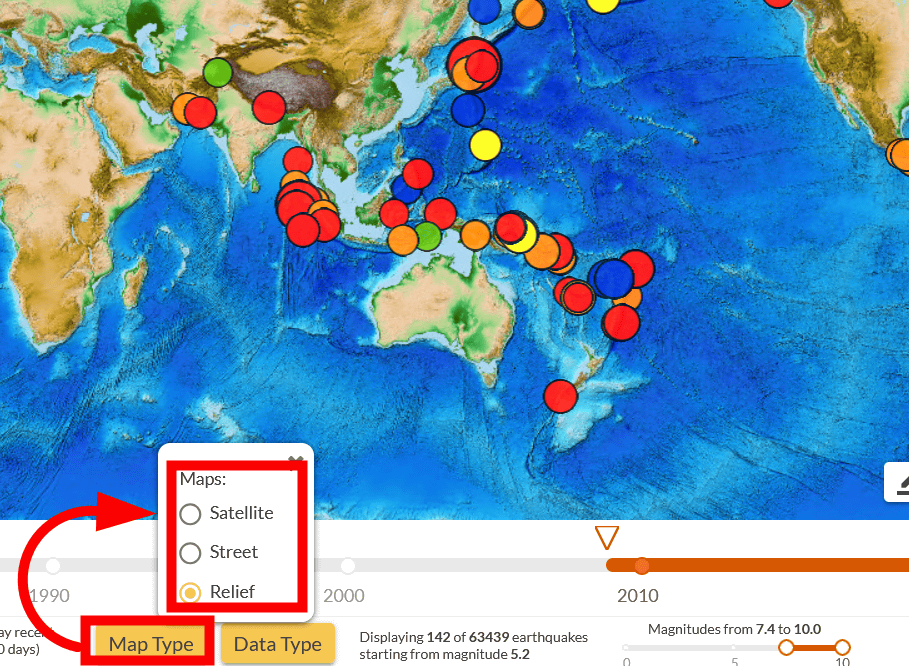
You can change the map style by clicking 'Map Type' at the bottom of the screen.
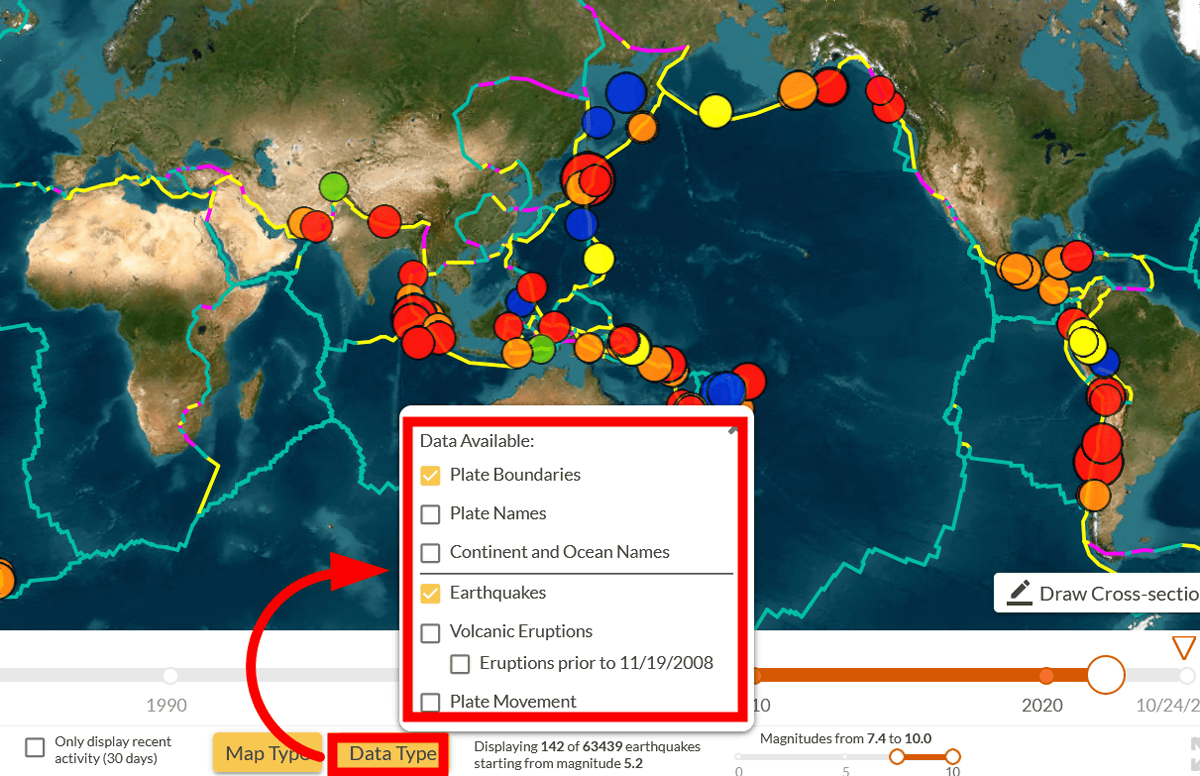
By clicking 'Data Type', you can also overlay plate boundaries on the map and display volcanic eruptions.
Of course, you can zoom in and out on the map to check out specific areas.
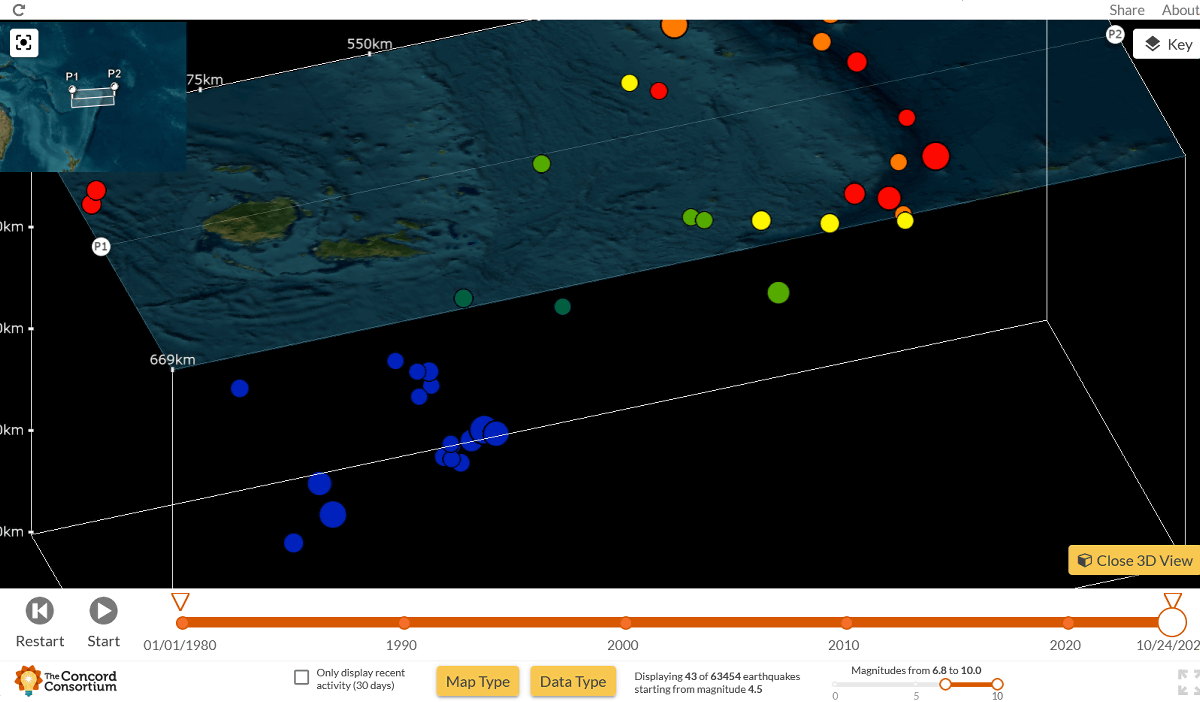
Another feature of Seismic Explorer is that you can extract a specific area and check the epicenter of each earthquake on a 3D map. Below is a look at how the 3D map was actually used.
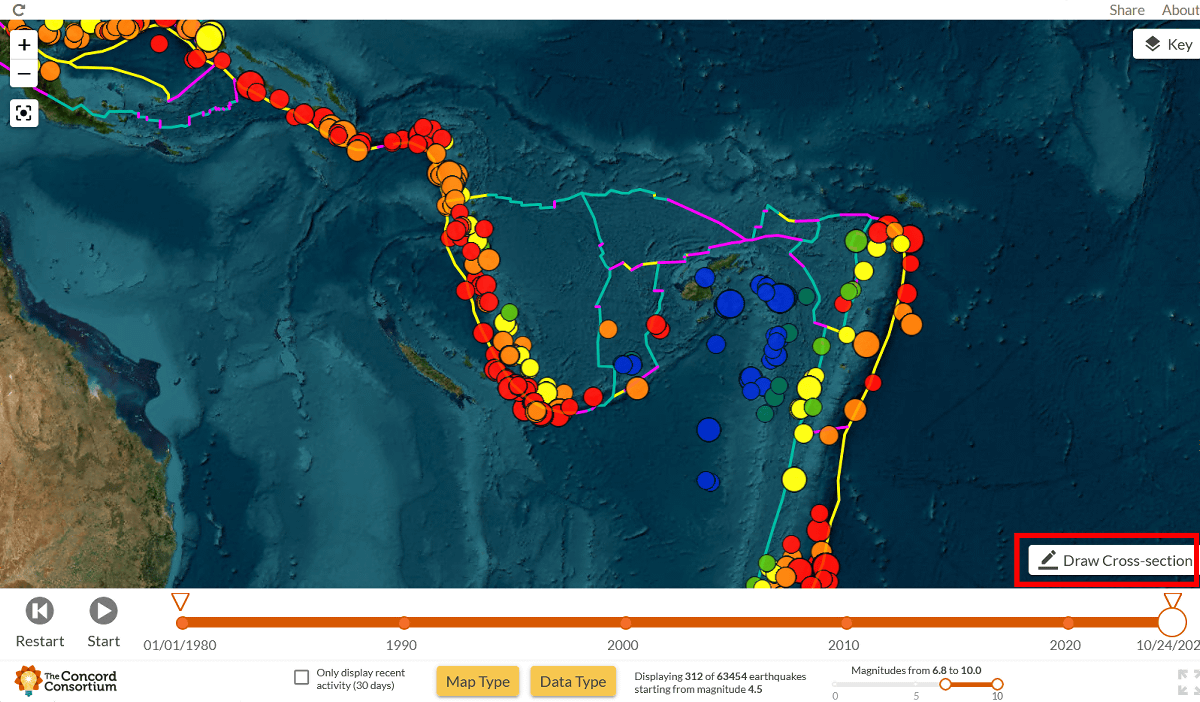
Click 'Draw Cross-section' at the bottom right of the screen.
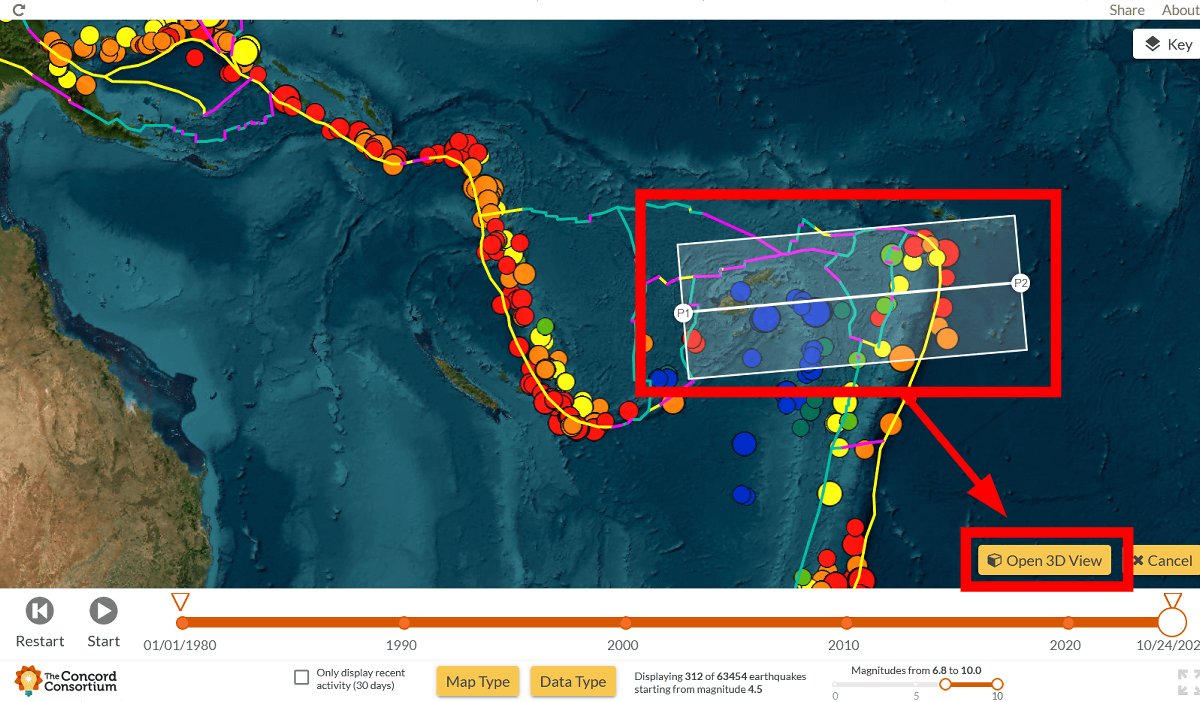
Click and drag to specify the area, then click 'Open 3D View.'
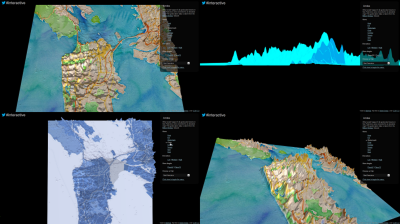
The epicenters of each earthquake were then displayed on a 3D map. This distinctive distribution of epicenters is thought to be related to plate subduction and other factors.
You can move the 3D map around to view it from different angles.
Seismic Explorer was a useful web service for analyzing patterns such as the magnitude, depth, location, and frequency of earthquakes around the world. The earthquake data being mapped is said to be published by the United States Geological Survey.
Related Posts:

in Video, Web Service, Review, Posted by log1h_ik