Techniques you can use when debugging on the browser
When you run JavaScript on the web and encounter a bug, you often use the browser's built-in developer tools to debug it. Alan Norbauer, who is involved in front-end development at Netflix, has summarized techniques that are useful for debugging with such browsers.
67 Weird Debugging Tricks Your Browser Doesn't Want You to Know | Alan Norbauer
◆Advanced conditional breakpoints
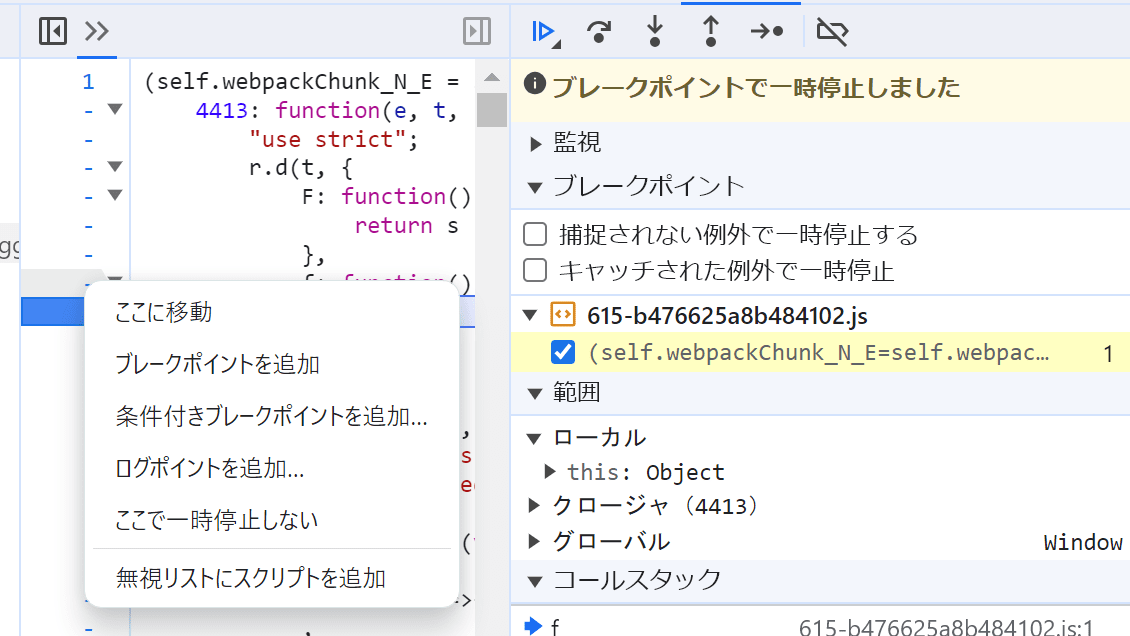
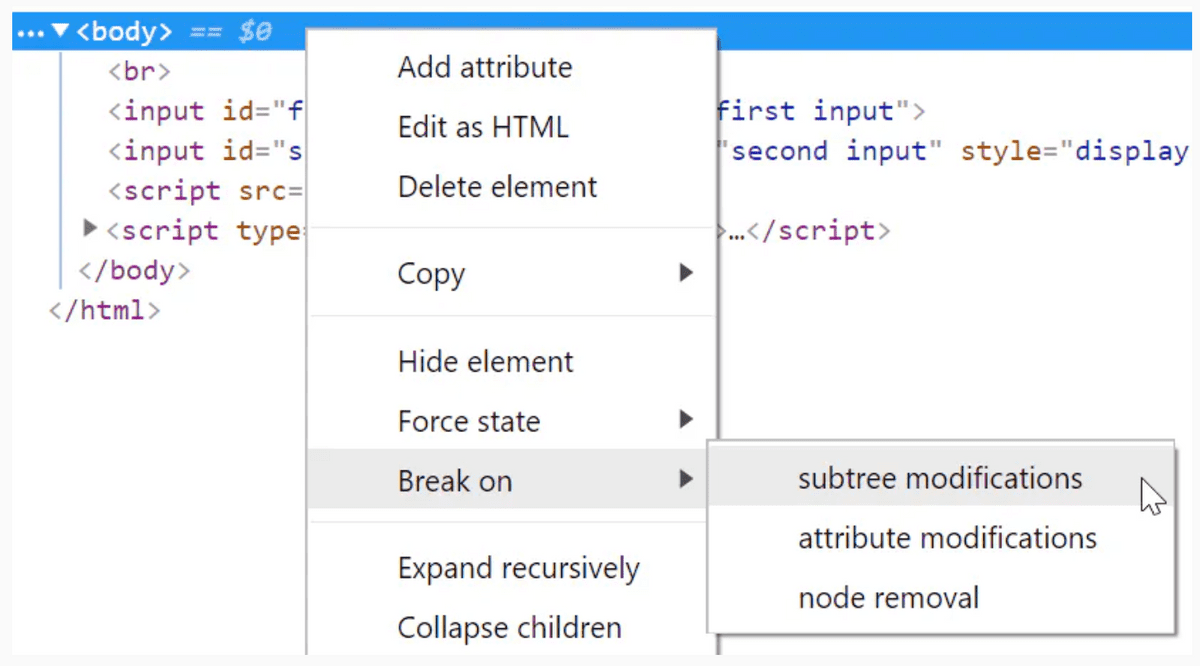
The Source tab of the developer tools provides a debugger that allows you to pause execution and examine variables and the contents of the call stack by setting breakpoints on any line of JavaScript. If you right-click when setting a breakpoint, a menu like the one shown below will appear, allowing you to add conditional breakpoints and log points in addition to regular breakpoints. How to use these functions is as follows.
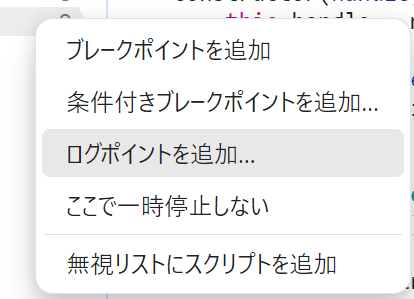
・Log point ・Trace point
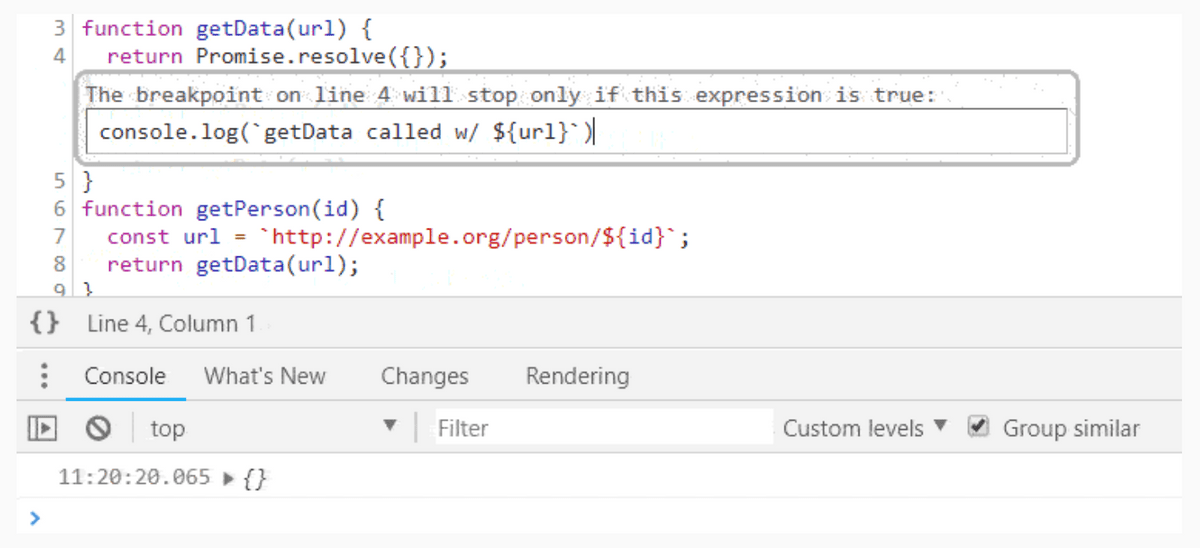
Logpoint is a feature that outputs variables and text set inside to the console without pausing, and is included as a standard feature in many browser developer tools. Additionally, even in browsers that do not support logpoints, you can use conditional breakpoints to achieve the same behavior as logpoints.
・Monitoring panel
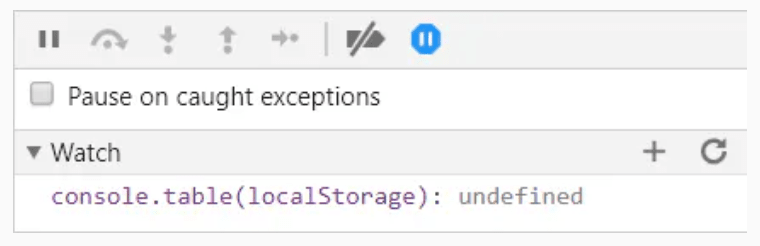
You can set up a console.log in the Monitor panel, and you can also have the contents of certain variables output every time the debugger pauses.
If you want to pause when there is a change in the DOM, you can set it from the Elements panel.
You can save the DOM state using code like the one below.
[code](window.doms = window.doms || []).push(document.documentElement.outerHTML)[/code]
・Call stack tracing
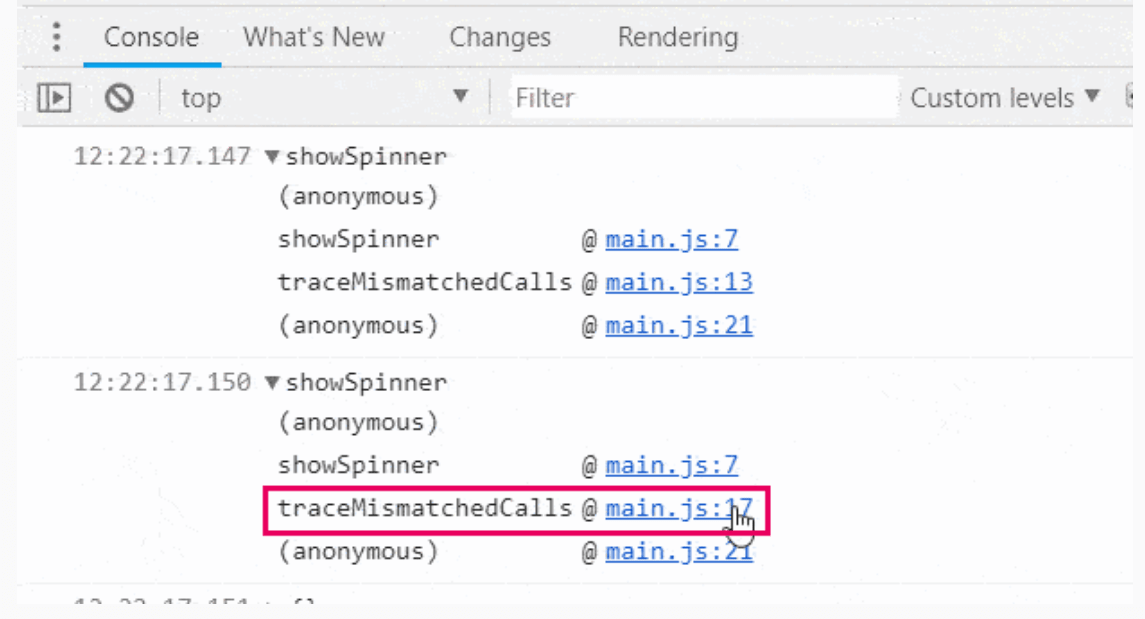
For example, if you have a function that displays the load spinner and a function that hides it, and you accidentally display it twice somewhere, you may want to investigate where it is being called from. In that case, you can set 'console.trace' to the log point.
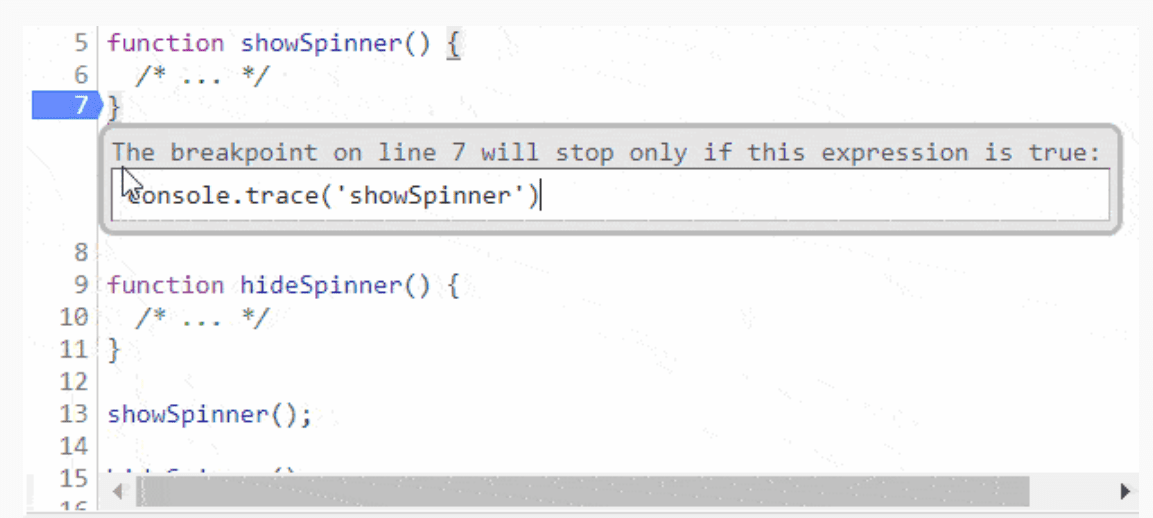
Every time you pass a log point, the caller is displayed on the console, so you can see in one shot where the call came from.
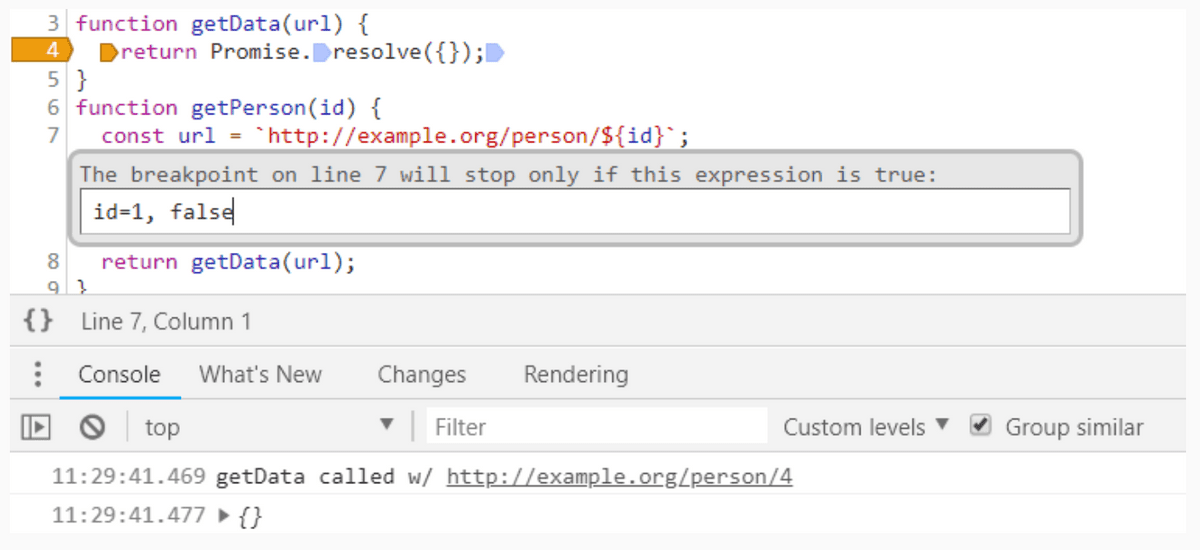
・Change program behavior
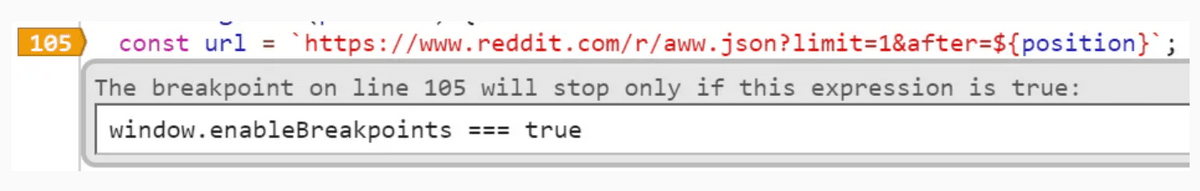
You can change the behavior of your program by entering expressions that have side effects into conditional breakpoints. If the content is an expression that evaluates to 'true', the program will pause at that point, so if you don't want it to stop, just connect it with ', false' at the end.
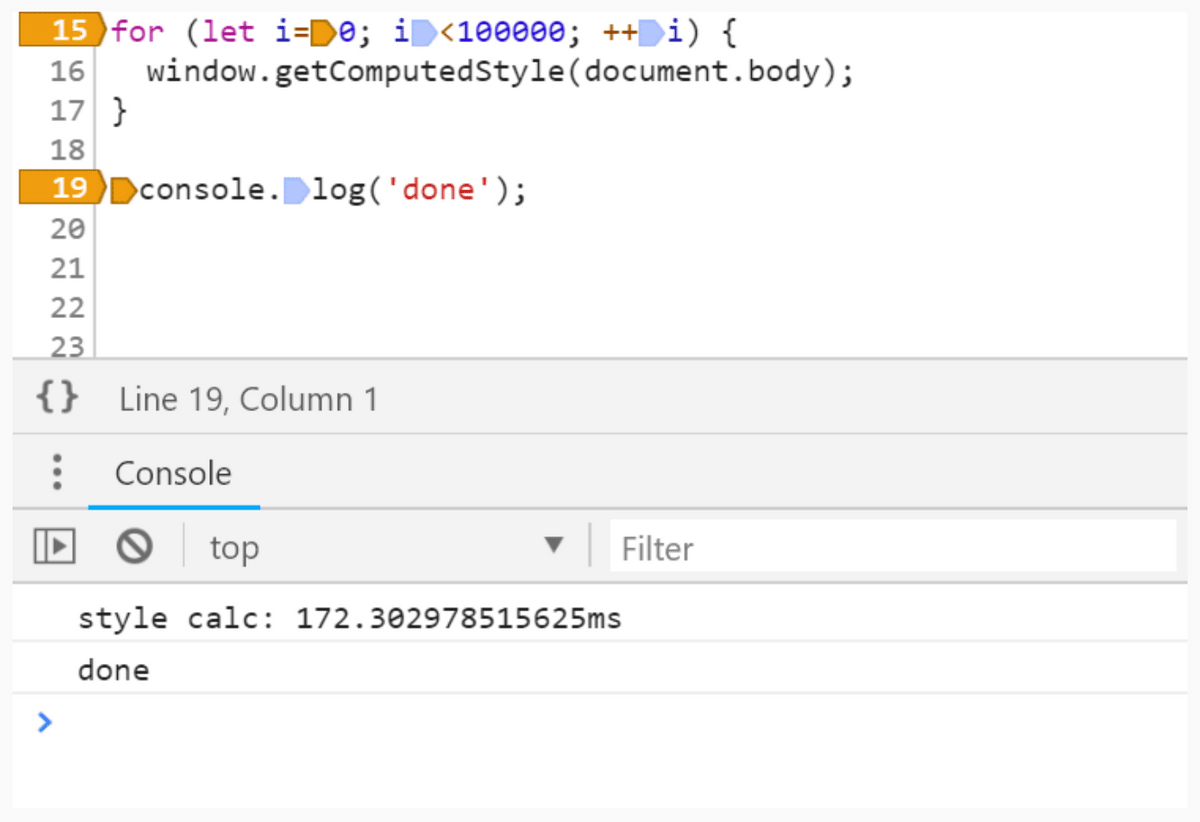
・Rapid performance measurement
By setting 'console.time('label')' at the beginning of the range you want to measure and 'console.timeEnd('label')' at the end of the range you want to measure, you can easily execute that part. You can measure time.
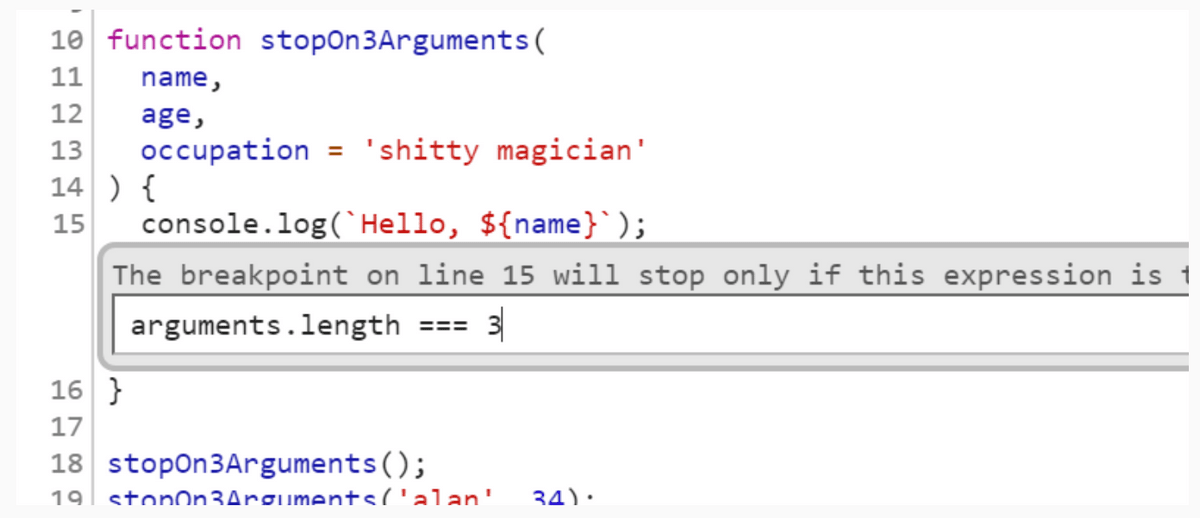
・Break depending on the number of arguments
You can use '
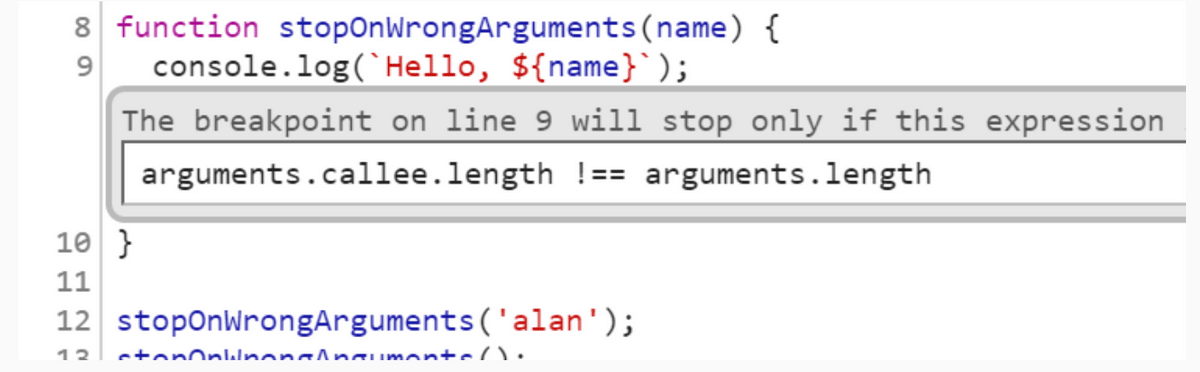
You can also pause only if the number of arguments is invalid by comparing with 'arguments.callee'.
・Make time a condition
By using '
Also, by setting as below, you can prevent the program from pausing at the same breakpoint for 5 seconds after passing that breakpoint.
[code]window.baseline = window.baseline || Date.now(), (Date.now() - window.baseline) > 5000[/code]
・Use CSS
It is possible to pause based on the calculated CSS value. For example, the code below will pause only if the background color of the body is red.
[code]window.getComputedStyle(document.body).backgroundColor === 'rgb(255,0,0)'[/code]
・Pause only for a specific number of times
You can count it using a global variable.
[code]window.counter = window.counter || 0, window.counter % 2 === 0[/code]
·sampling
By using 'Math.random()' it is possible to pause only with a certain probability.
[code]Math.random() < 0.1[/code]
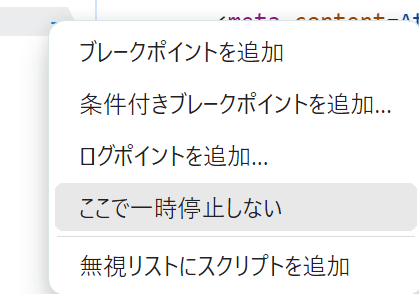
・Do not pause
By setting 'Do not pause here', you can prevent a pause from occurring at that line. Useful for disabling XHR breakpoints that pause on certain types of Ajax or ignoring exceptions.
・Automatically collect instances
You can collect the generated instances by placing the following conditional breakpoint in the constructor.
[code](window.instances = window.instances || []).push(this)[/code]
・Batch management of multiple breakpoints
You can manage the on/off of multiple breakpoints at once using a Bool type global variable. To switch on/off, you can set it manually from the console or set it with other conditional breakpoints.
◆Use of monitor
Chrome has a built-in 'monitor()' command. By passing a function to the monitor command, output will be sent to the console when that function is called.
For example, if you want to know the calls for all instances of the class 'Dog', just enter the following into the console.
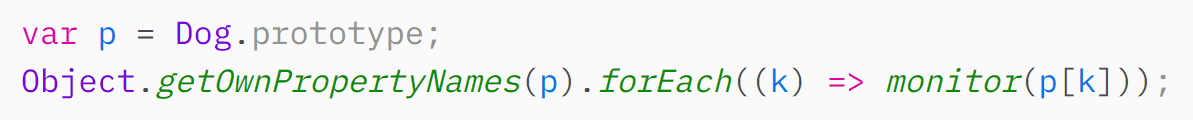
When Dog's 'bark' method is called, the following will be output to the console. If you want to pause during output, use 'debug' instead of 'monitor'.
[code]function bark called with arguments: 2[/code]
Also, if the instance is found but the class is unknown, you can achieve the same behavior with the code below.

◆Function call
For example, if you want to debug the function 'fn()', you can step through it from the beginning by calling 'debugger' as shown below before calling it on the console. Unlike breakpoints, you can run it even if you don't know where the source of the function is.
[code]debugger; fn(1);[/code]
In addition, in the case of Chrome, if you enter 'debug(fn)' in the console, it will automatically pause when the fn function is called and start step execution.
◆Pause when changing URL
To pause a single page application before changing the URL, enter the code below into the console.
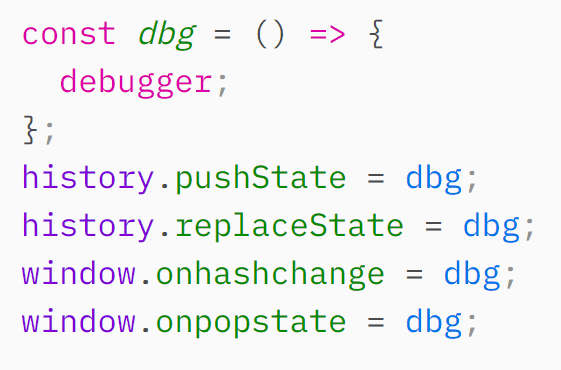
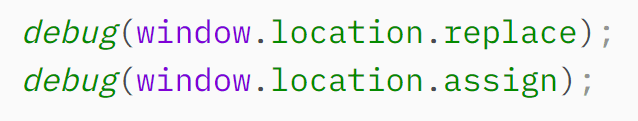
Please note that if the app calls 'window.location.replace/assign' directly, the above code will not work because the page will be unloaded immediately. Since the page is unloaded, there will be nothing to debug, but if you still want to pause, register both functions in Chrome's debug.
◆Debug property reading
If you want to pause when an object's properties are read, add
◆Use copy()
By using the console API's 'copy()', you can import information directly to the clipboard without truncating the string. Examples of usage are listed below.
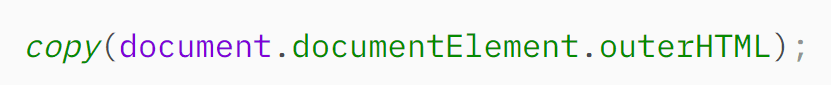
A snapshot of the current DOM
[code]copy(document.documentElement.outerHTML)[/code]
Metadata about resources
[code]copy(performance.getEntriesByType('resource'))[/code]
Blob in large JSON format
[code]copy(JSON.parse(blob))[/code]
dump localStorage
[code]copy(localStorage)[/code]
◆HTML and CSS debugging
・Stop JavaScript
You can pause JavaScript by pressing 'Ctrl + \' or F8 key in the source panel. By stopping JavaScript, you can check the elements without worrying about JavaScript changing the DOM.
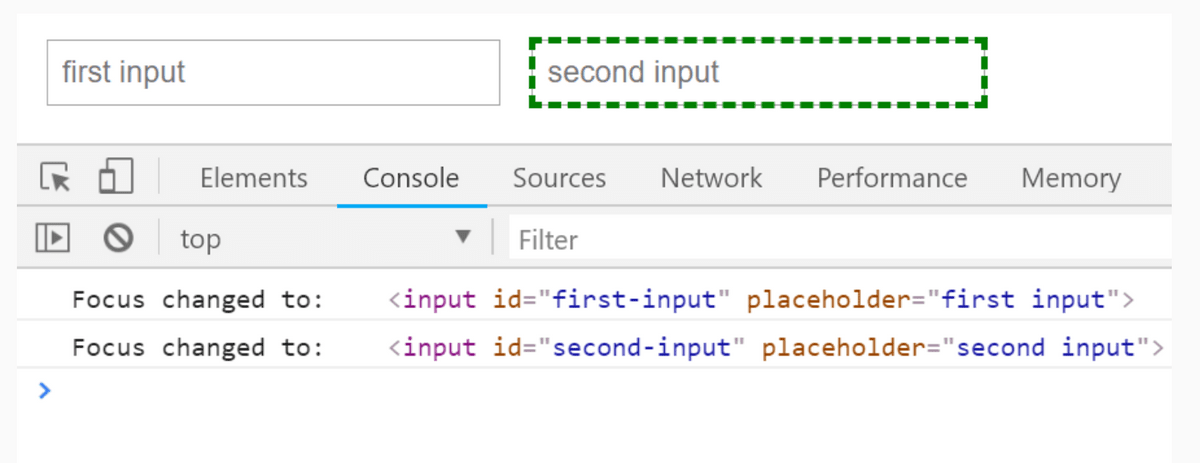
・Inspect elements that appear only in a specific state
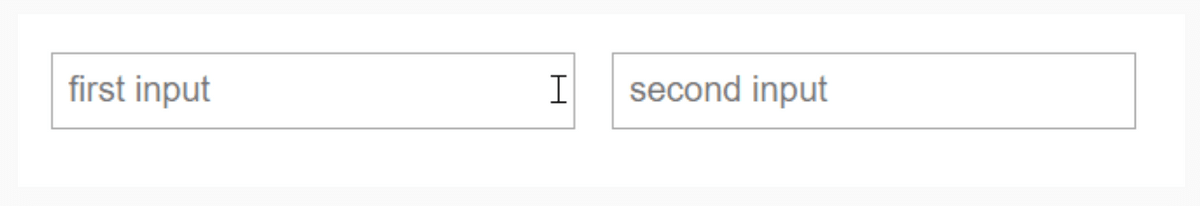
For example, consider a page where 'second input' appears only when the cursor is placed on 'first input', as shown in the image below.
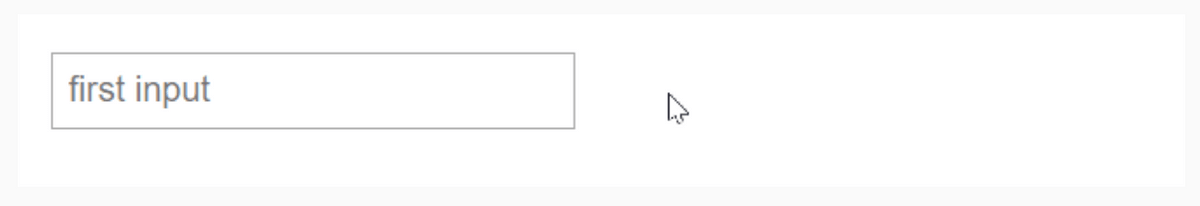
To inspect an element, you need to place the cursor on the element you want to inspect, and you cannot inspect 'second input' as it is.
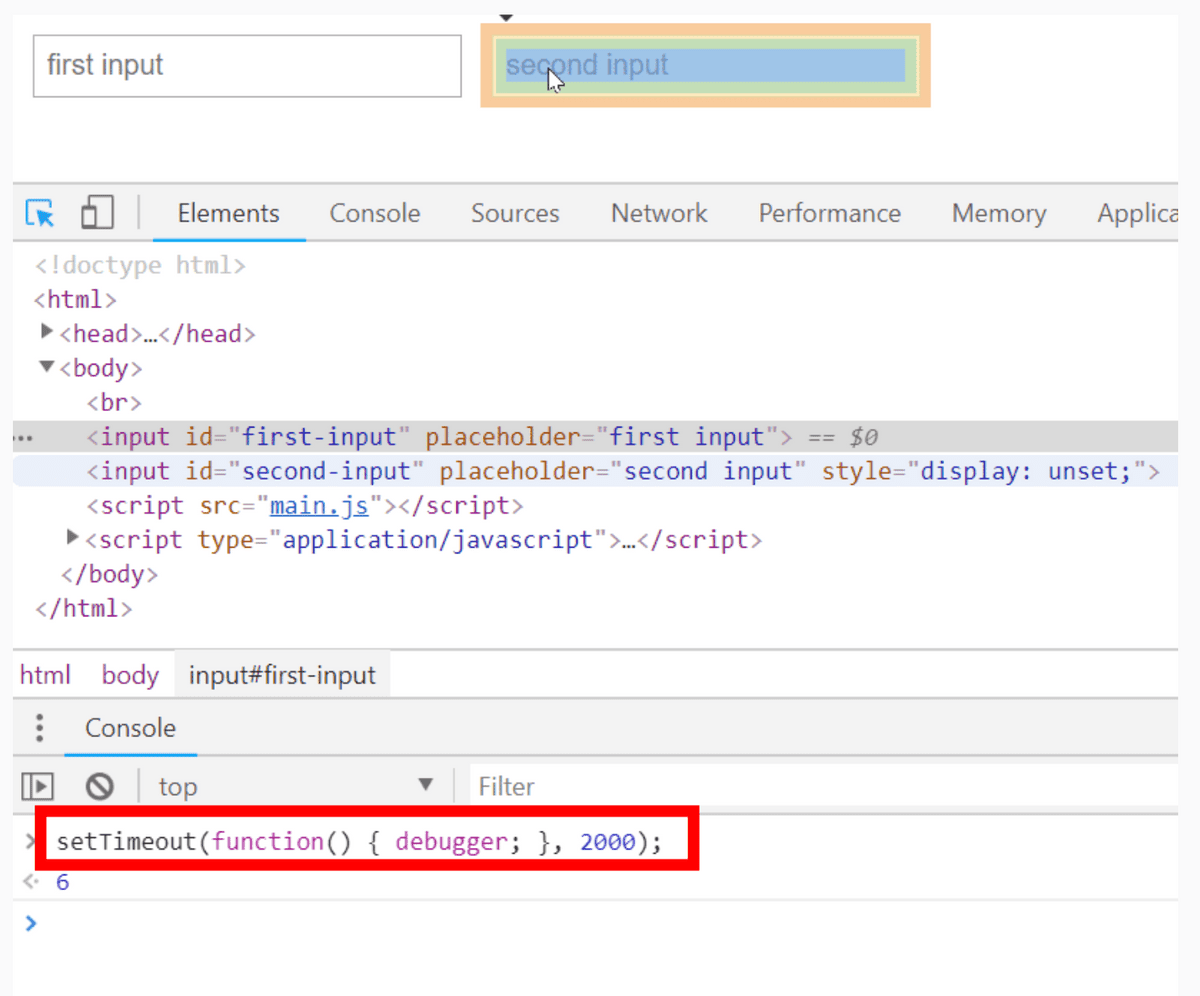
By combining 'setTimeout()', which executes code after a certain amount of time, with a debugger, you can stop JavaScript execution with the cursor placed on 'first input'. Now we can inspect the second input.
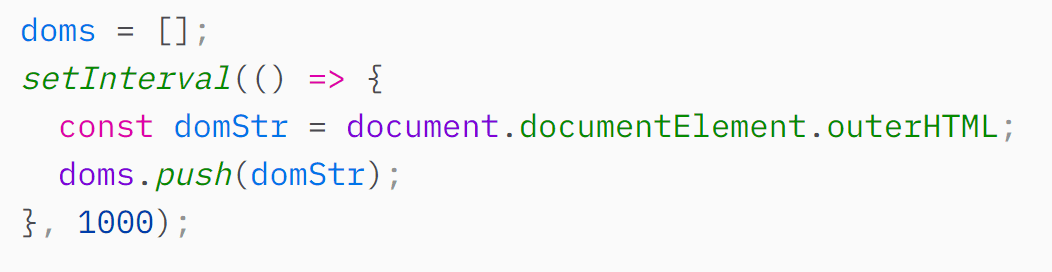
・Record a snapshot of the DOM
As mentioned in the section on using copy, you can copy the entire DOM to the clipboard using the command below.
You can take and save a DOM snapshot every second by doing the following.
・Monitor focus
You can detect activeElement switching using code like the one below.
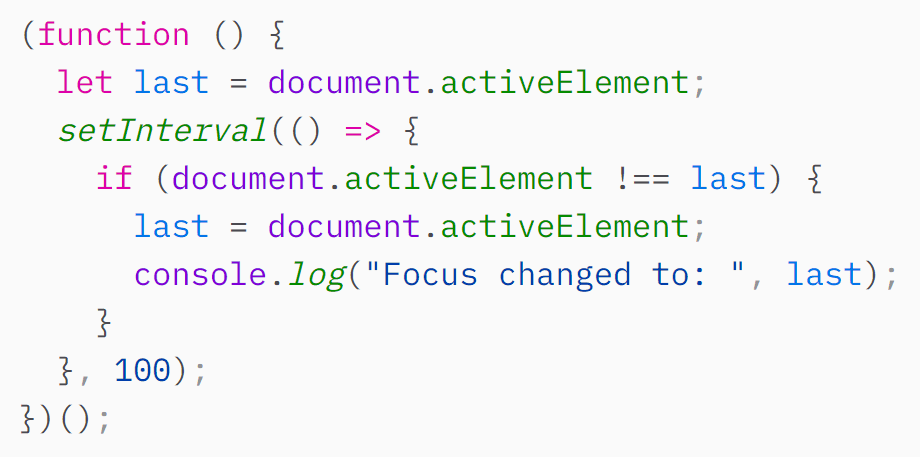
You can print an element to the console whenever focus changes.
・Search based on CSS
By using 'document.querySelectorAll('*')' you can get all the elements, and by using '
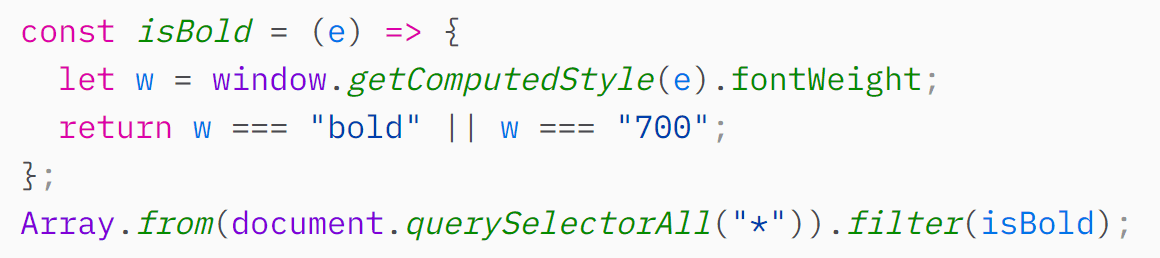
If you use '$0' instead of 'document', you can search only the descendants of the element currently specified in the inspector.

・Get the selected element
You can specify the selected element in the inspector by using '$0' in the console. In Chrome and Edge, you can also use '$1' and '$2' to specify the previous selected element and the second selected element, respectively.
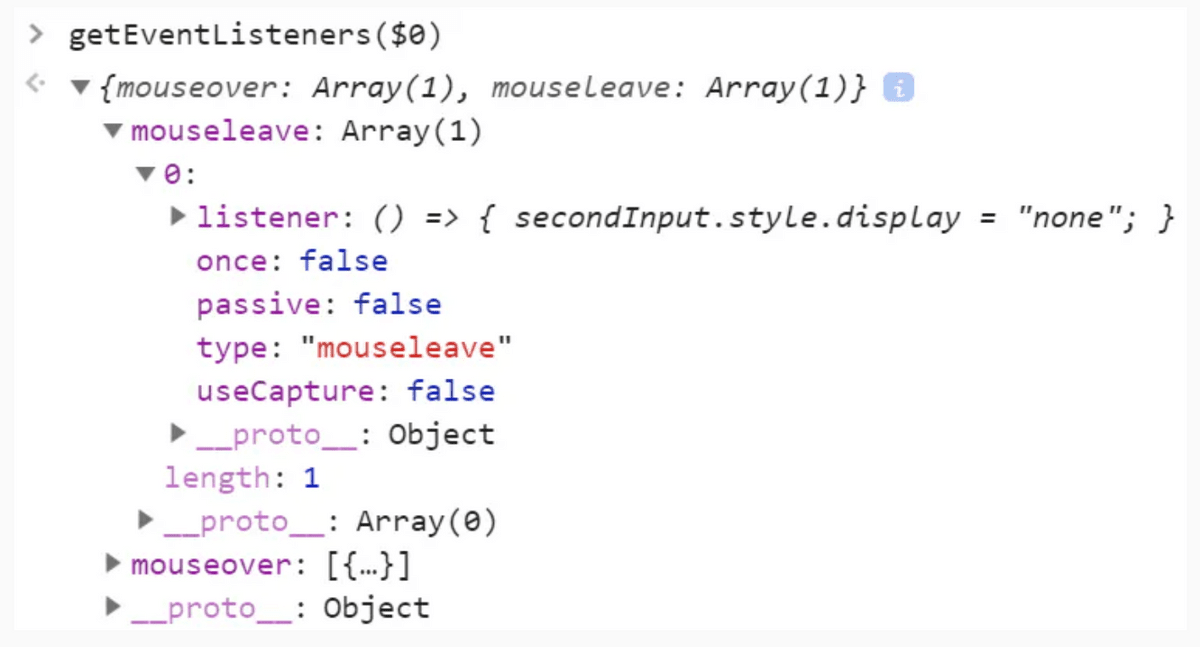
・Get event listener
In Chrome, you can use 'getEventListeners()' to get the event listeners set for an element.
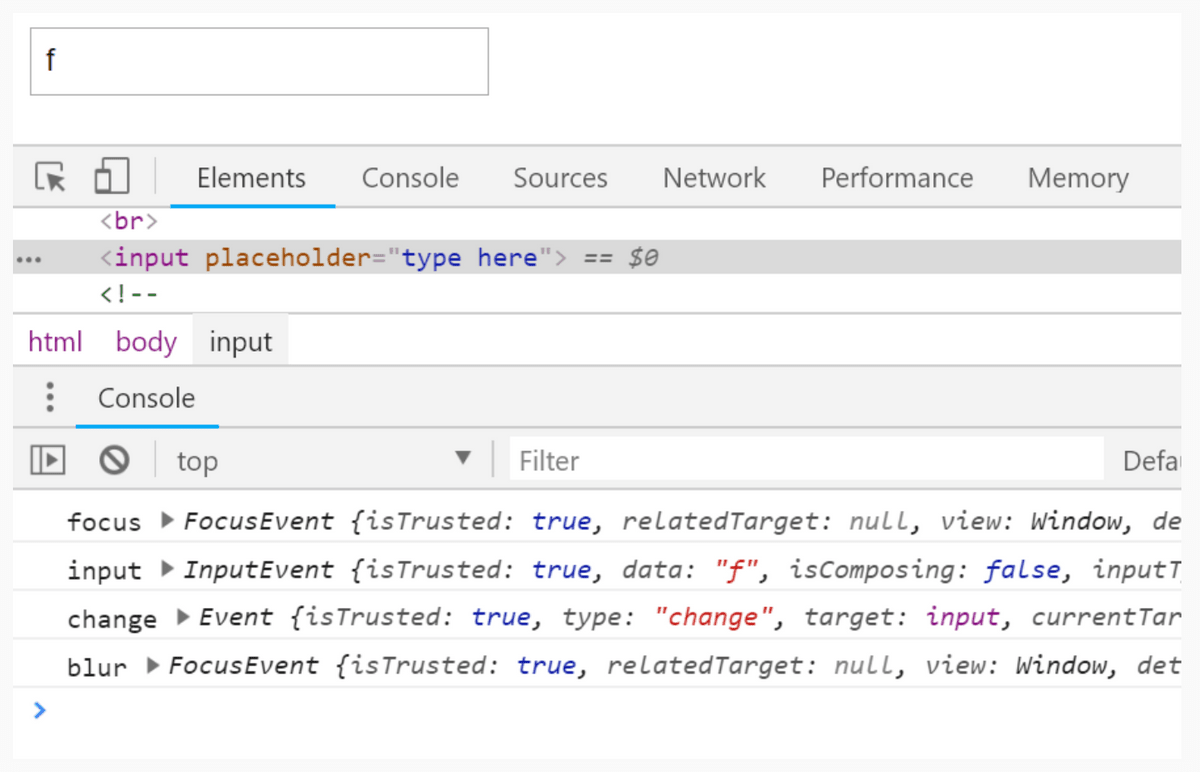
・Monitor events
In Chrome, you can capture events that occur on that element by entering the command 'monitorEvent($0)'. It is also possible to capture only a specific event by specifying something like 'monitorEvent($0, ['control', 'key'])'.
◆Forum now open
A forum related to this article has been set up on the GIGAZINE official Discord server . Anyone can write freely, so please feel free to comment! If you do not have a Discord account, please create one by referring to the article explaining how to create an account!
• Discord | 'Which browser debugging tool do you mainly use?' | GIGAZINE
https://discord.com/channels/1037961069903216680/1176083336695918672
Related Posts:


in Software, Web Application, Posted by log1d_ts