I analyzed the results of the GIGAZINE reader survey using Metabase, an open source self-hosted application that allows you to visualize large amounts of data for free in easy-to-read graphs.
Metabase is an open source and self-hosted data visualization tool. Since I was able to confirm how to use it in
The setup and features of Metabase are explained in detail in the article below.
I tried using ``Metabase'', an open source self-hosted app that automatically visualizes a large amount of data for free in easy-to-read graphs and other forms, and creates a regularly updated dashboard - GIGAZINE
Set up PostgreSQL to read GIGAZINE survey results. Since we will continue to use Docker as we did last time, start PostgreSQL with the command below. Please change the 'password' and 'path to directory' as appropriate.
[code]docker run --name metabase-postgres -e POSTGRES_PASSWORD=[password] -p 5432:5432 -v [path to directory where survey results are saved]:/mnt/surveydata -d postgres[/code]
Connect to the PostgreSQL Docker image with the command below.
[code]docker exec -it metabase-postgres bash[/code]
Connect to PostgreSQL with the command below.
[code]psql -h localhost -U postgres[/code]
First, create a database for Metabase using the command below. By connecting Metabase to the database, data such as dashboards will be maintained even if the Metabase Docker image is deleted.
[code]CREATE DATABASE metabaseappdb;[/code]
Next, create a database named 'gigazine' to save the survey results.
[code]CREATE DATABASE gigazine;[/code]
Connect to the database you created.
[code]\c gigazine;[/code]
Create a table based on survey items. This time, I created a table with the name 'Survey'.
[code]CREATE TABLE survey
('Please enter your email address.' varchar,
'Please select your gender.' varchar,
'Please select your age.' varchar,
...(omitted)...
'UTM campaign details' varchar);[/code]
Import the data into the table created using the command below. This completes the work within PostgreSQL, so use the 'exit;' command to disconnect from PostgreSQL.
[code]\copy survey from '/mnt/surveydata/survey.csv' delimiter ',' csv header;[/code]
Next, start the Metabase Docker image with the following command. In order to connect Metabase to the database, various settings must be set in environment variables.
[code]docker run -d -p 3000:3000 \
--add-host=host.docker.internal:host-gateway \
-e 'MB_DB_TYPE=postgres' \
-e 'MB_DB_DBNAME=metabaseappdb' \
-e 'MB_DB_PORT=5432' \
-e 'MB_DB_USER=postgres' \
-e 'MB_DB_PASS=[password]' \
-e 'MB_DB_HOST=host.docker.internal' \
--name metabase metabase/metabase[/code]
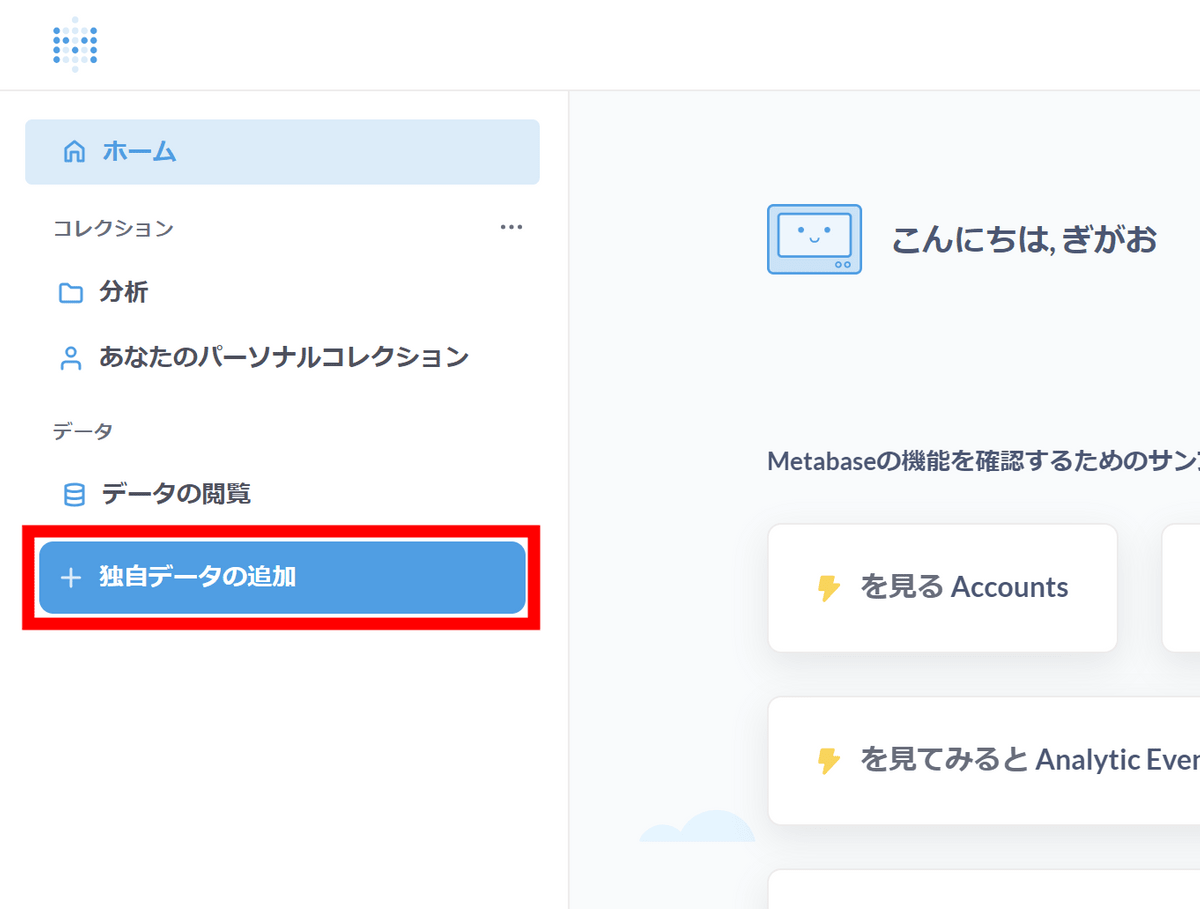
Perform the initial settings of Metabase as detailed in the previous article , and when the app starts, click 'Add unique data' from the menu on the left.
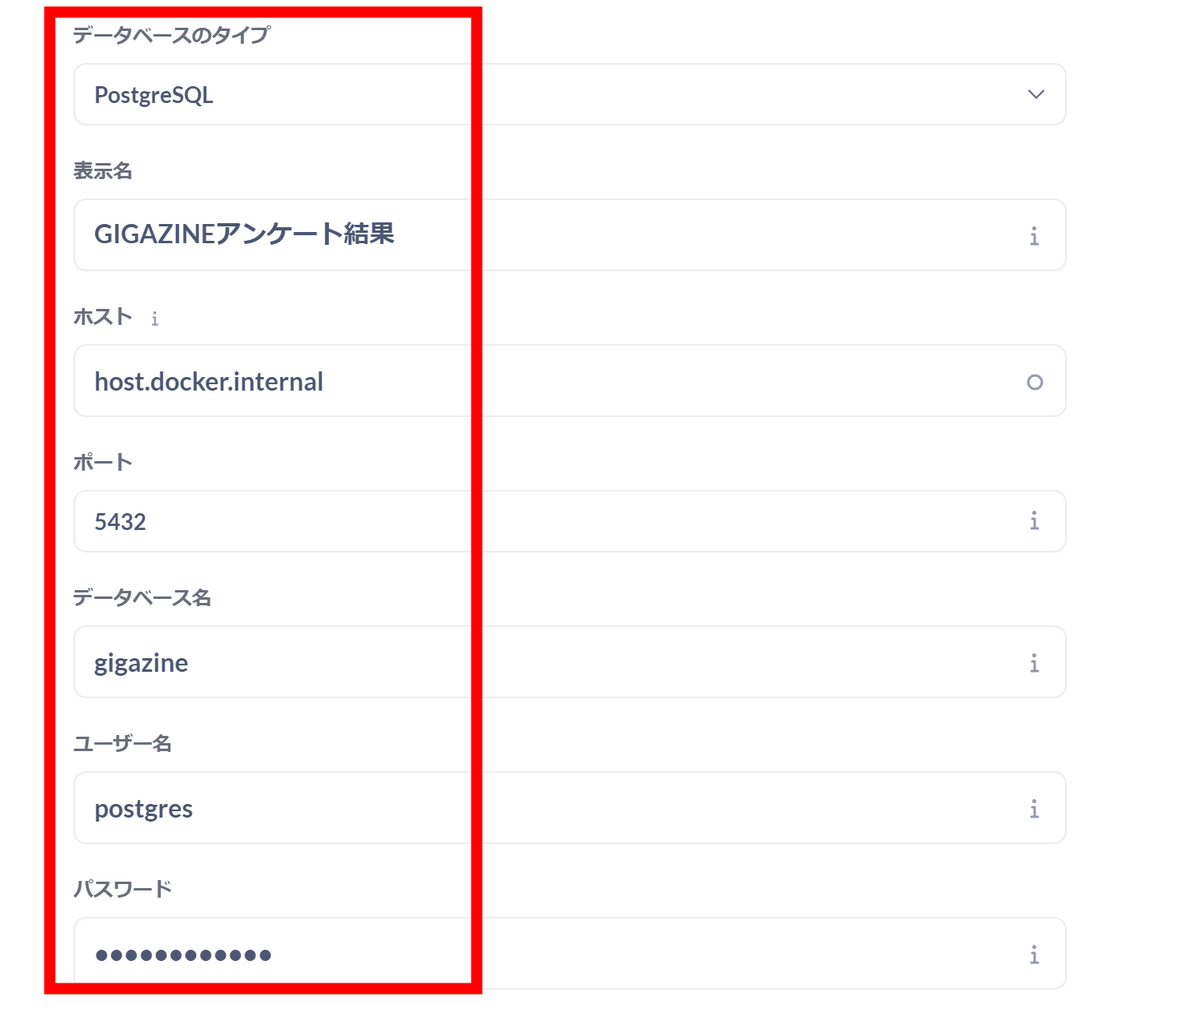
Enter your connection information.
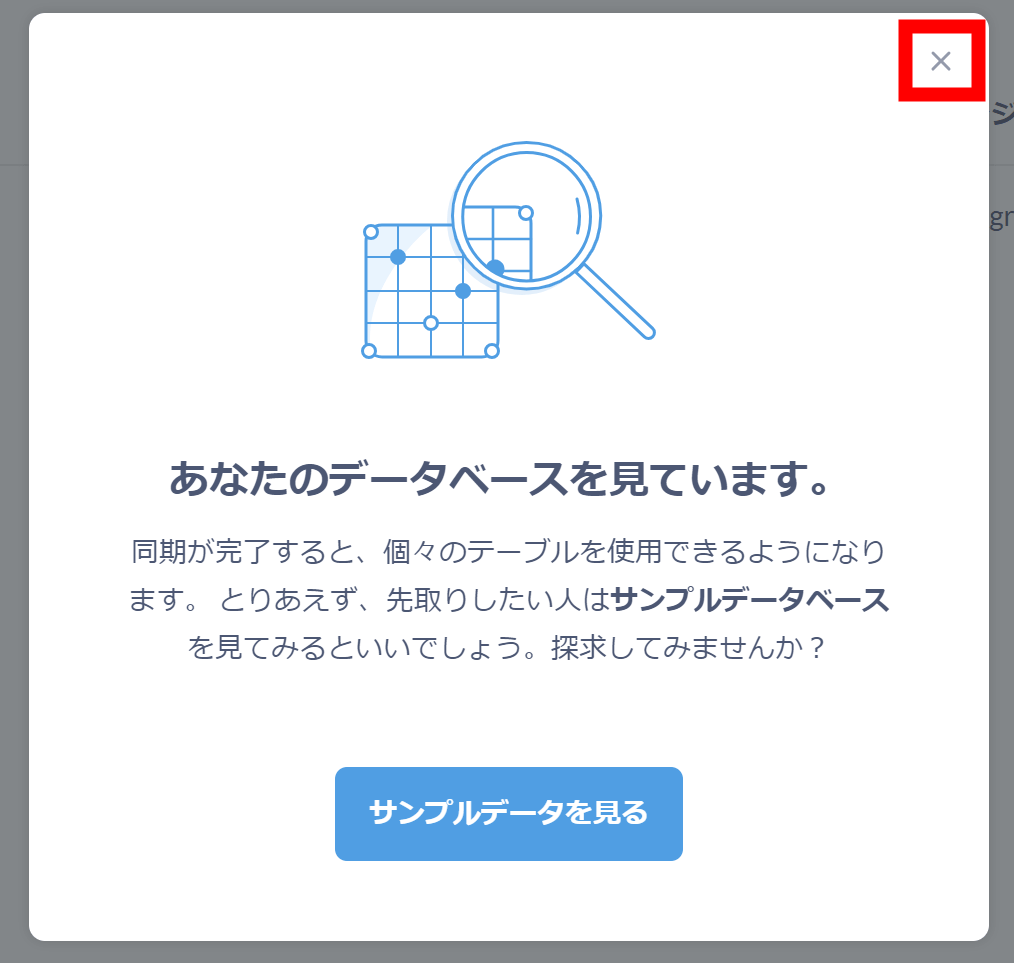
If the connection is successful, synchronization will begin as shown below. Click the 'X' button on the top right.
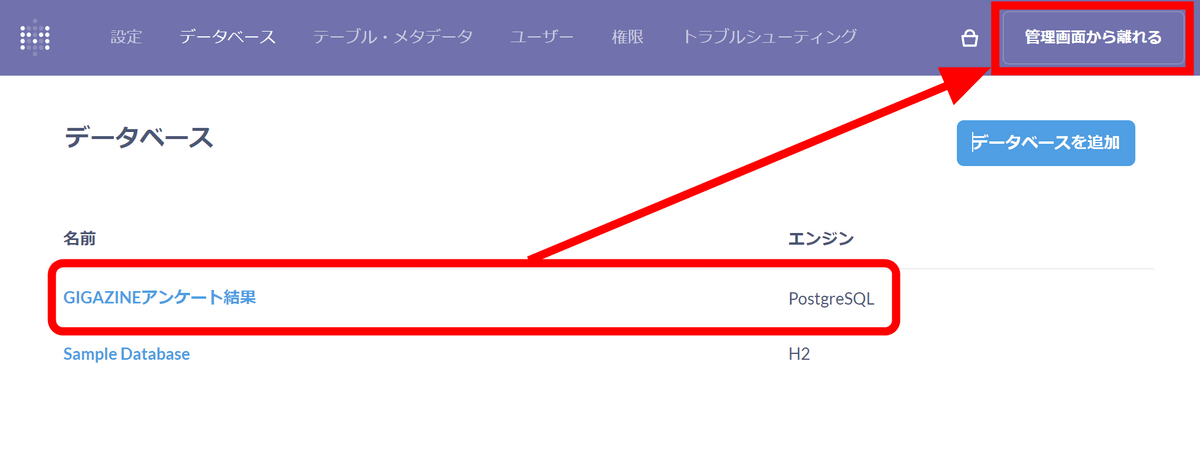
When the database name is displayed as shown below, click 'Leave the management screen' in the upper right corner.
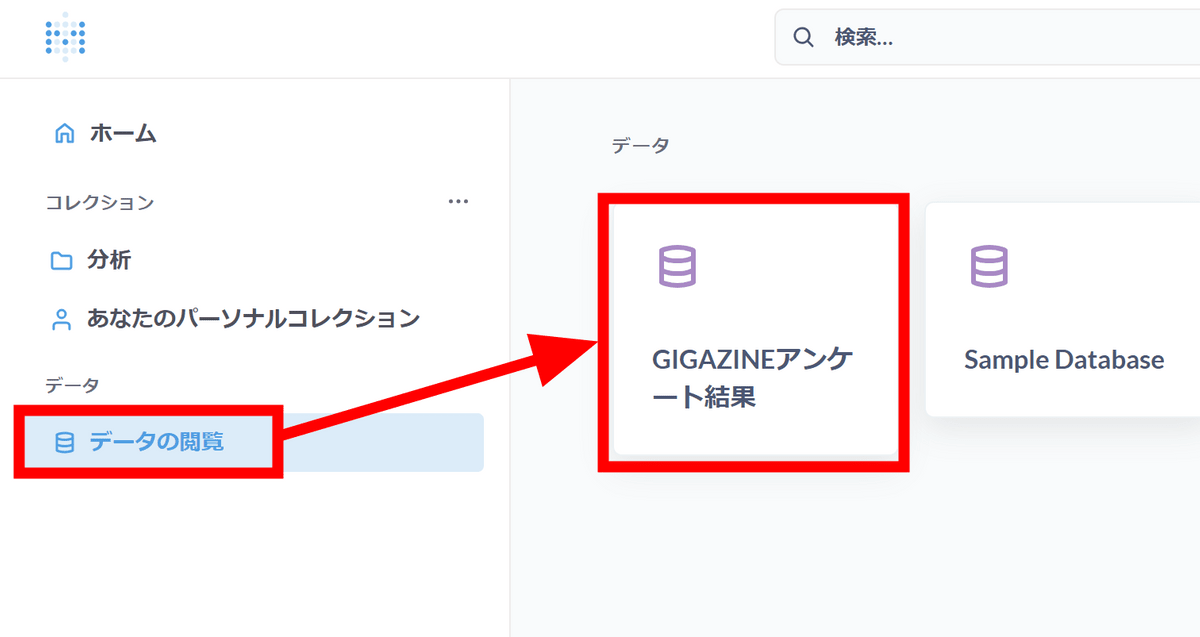
When you click 'View data', the database is added, so click 'GIGAZINE survey results'.
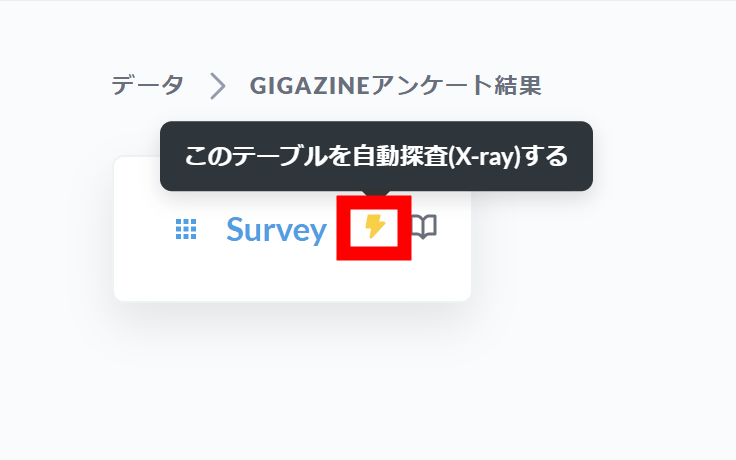
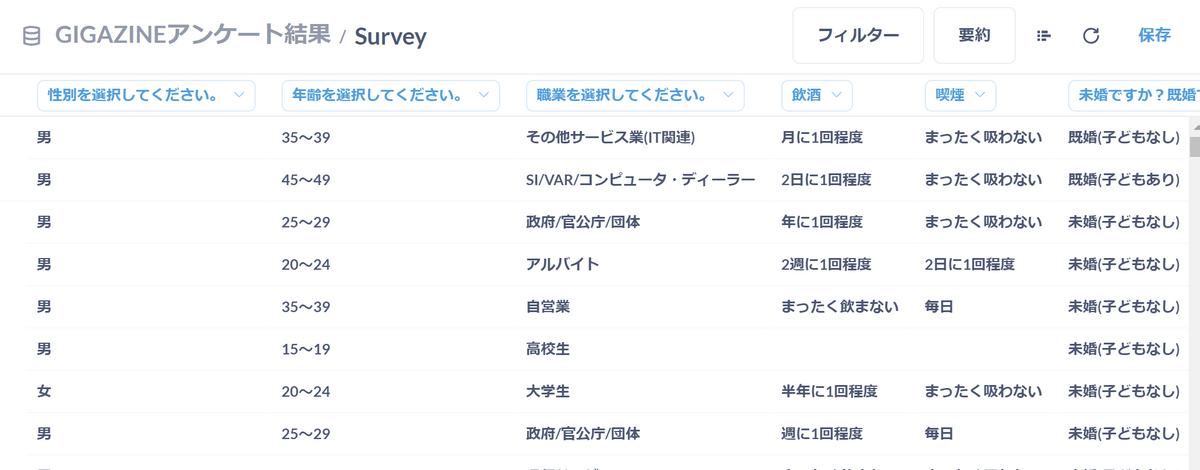
The 'Survey' table where the data was saved earlier is displayed. Click 'Automatically explore (X-ray) this table'.
Answers to some questions have been compiled. Perhaps because there are too many items, many items of interest are missing.
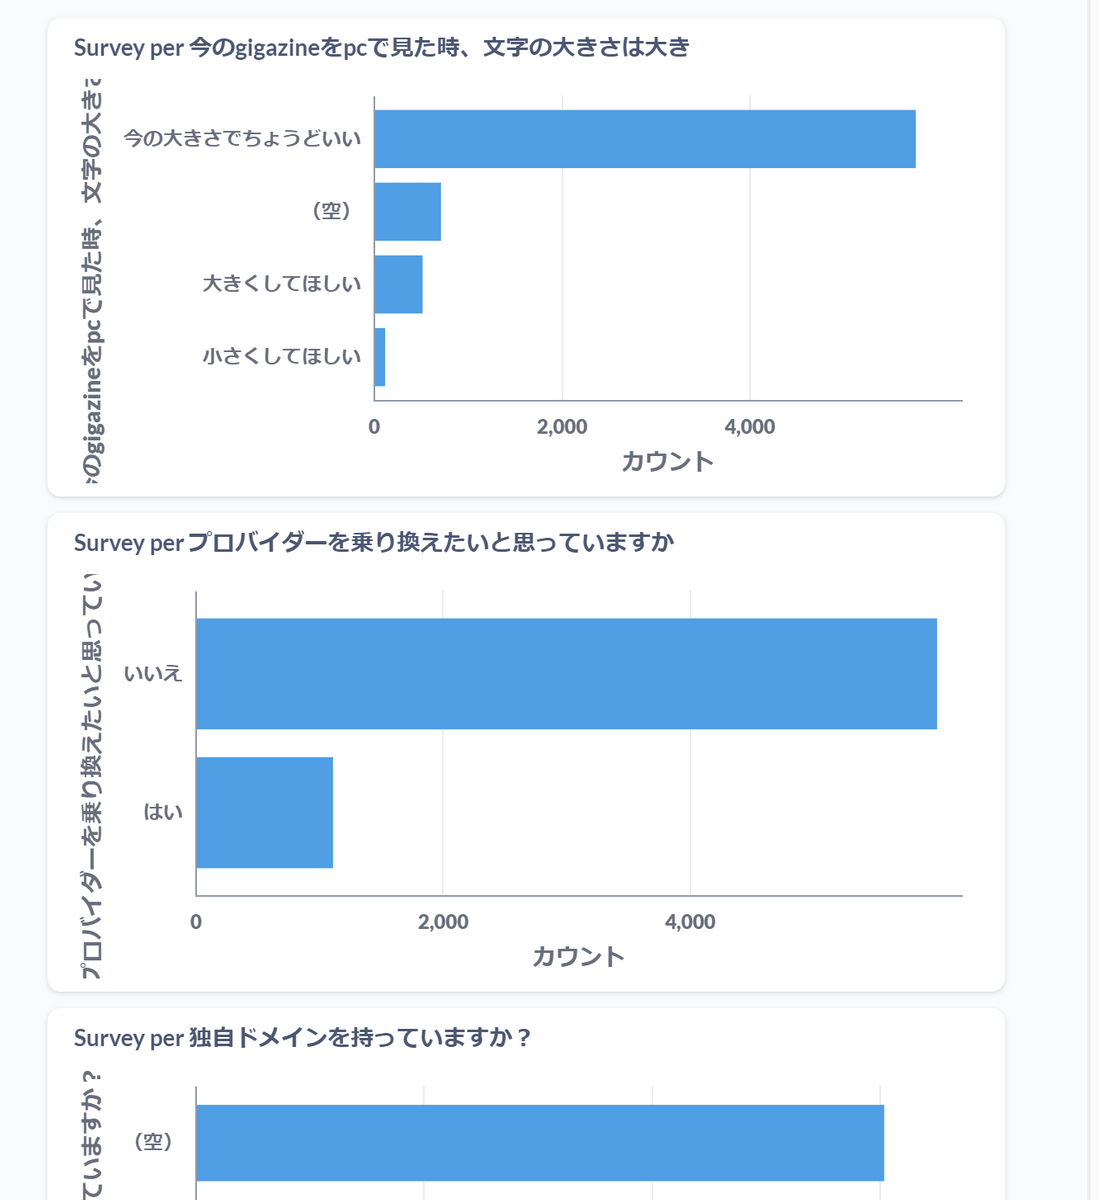
So, let's check the contents of the data without relying on automatic exploration.
Items and answers are arranged in list format.
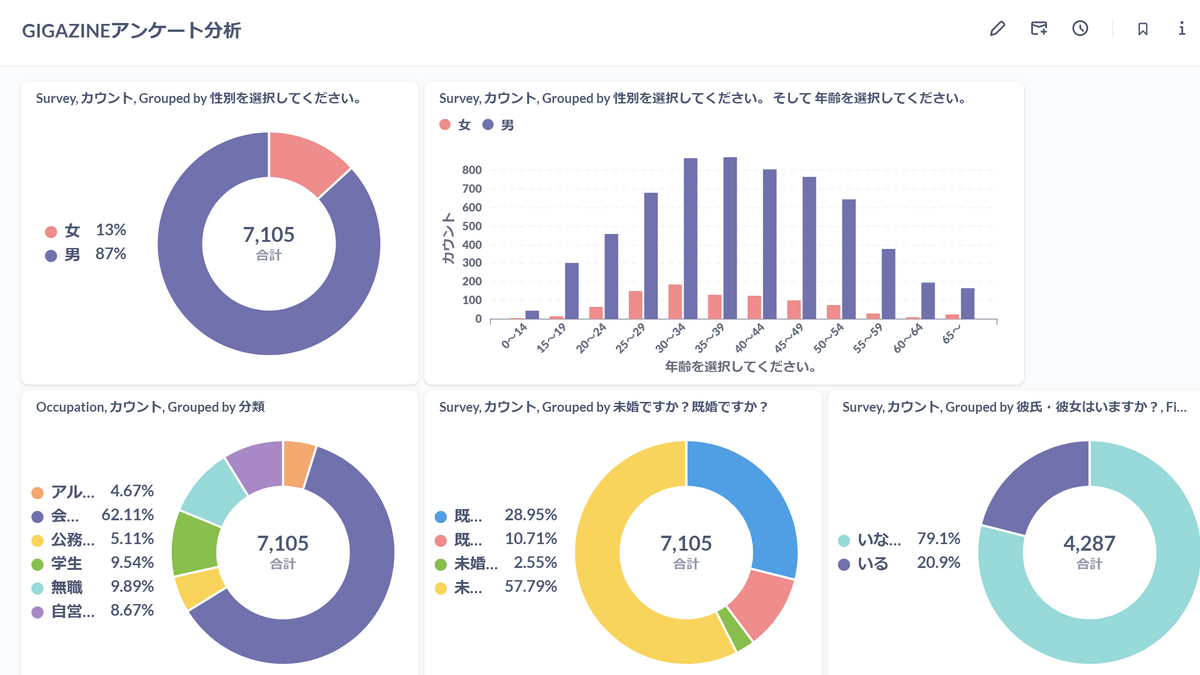
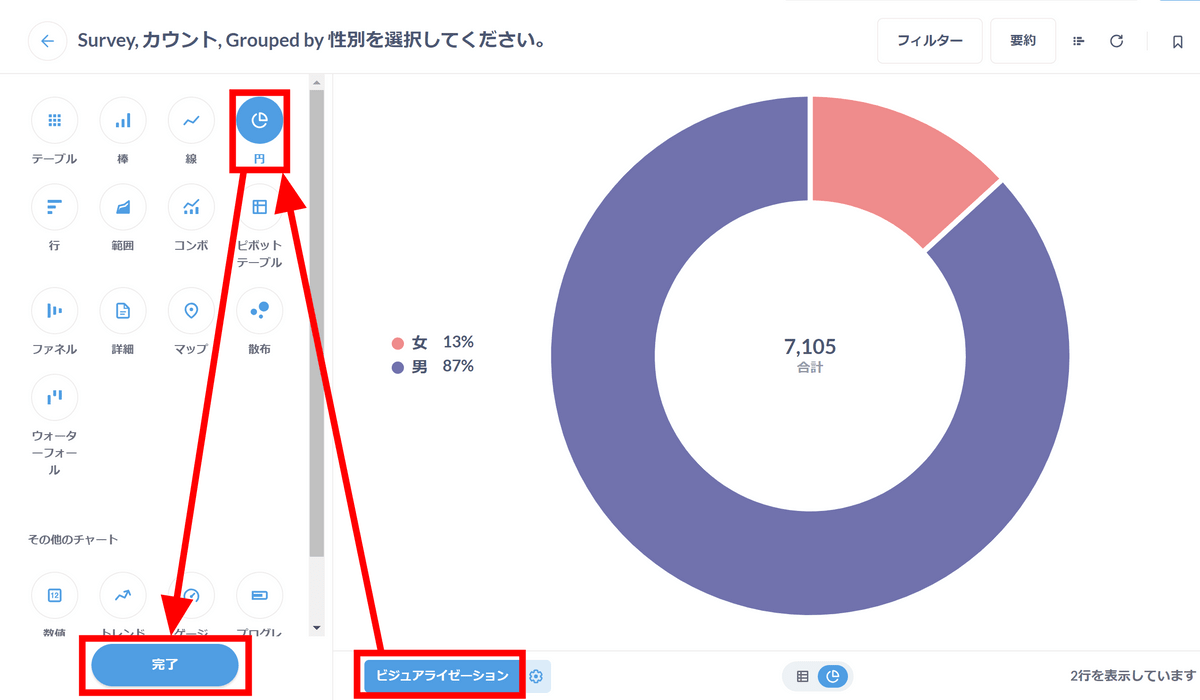
First of all, when I graph the gender, it looks like this.
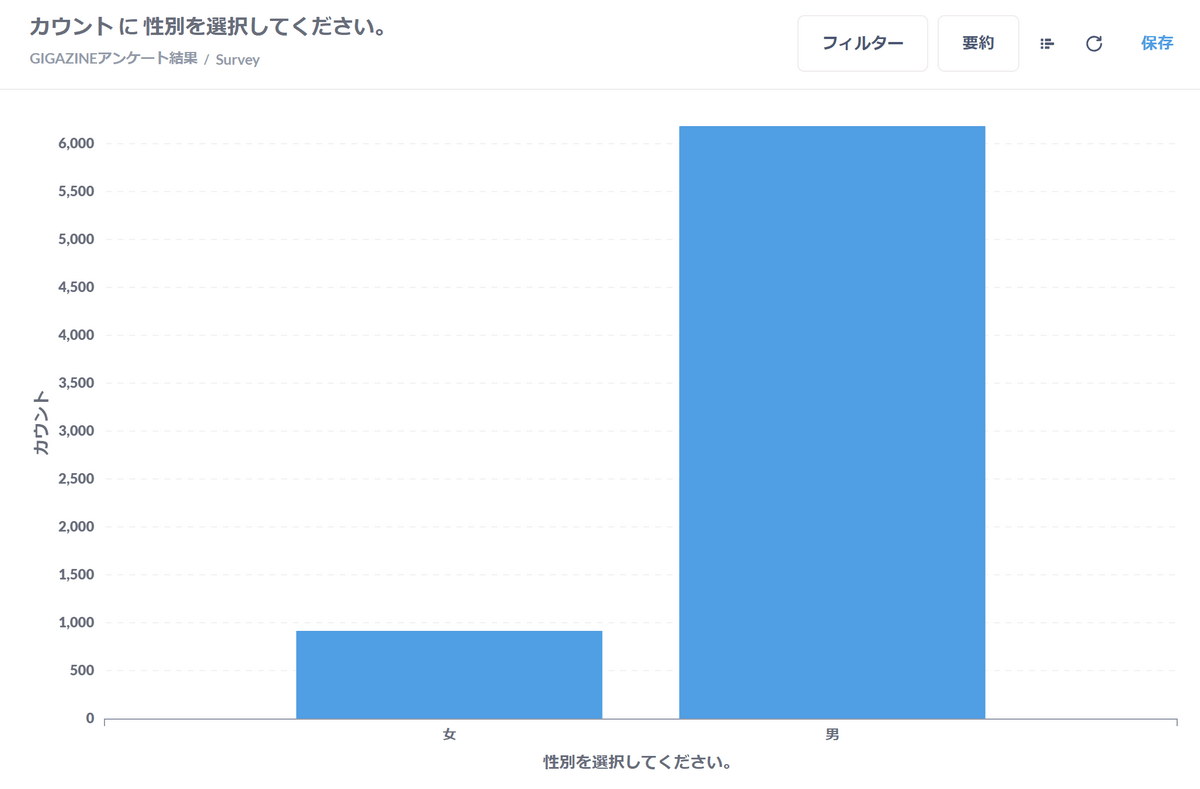
I tried selecting pie chart in the 'Visualization' menu. 87% of GIGAZINE's readers are men.
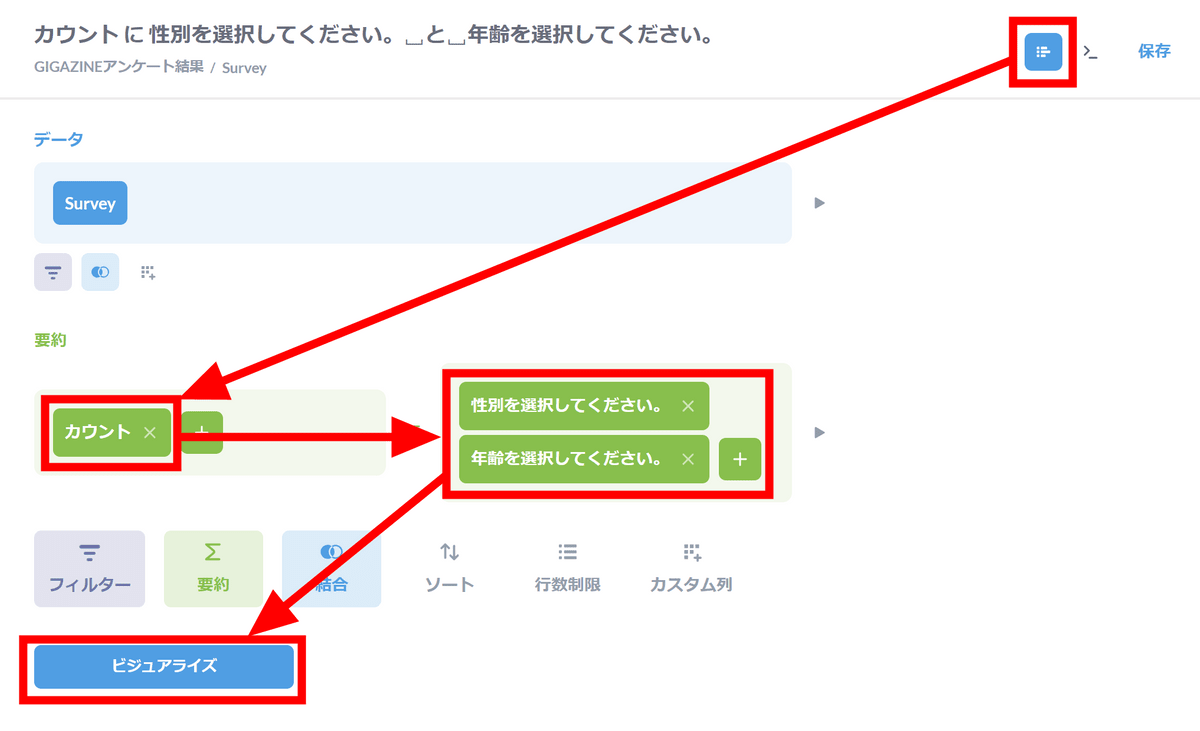
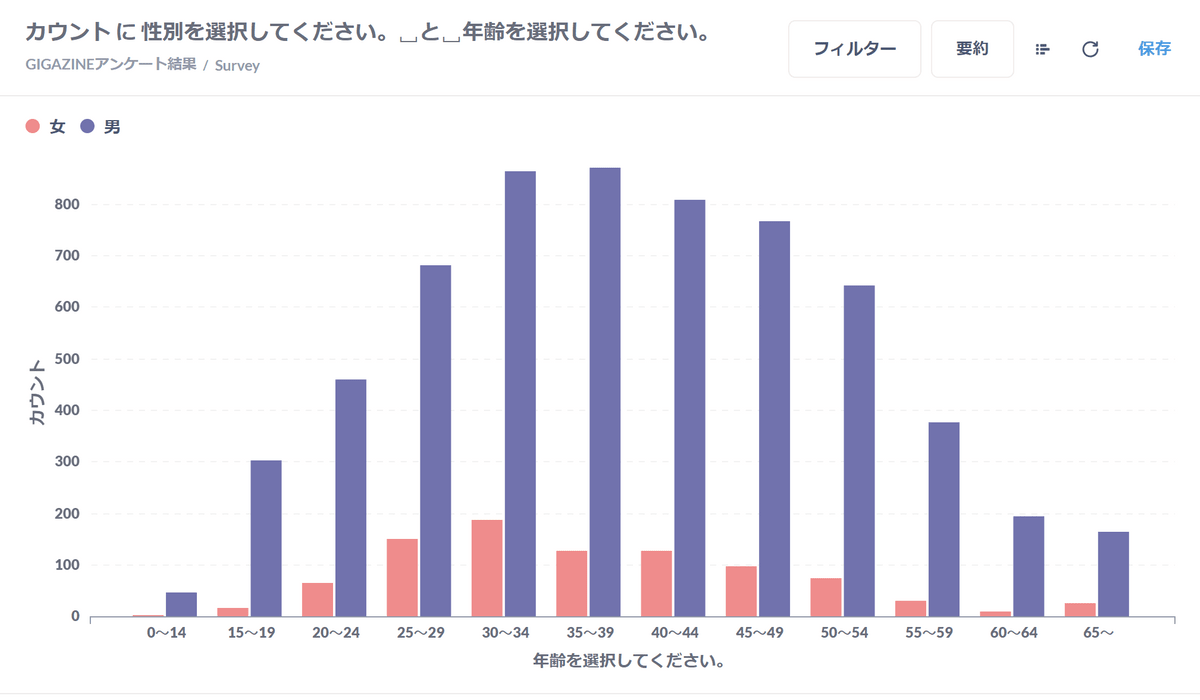
Since I am using Metabase, I will open the editor and create a graph by combining gender and age.
The age range seems to be mostly from late 20s to 40s. Women tend to be a little younger.
The distribution of occupations is like this. It's too detailed, making it difficult to read trends.
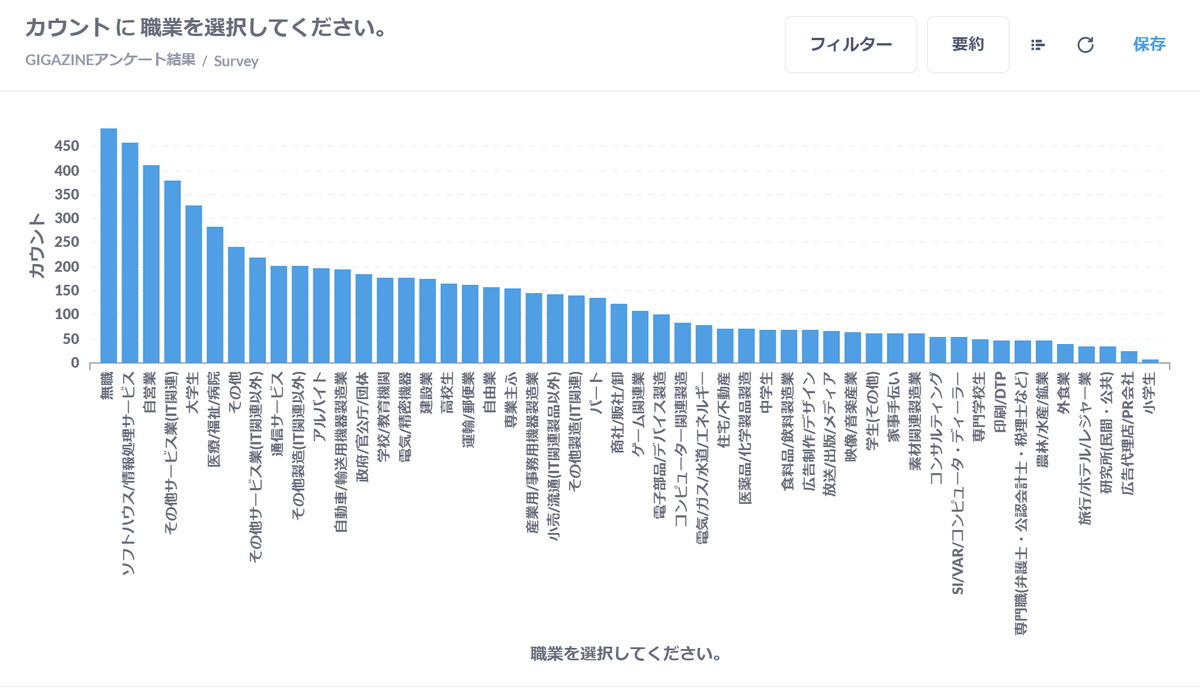
Therefore, occupations are grouped into broad categories. First, create a table using the command below.
[code]CREATE TABLE occupation
('occupation' varchar,
'Classification' varchar);[/code]
Each occupation is then categorized as ``unemployed,'' ``self-employed,'' ``office worker,'' ``student,'' ``civil servant,'' and ``part-time worker,'' as shown below.
[code]INSERT INTO occupation VALUES
('unemployed', 'unemployed'),
('Softhouse/Information Processing Service', 'Company Employee'),
('self-employed', 'self-employed'),
...(omitted)...
('elementary school student', 'student');[/code]
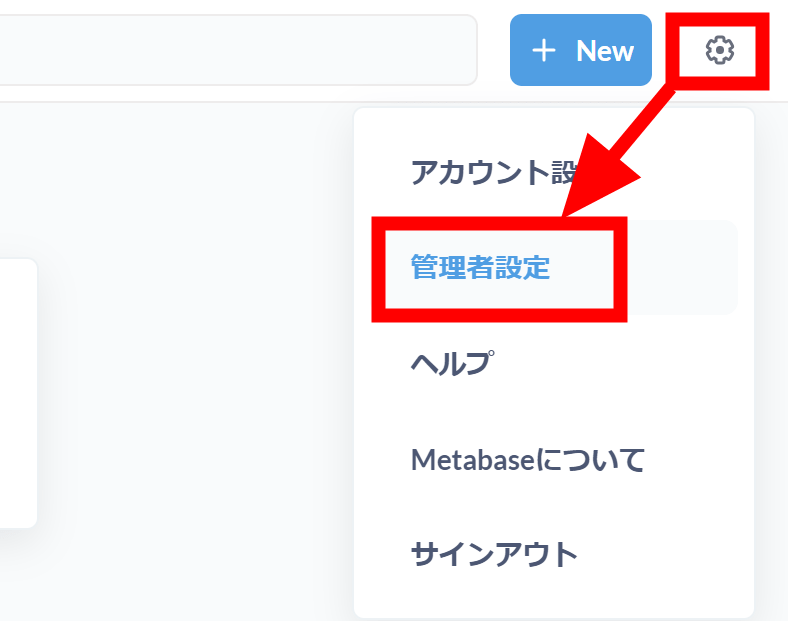
To load the updated data, click 'Administrator Settings' from the gear mark in the upper right corner of Metabase.
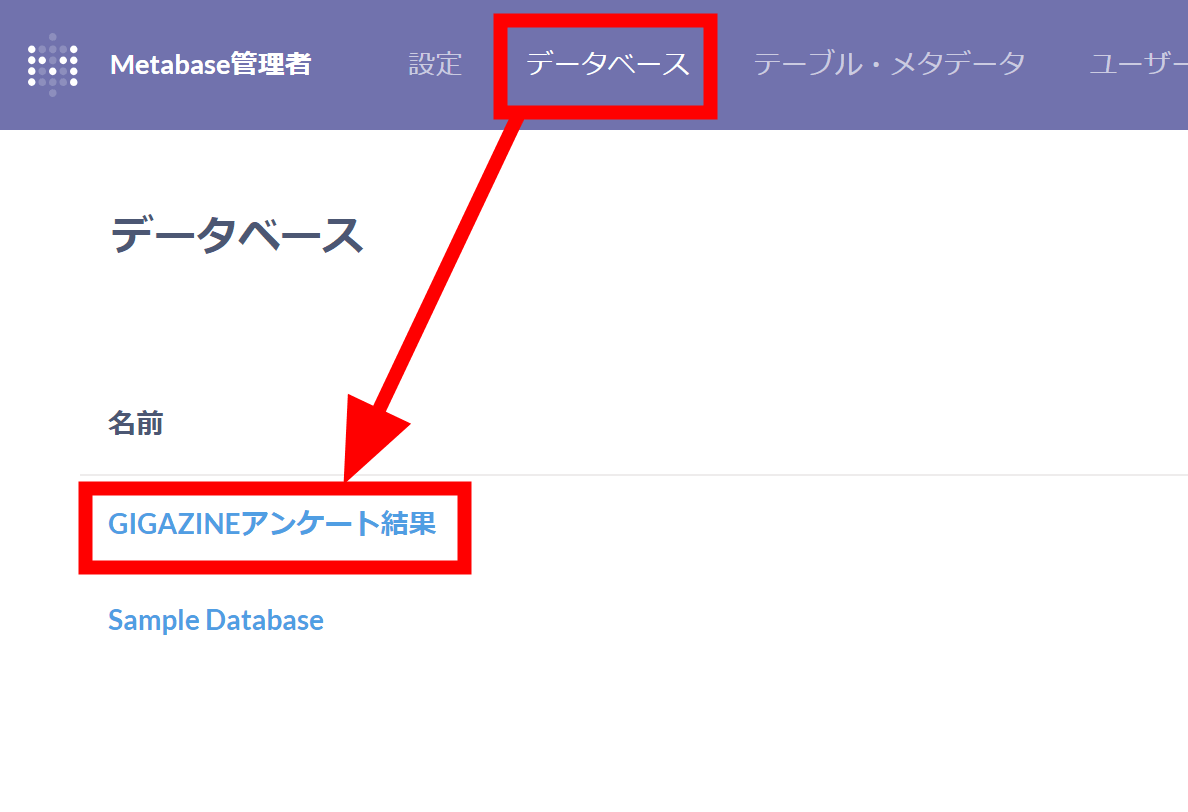
Click 'GIGAZINE Survey Results' from the 'Database' menu.
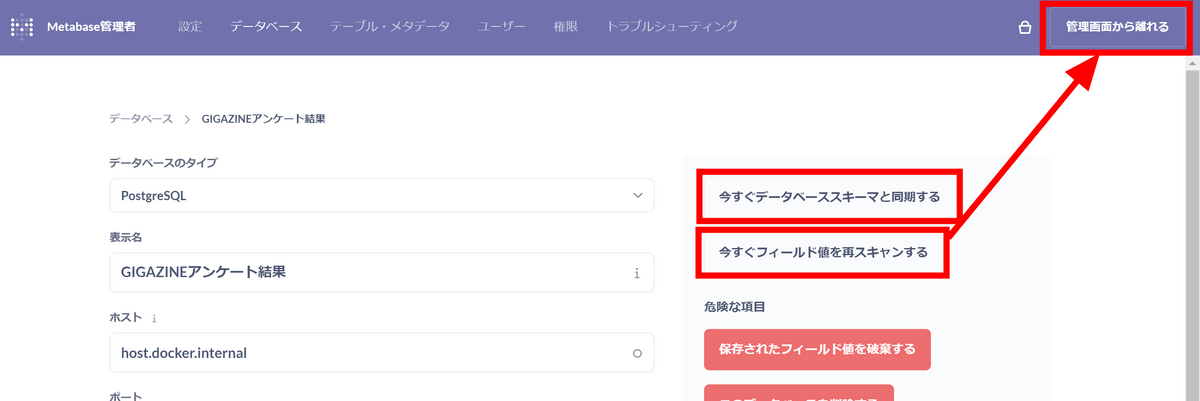
Click both ``Synchronize database schema now'' and ``Rescan field values now'', then click ``Leave admin screen''.
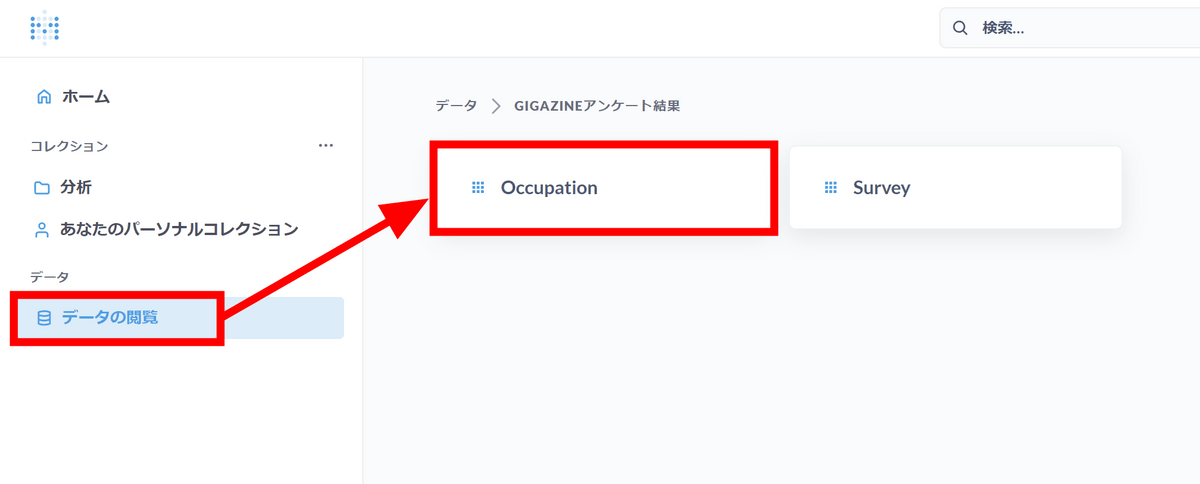
The 'Occupation' table you created earlier is displayed on the 'View Data' tab, so click on it.
Open the editor and JOIN with the Survey table using a right outer join. Set the 'Occupation' column and 'Please select an occupation.' column to match and click 'Visualize'.
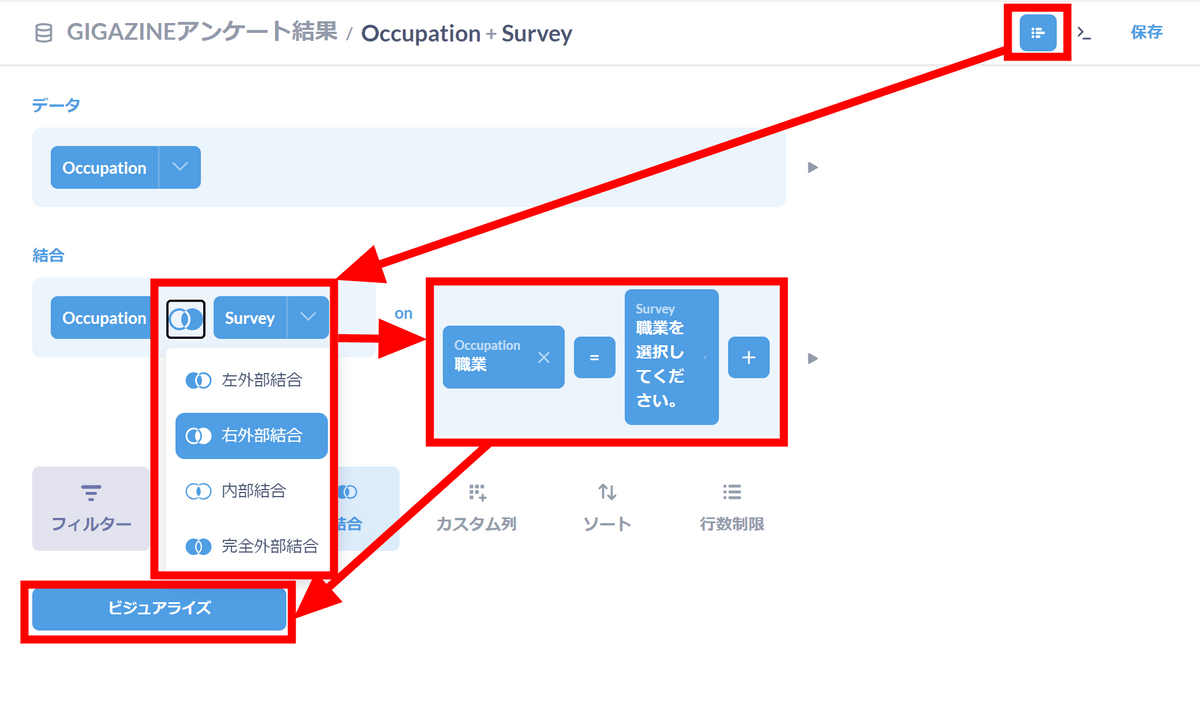
Now that you have successfully added 'Classification', click 'Distribution' to check it out.
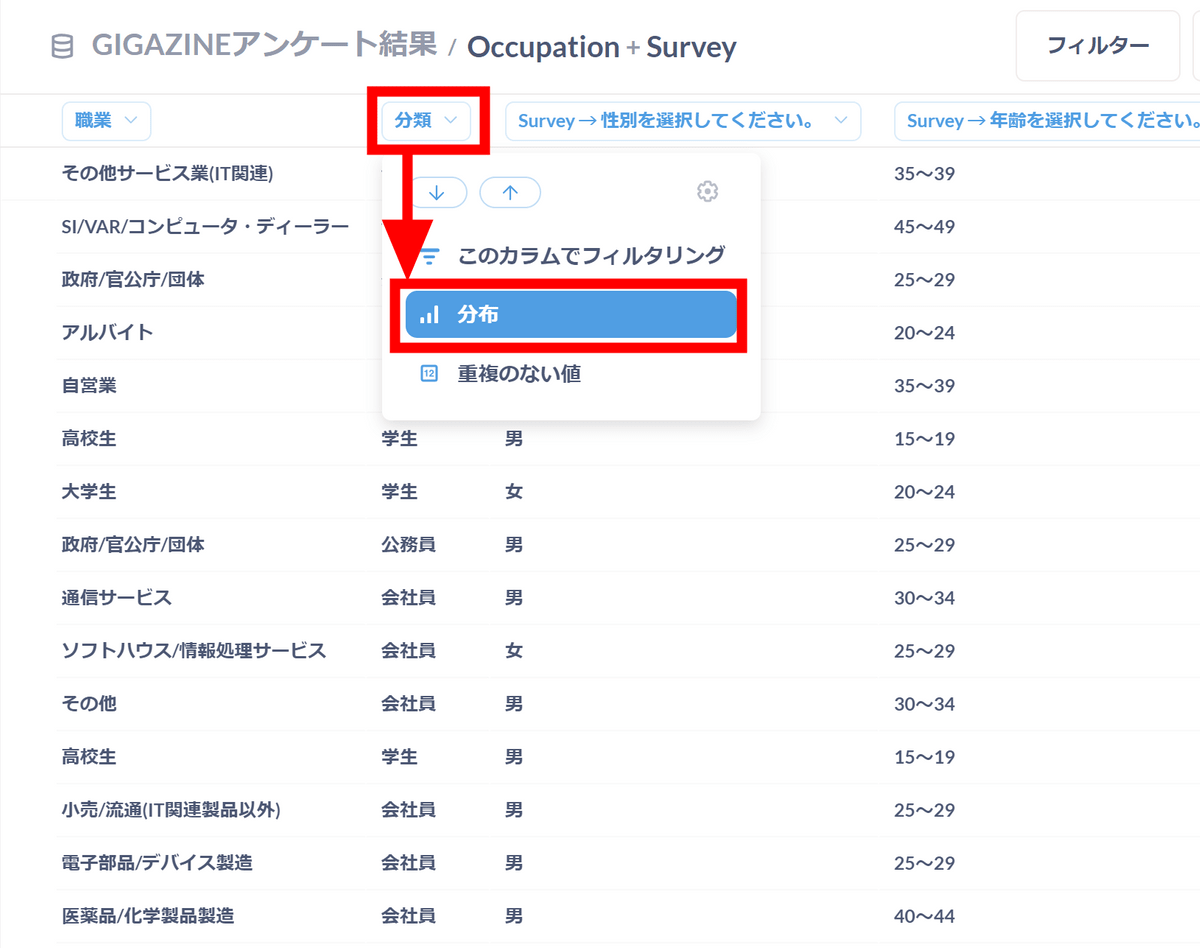
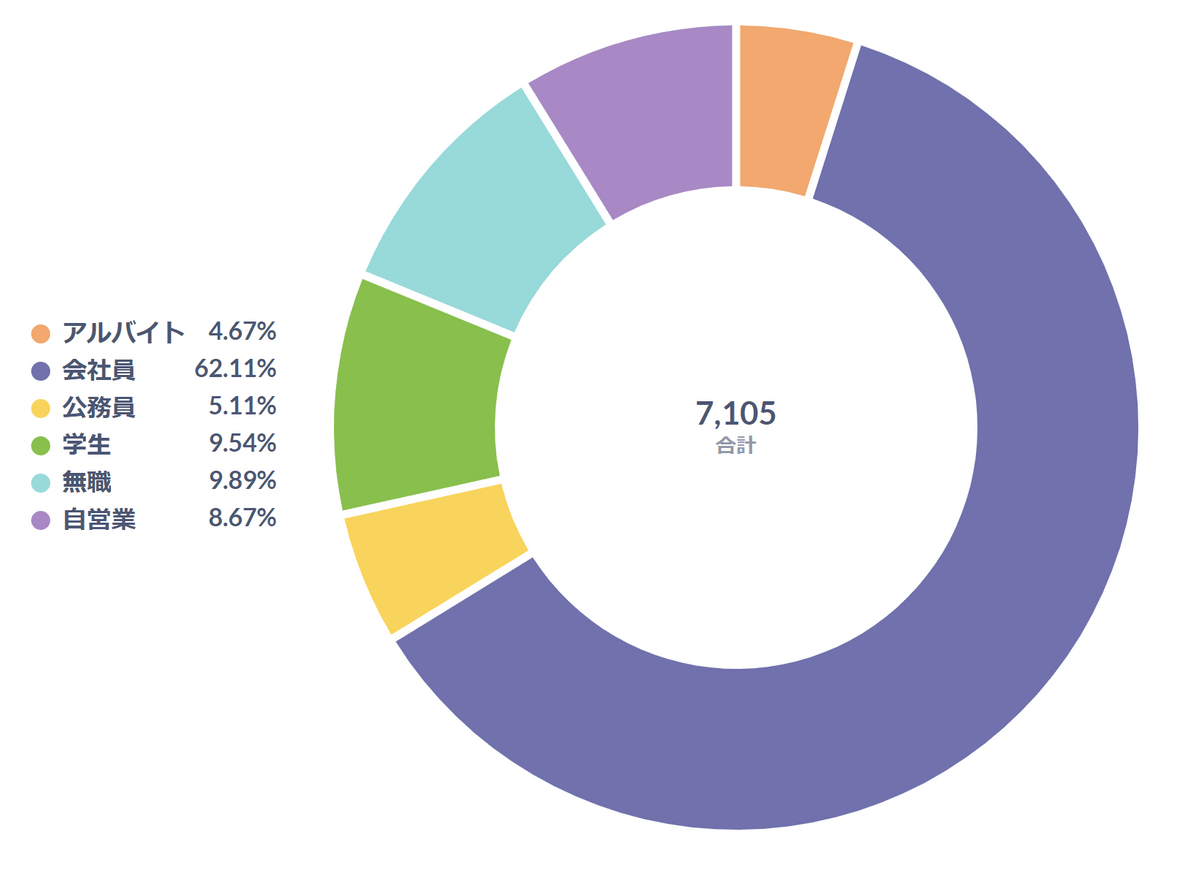
The results are as follows. 62% of GIGAZINE readers are office workers, and 10% each are students, unemployed, and self-employed.
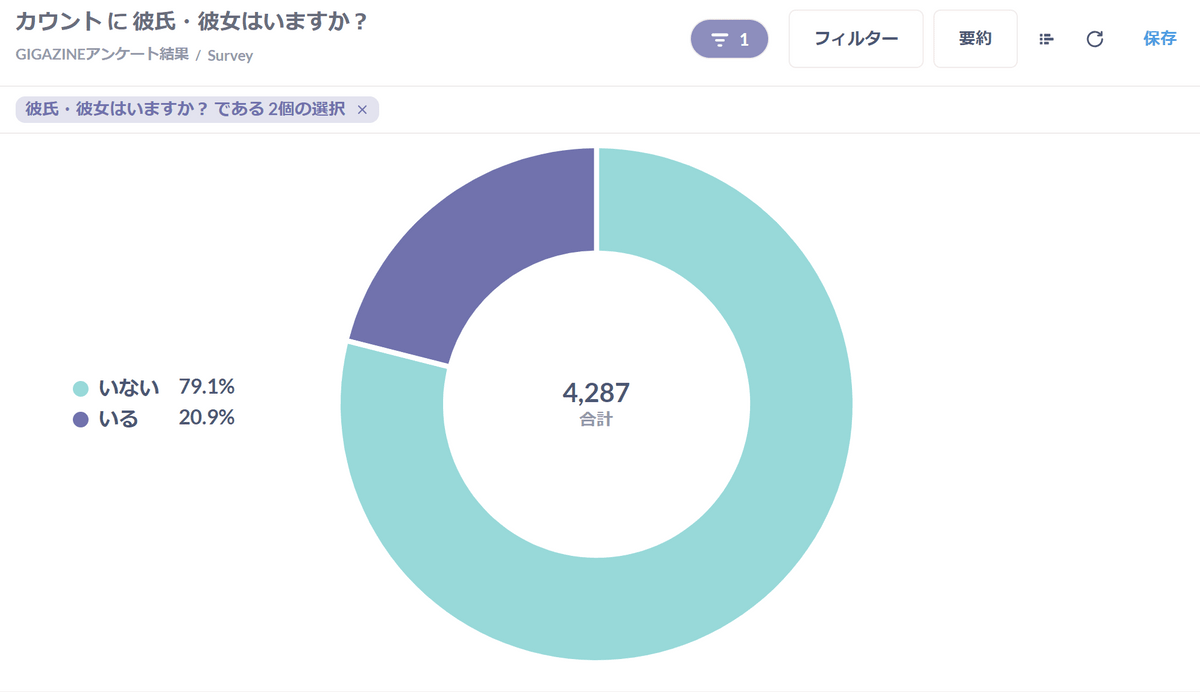
Approximately 60% of GIGAZINE readers are unmarried.
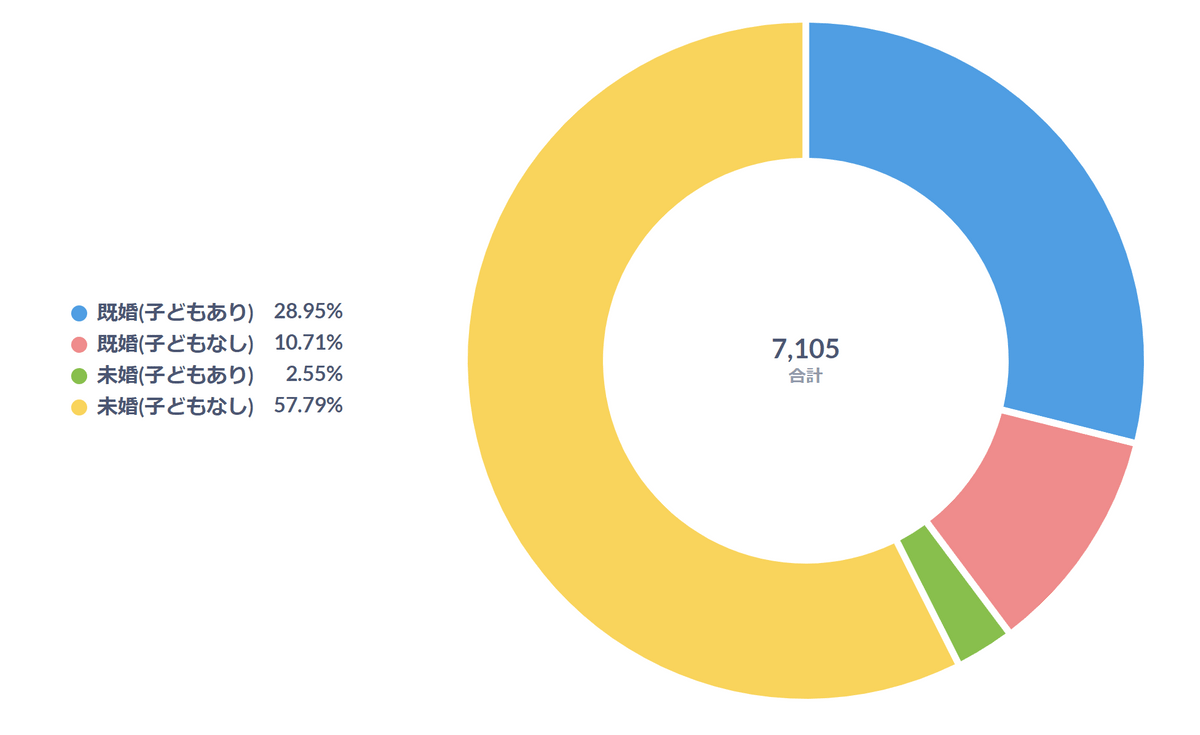
However, about 20% of unmarried people have a boyfriend or girlfriend. Combining these data, we can see that about half of the people are unmarried and not in a relationship.
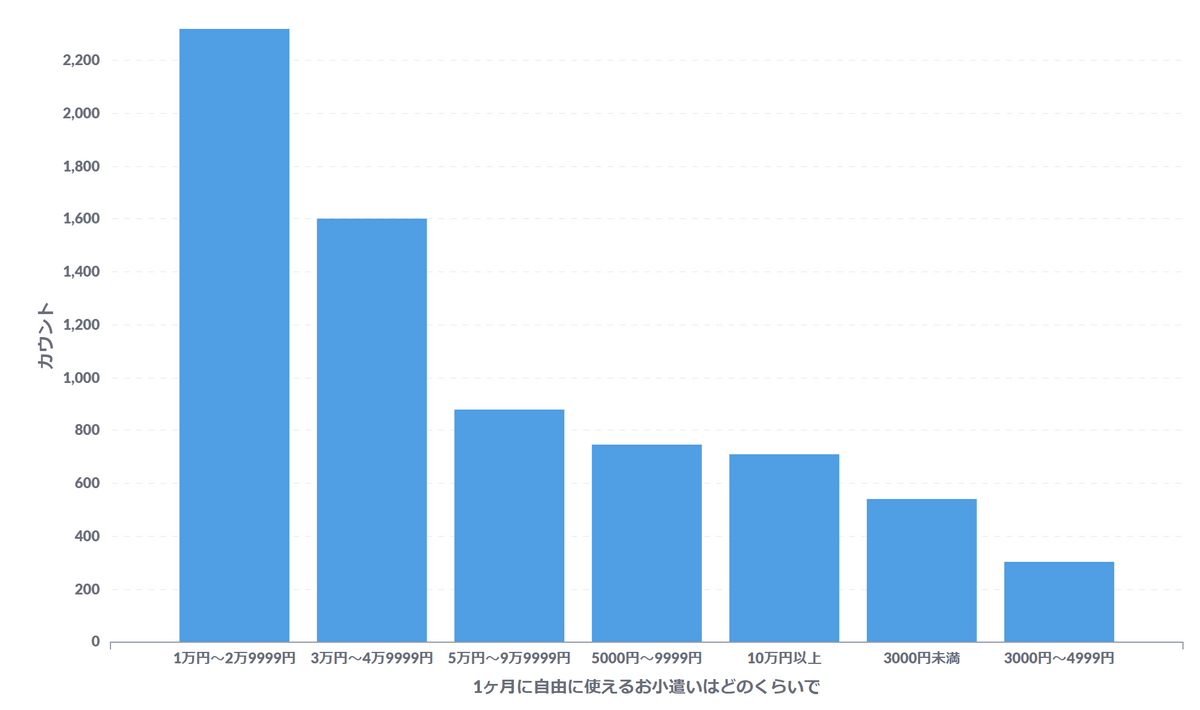
Most people seem to have around 10,000 to 50,000 yen to spend each month.
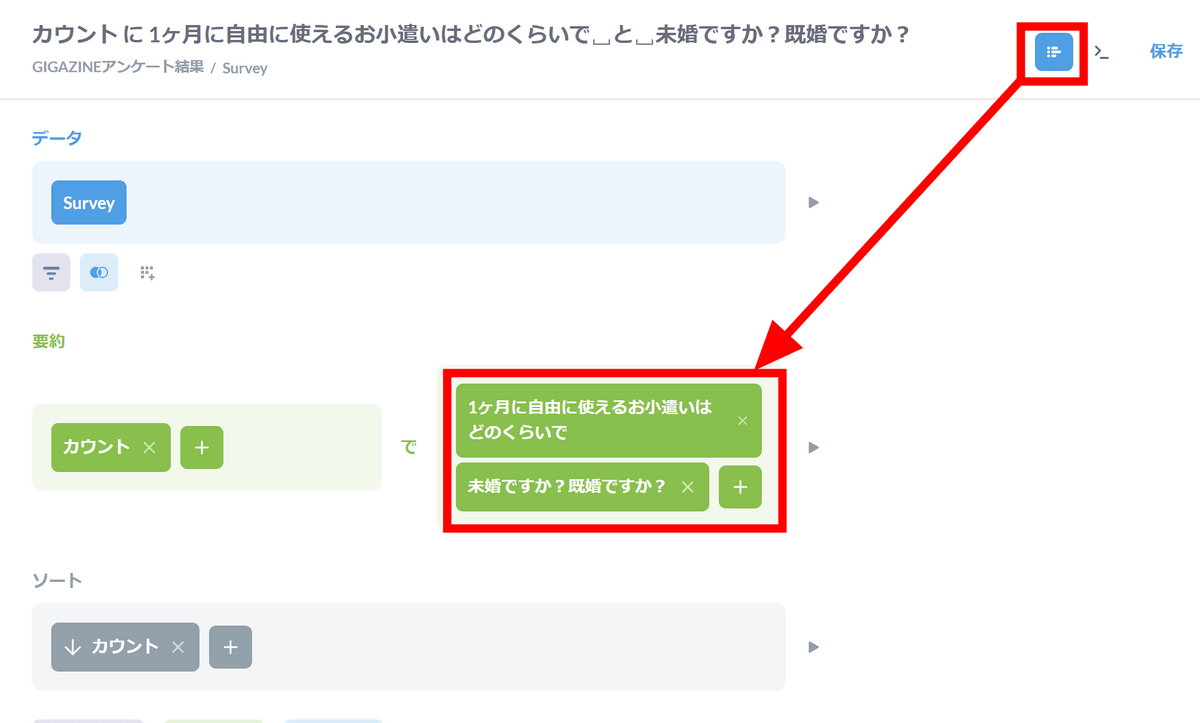
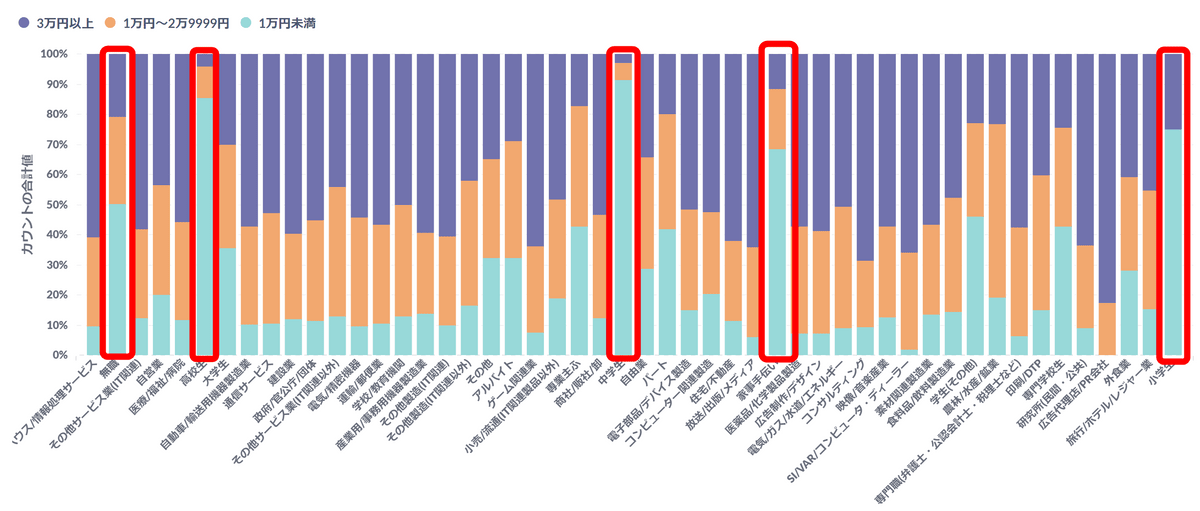
Let's look at the combination of single/married and the amount of pocket money.
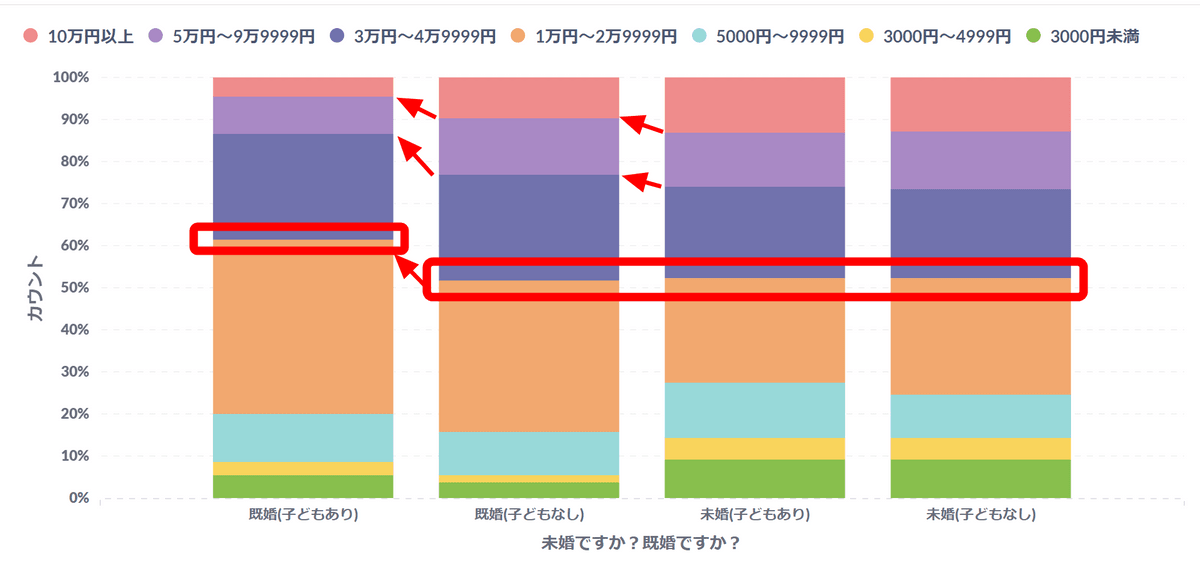
When I divided the numbers into percentages for each attribute, I saw a line of 30,000 yen. It can be seen that once you have a child, the amount of money you can spend freely decreases all at once.
The following is a combination of data for each occupation and pocket money data. We were able to confirm the obvious result that unemployed people and students have less money to spend.
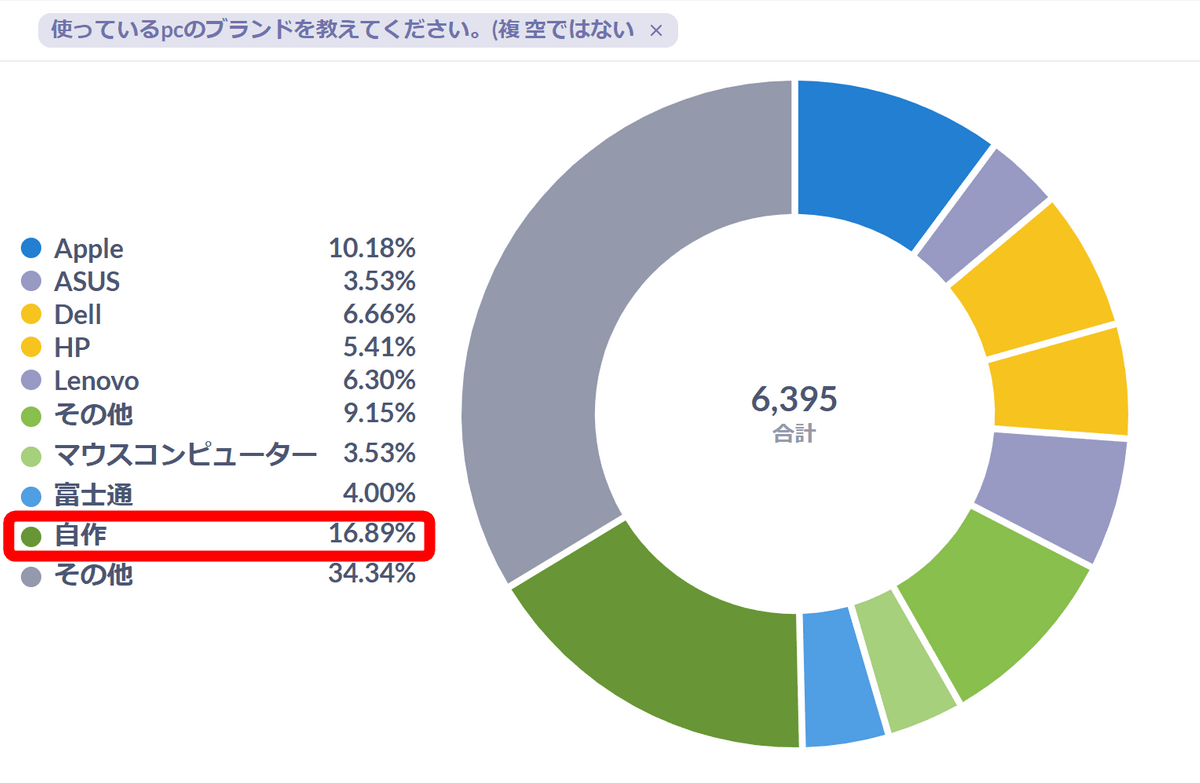
Approximately 17% of GIGAZINE readers build their own PCs, as there are many IT-related articles.
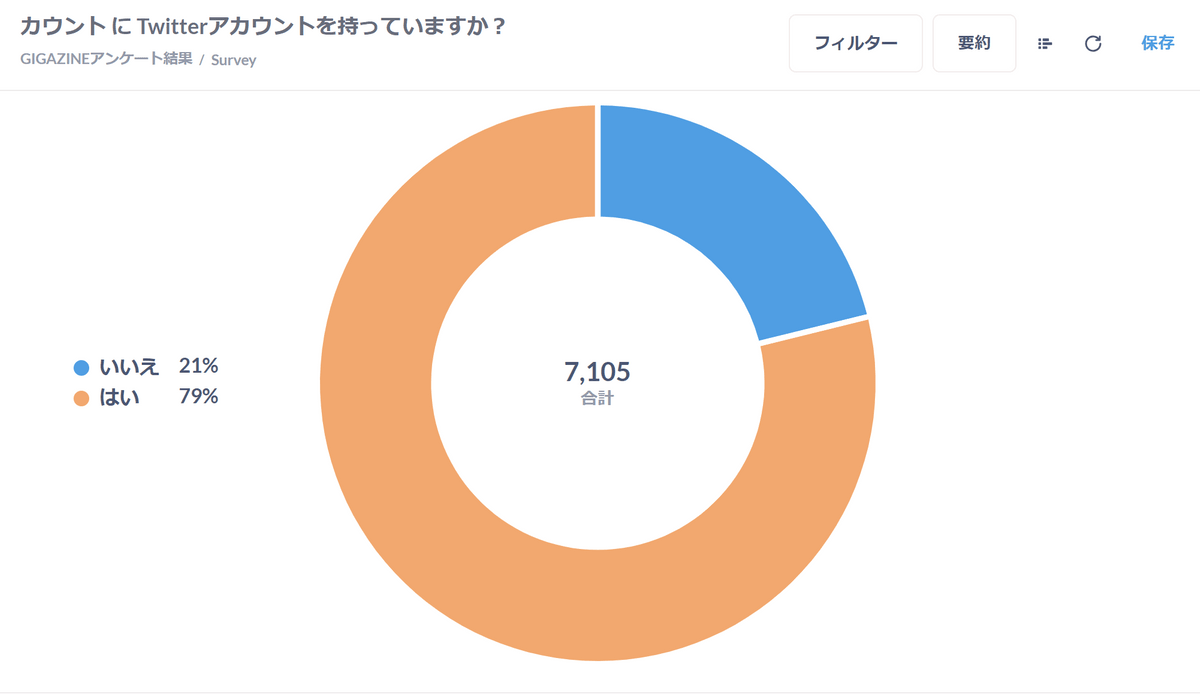
An overwhelming 80% of people have a Twitter account.
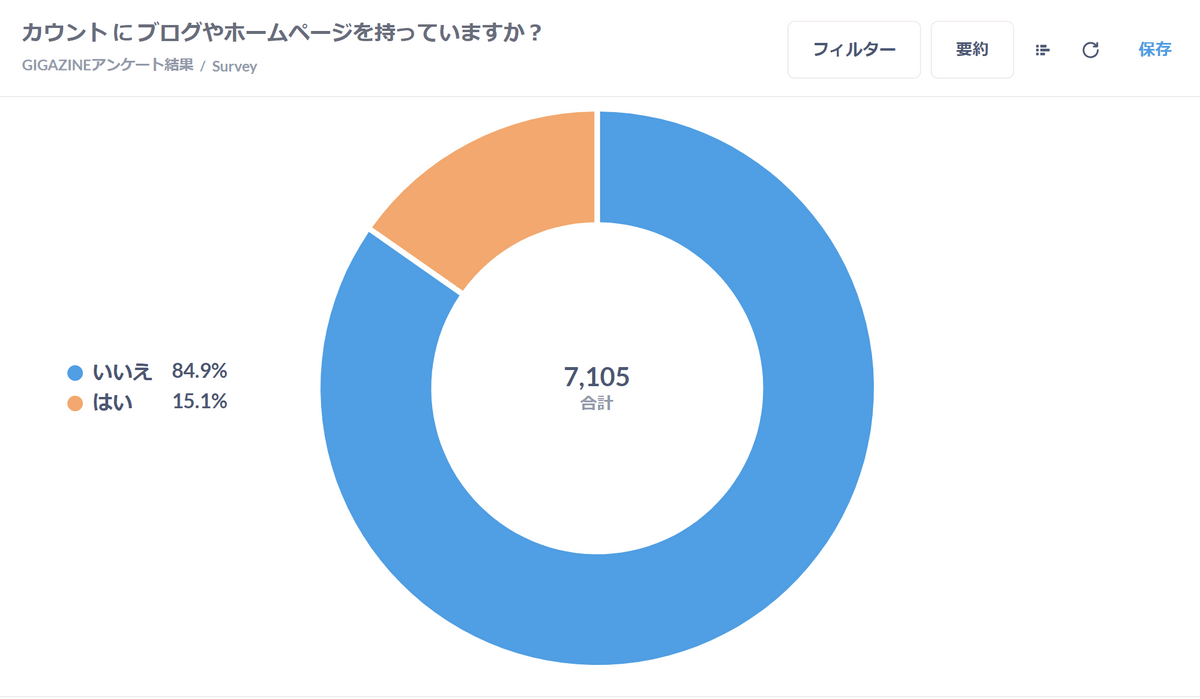
Furthermore, about 15% of people have a blog or homepage.
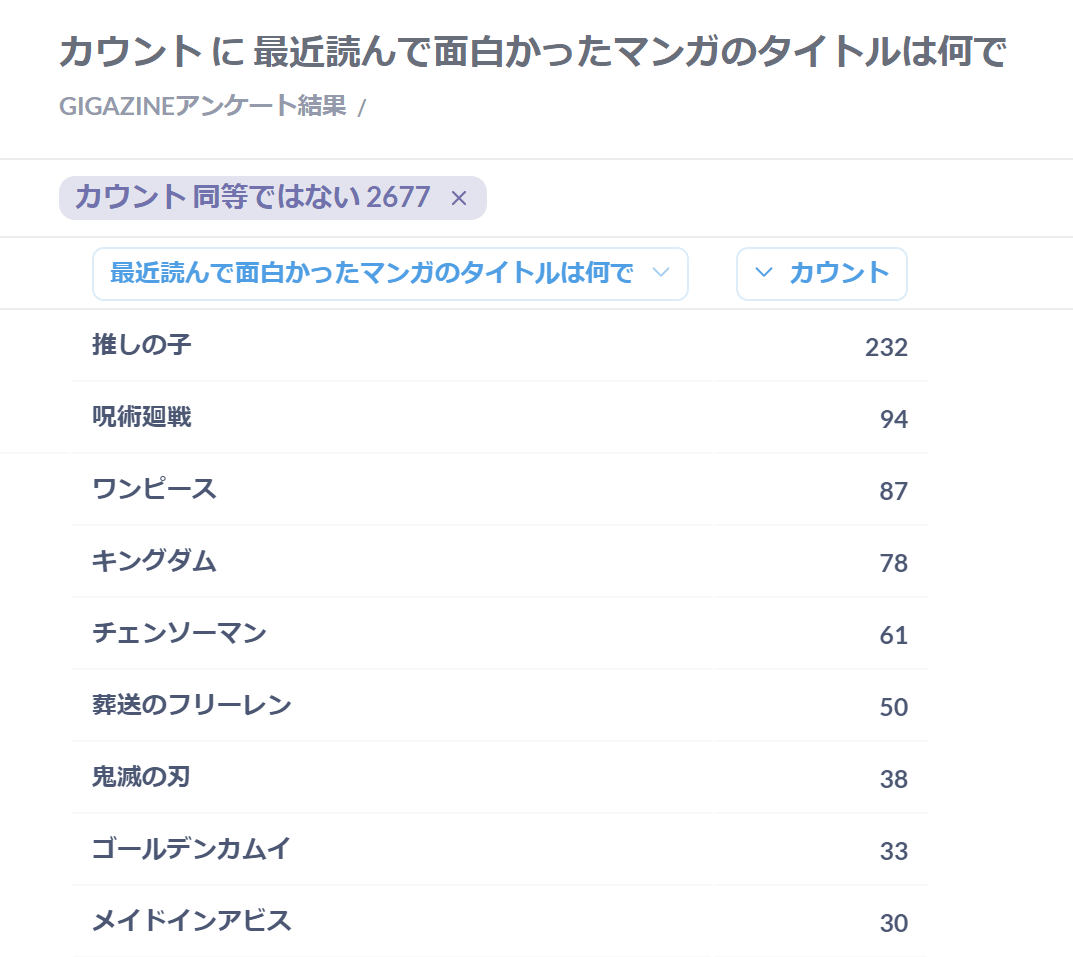
In addition, the overwhelming majority of the manga recommended by GIGAZINE readers was '
By making full use of the above data and more detailed data and knowledge, GIGAZINE is able to publish article advertisements at a level unrivaled by other media, easily and without much effort, and at a very reasonable budget. is possible, so if you have any questions or concerns about ``Will advertising my product through GIGAZINE article ads actually be effective?'' , please click here!
Related Posts:


in Free Member, Software, Review, Web Application, Posted by log1d_ts