'Firefox Profiler' review, a tool that allows you to visualize the performance of web pages for free
Firefox comes with development tools for web developers. An analysis tool ' Firefox Profiler ' that can visualize the performance of the website was added to this development tool, so I actually tried using it.
Performance Tool in Firefox DevTools Reloaded --Mozilla Hacks --the Web developer blog
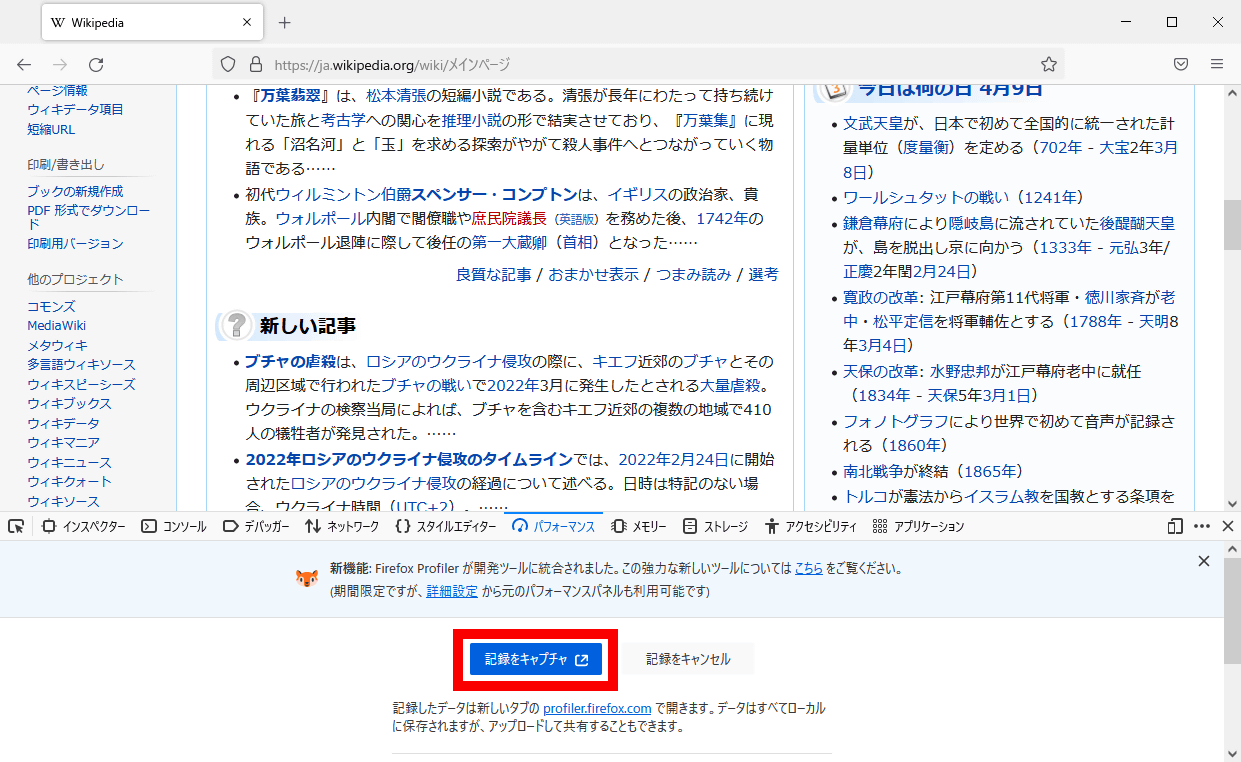
To use Firefox Profiler, with the web page to be analyzed open, press 'Shift' and 'F5' on the keyboard at the same time, and click 'Start Recording' from the menu that appears.

After starting the recording, perform the operation you want to check the performance such as updating the web page or clicking the element in the web page, and click 'Capture recording' after the operation is completed.
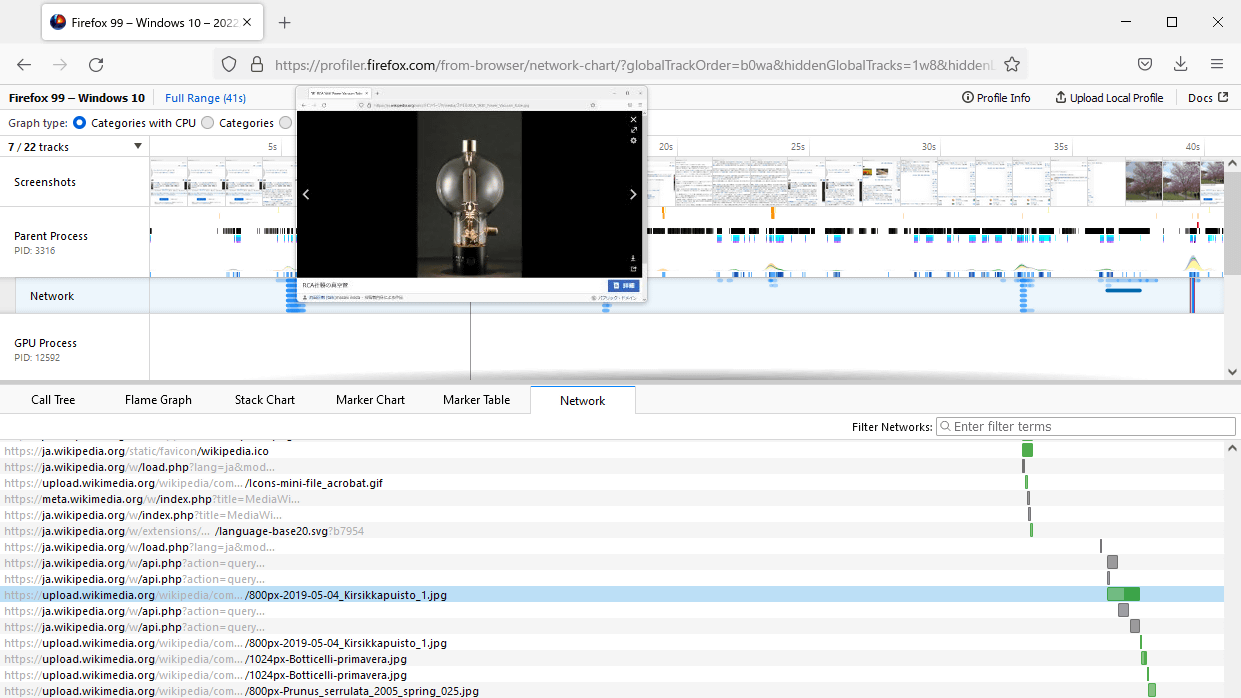
The performance analysis results will then be displayed in a new tab.
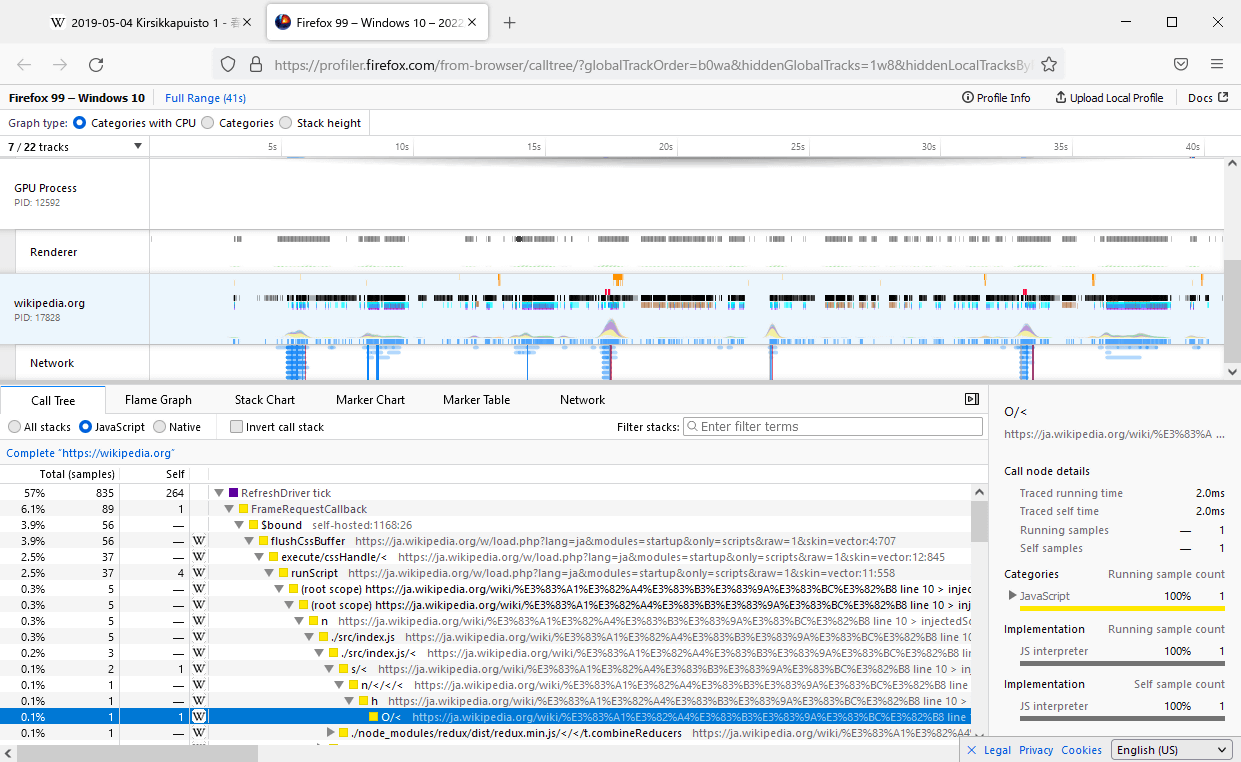
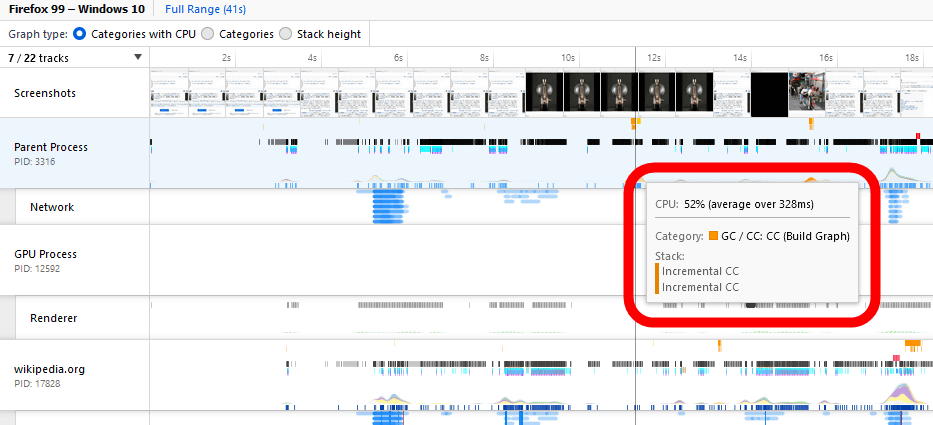
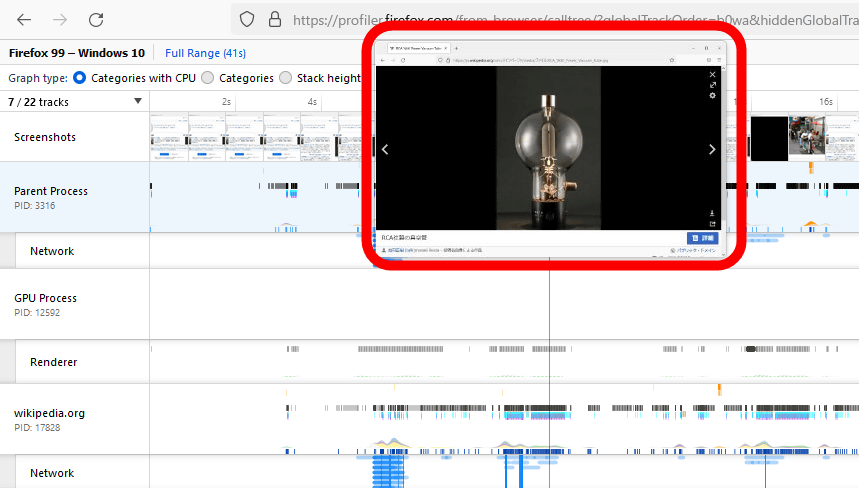
In the analysis result, the CPU usage rate when each element is read and ...
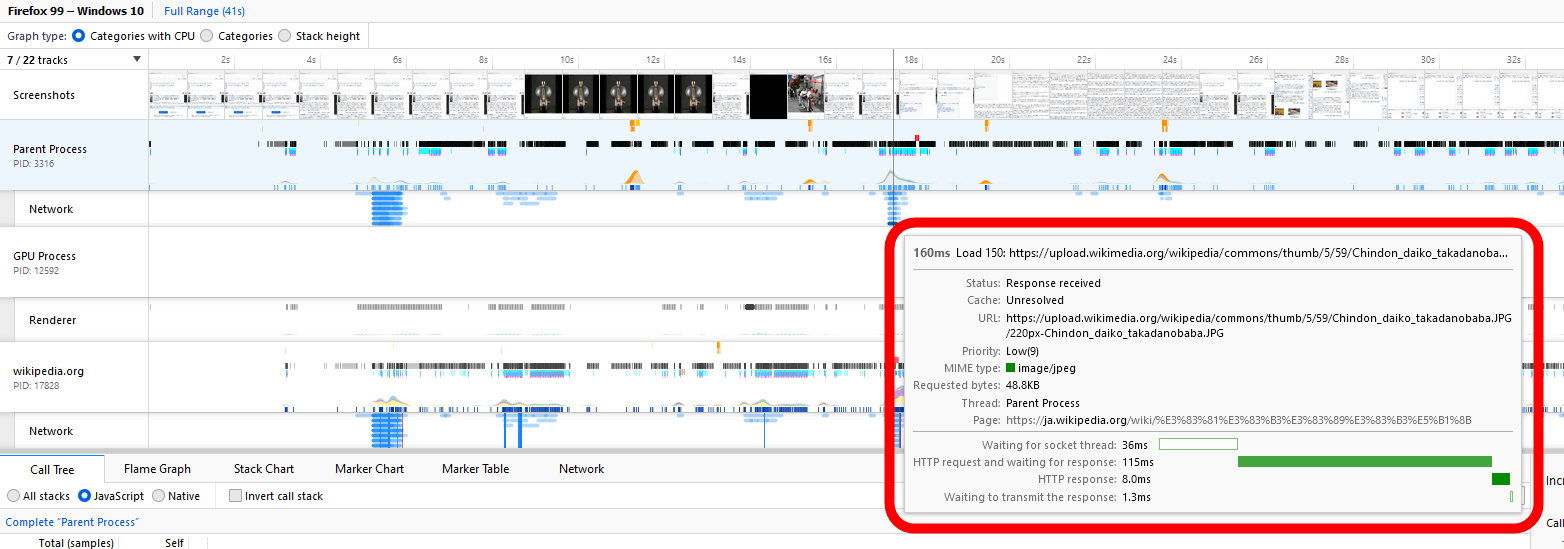
You can check the communication time.
Also, the screenshots during the analysis period are displayed in a row at the top, which is useful when you want to know the performance when performing this operation.
Analysis results can be uploaded to Mozilla's server and shared. To share, click 'Upload Local Profile' at the top right of the screen, select the content you want to upload, and then click 'Upload'.

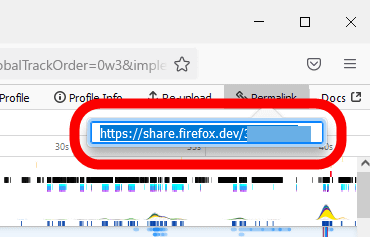
After that, if you share the displayed URL with an email or message app, you can view the same analysis results from other machines.
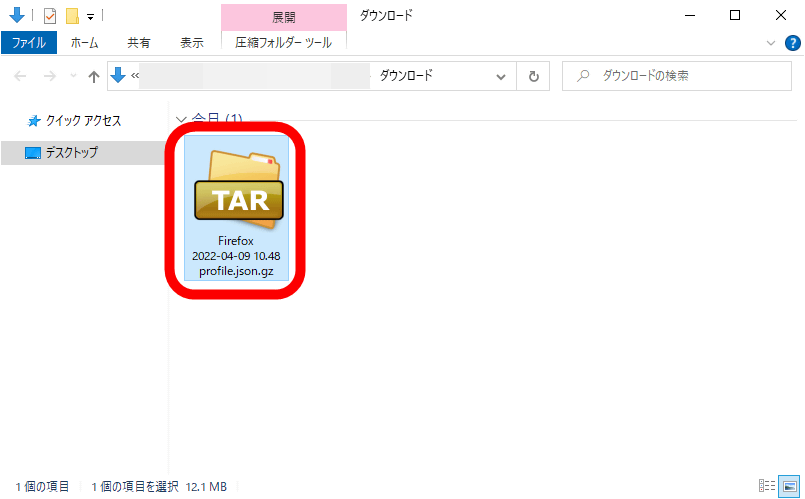
Also, if you click 'Download' on the sharing setting screen ...
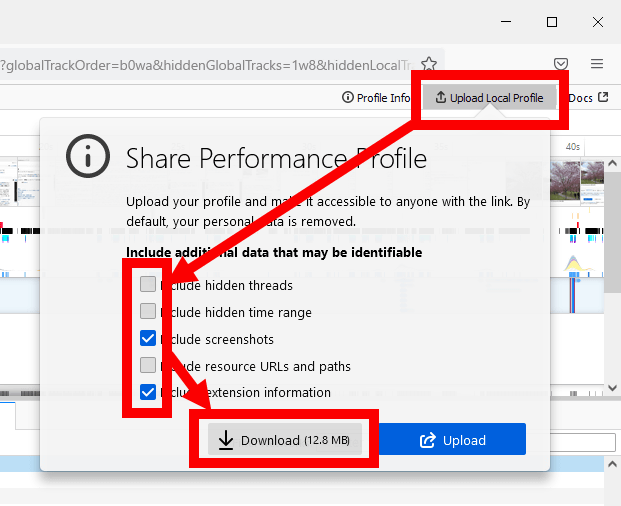
You can save the JSON file containing the analysis results in gzip format.
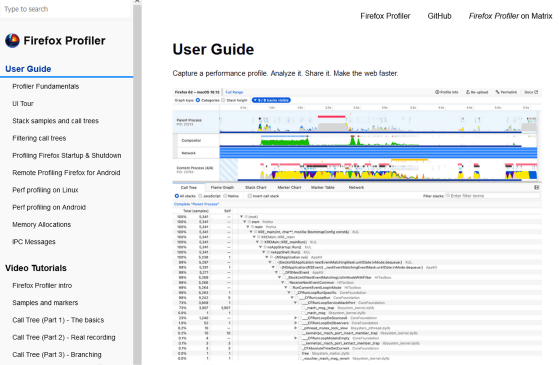
The detailed usage of Firefox Profiler is explained in the following official document, so if you want to know more details, it is recommended to browse.
User Guide --Firefox Profiler --Documentation
https://profiler.firefox.com/docs/
Related Posts: