I tried using an open source application ``highlight.io'' that can obtain and analyze all access information such as ``how did you move the cursor'', ``where did you click'', ``which part you skipped by scrolling''
When developing a web application, I would like the user to give feedback such as ``Where was it difficult to understand?'' and ``Where did the error occur?'', but the work of sending such feedback is quite troublesome. ' highlight.io ' is a tool that gives such feedback without permission, so I actually used it and tried it.
highlight.io: The open source monitoring platform.
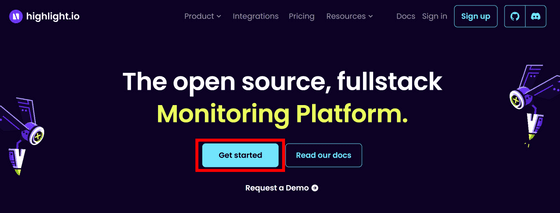
Since highlight.io is open source , a self-hosted version is available, but this time we will use SaaS provided by the developer of highlight.io to see what functions are available. Visit the official website and click 'Get started'.
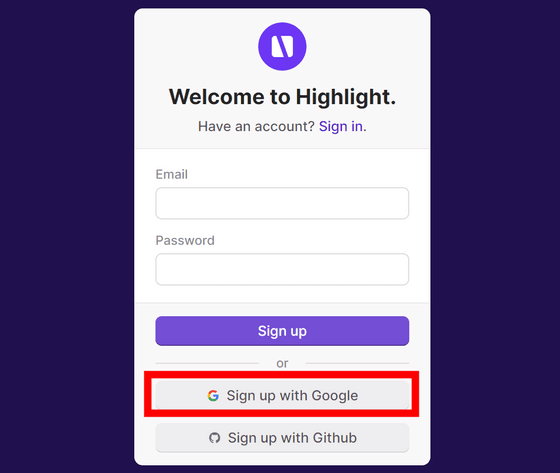
This time I will log in with my Google account, so click 'Sign up with Google'.
Click the account to log in.
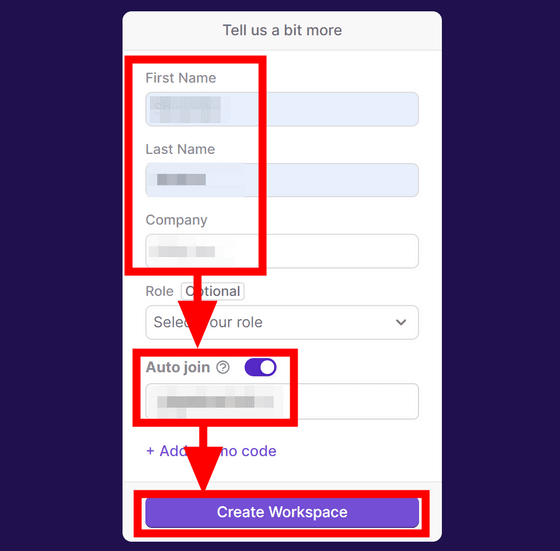
Enter your name and company name. 'Auto join' below is a setting that automatically adds accounts with the same domain part of the email address to Workspace, so it seems good to turn it on when logging in with a company email address. Click Create Workspace.
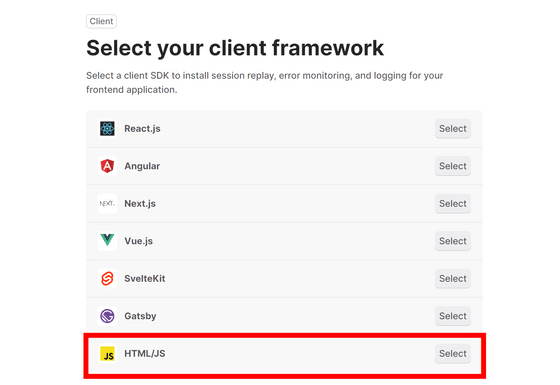
I was told to choose a client side framework. Click 'HTML / JS' this time.
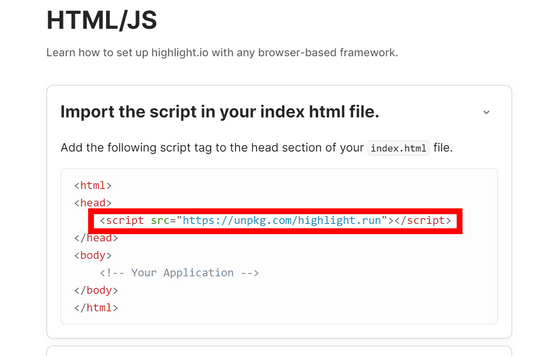
Copy and insert the following code in the head tag of the HTML file.
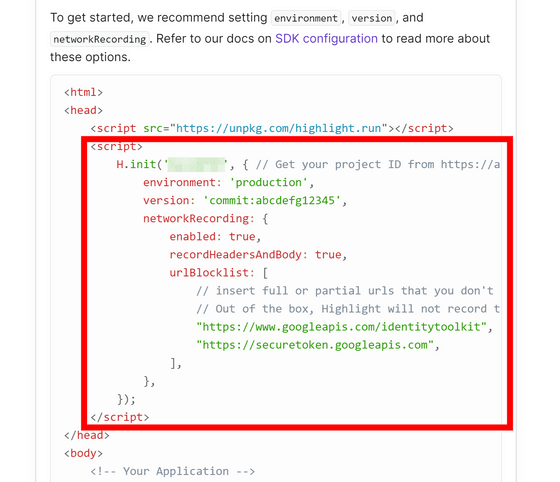
In addition, copy and paste additional code below it and you are ready to go.
Visit the page where you inserted the code, browse normally for a while, then open
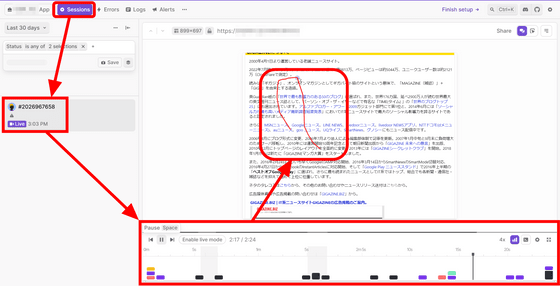
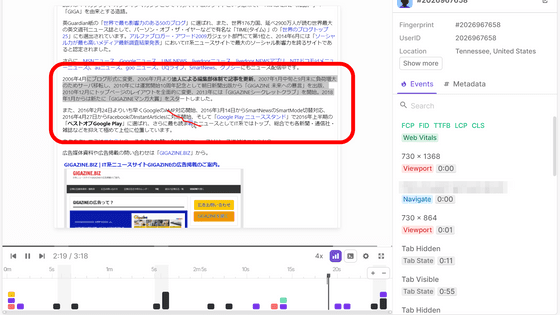
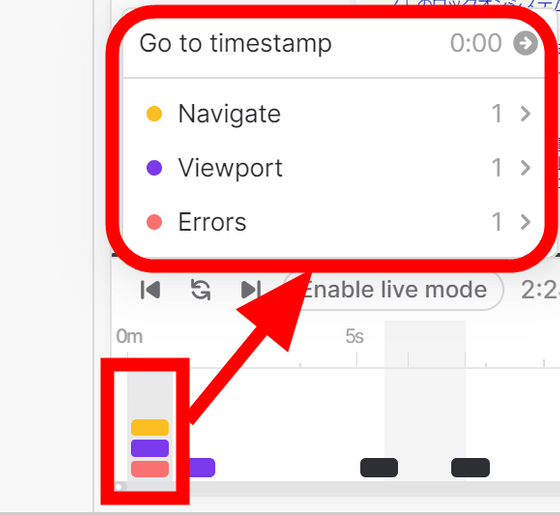
You can also check what events occurred at that time in the timeline. The yellow event is 'Navigate' which means page movement, and the blue-purple event is 'Viewport' event which indicates window size change. A red event means that an error has occurred.
Shown in black is the event 'Tab State'.
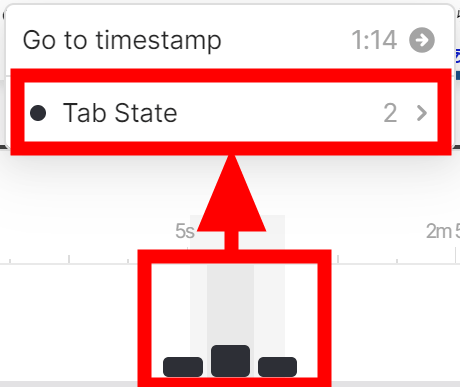
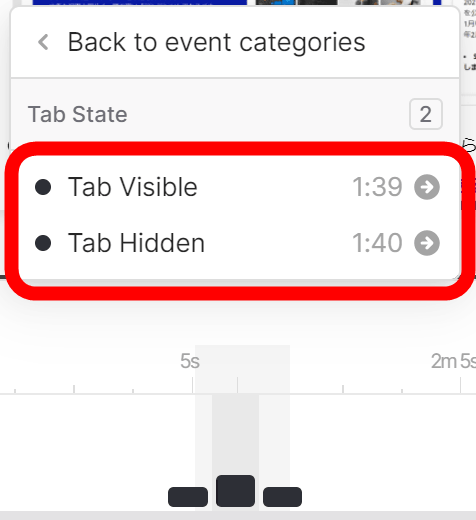
This is an event that indicates if the user is viewing that tab. Events are fired when switching to and from another tab.
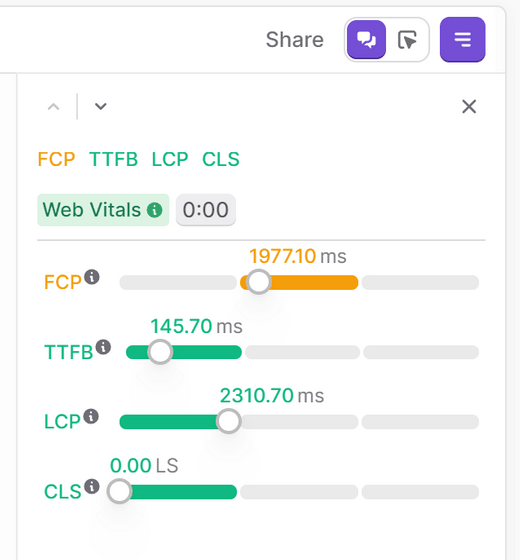
You can also view the list of events in text format by clicking the horizontal line mark button on the upper right. 'Web Vitals' is displayed at the top, which is an indicator of whether the user can browse the page comfortably. Click Web Vitals to check the details.
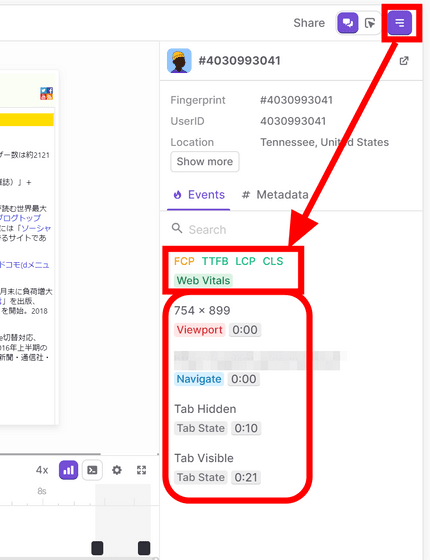
Four indicators of Web Vitals were displayed as shown in the figure below.
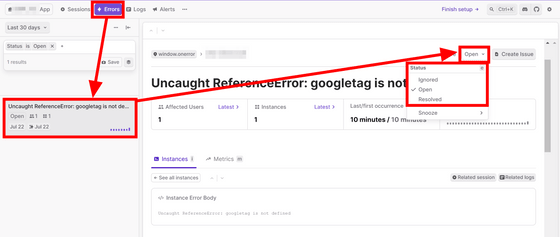
Go to the 'Errors' tab to see any errors that occurred while browsing the page. For each error, you can organize the error column by selecting 'Ignored' or 'Resolved' from 'Open' in the upper right.
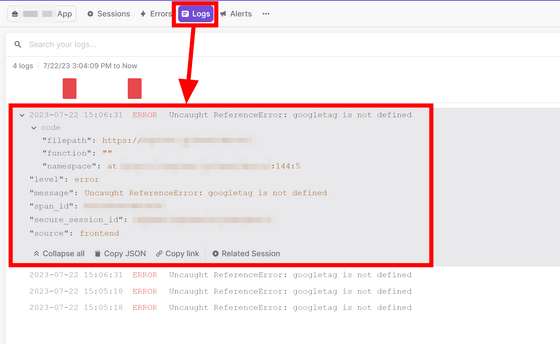
Various logs are stored in the 'Logs' tab. Clicking on a log will show all the information stored in that log, with buttons to copy the data in JSON format, get a link to that log, and navigate to the session where that log occurred.
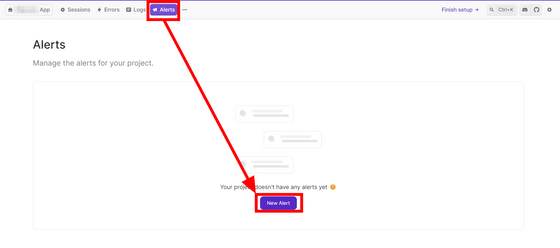
Go to the Alerts tab and click New Alert.
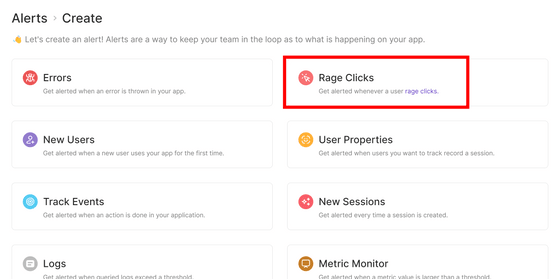
Alerts can be raised in response to various triggers. Click 'Rage Clicks' this time.
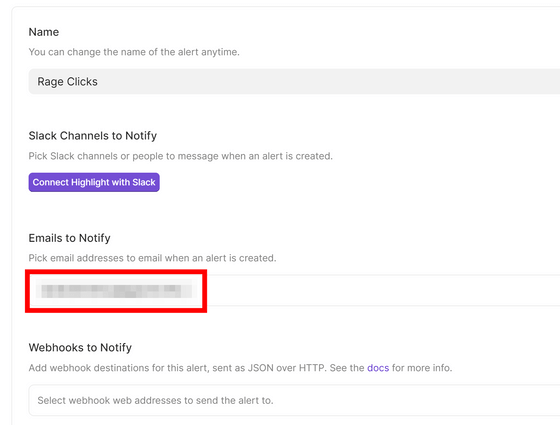
Alerts can be sent to Slack, email, or to specific webhooks. I entered my email address this time.
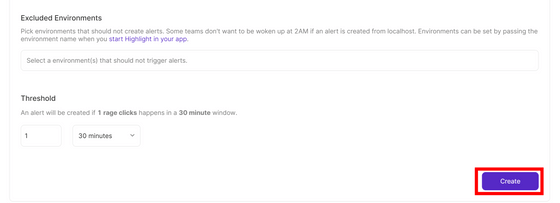
Click 'Create'.
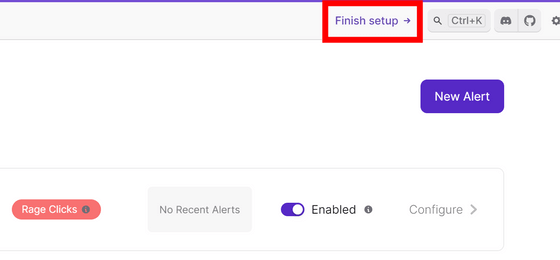
Your alert is now ready.

The definition of
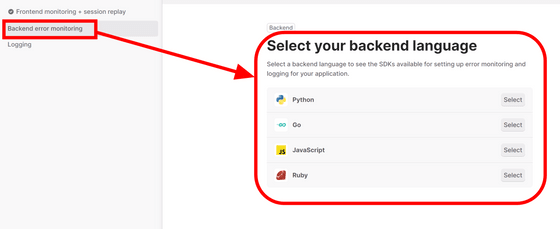
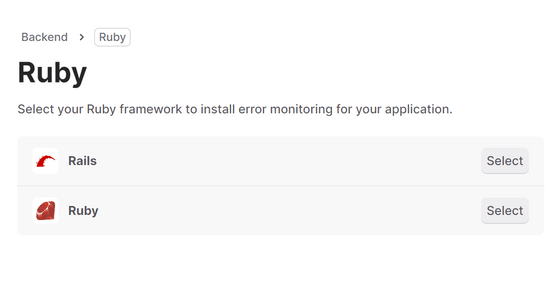
Highlight.io allows you to monitor not only the frontend, but also the backend. It supports four languages: 'Python' 'Go' 'JavaScript' 'Ruby'.
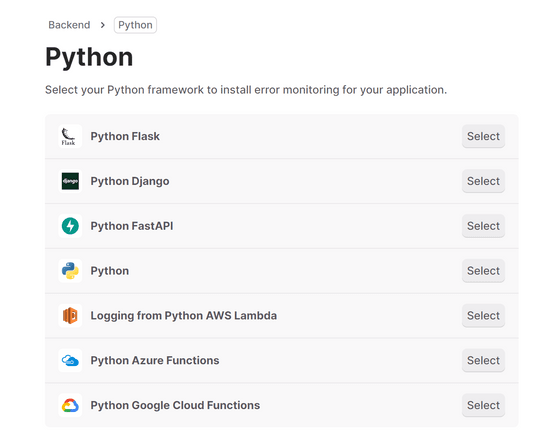
In addition, it supports many frameworks within each language. For Python, there are code samples for Flask, Django, FastAPI, AWS Lambda, Azure Functions, and Google Cloud Functions.
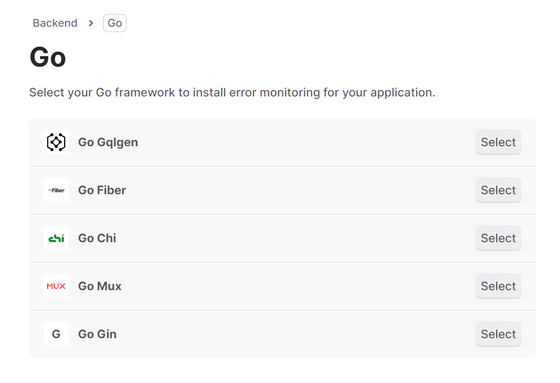
In the case of Go, codes for 'Gqlgen', 'Fiber', 'Chi', 'Mux' and 'Gin' were prepared.
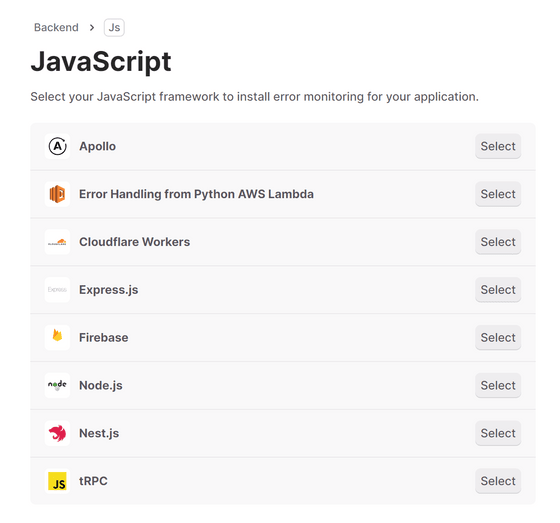
For JavaScript, 'Apollo', 'AWS Lambda', 'Cloudflare Workers', 'Express.js', 'Firebase', 'Node.js', 'Nest.js' and 'tRPC' code are available.
Ruby seems to have code for Rails in addition to code for Ruby itself.
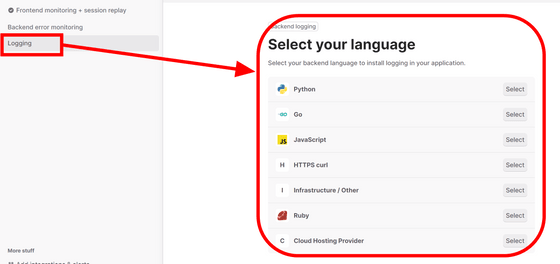
In addition to monitoring, highlight.io can also be used for simply saving logs. The code is also prepared for the four languages ``Python'', ``Go'', ``JavaScript'', and ``Ruby'', but the options ``HTTPS curl'', ``Infrastructure / Other'', and ``Cloud Hosting Provider'' are added.
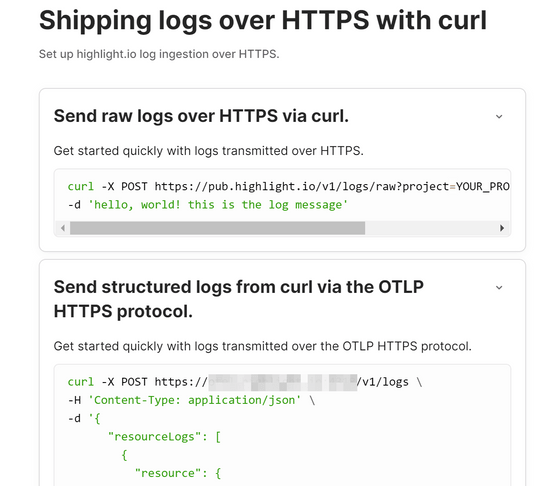
Since the log is simply saved, a method of sending data with a simple HTTPS request using curl or the like can be used. This method seems to work for most applications.
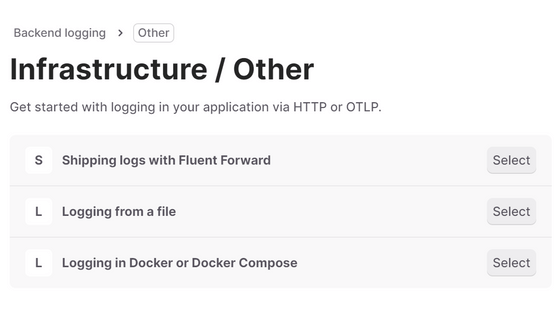
If you check 'Infrastructure / Other', you can see how to import logs from
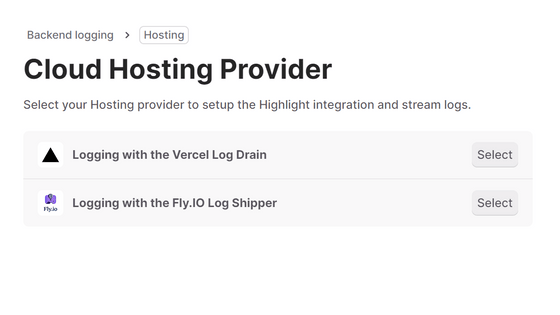
'Cloud Hosting Provider' describes how to get logs in cooperation with Vercel and Fly.IO.
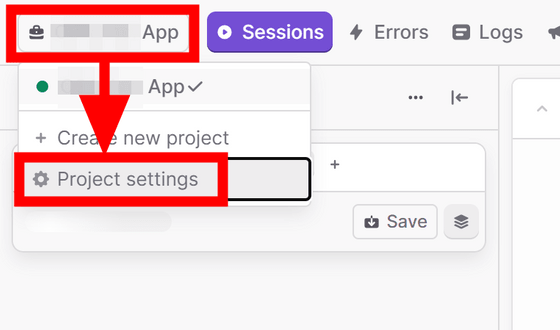
You can also open the project settings by clicking the app name in the upper left and clicking 'Project settings'.
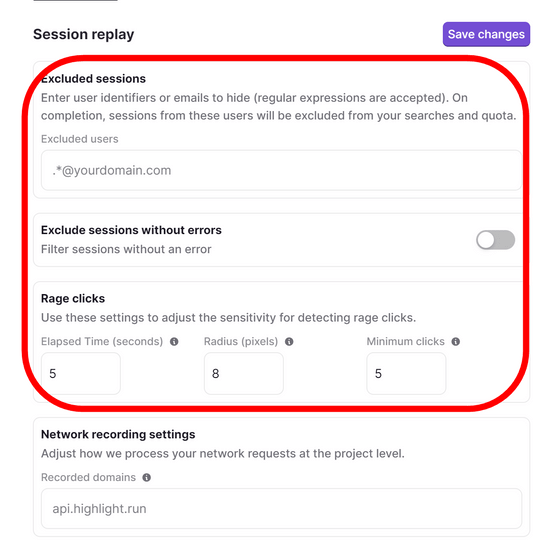
In addition to settings to exclude specific users from session data, settings to exclude sessions in which no errors occurred, parameters for detecting 'Rage clicks' can be set.
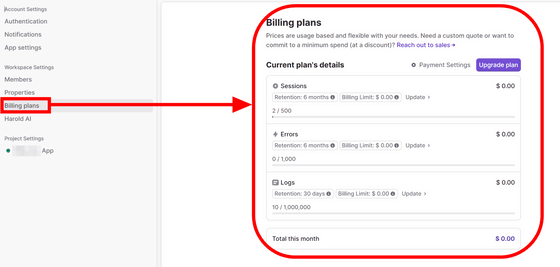
If you select 'Billing plans' from the menu on the left, you can check the usage for that month. When using the highlight.io developer's SaaS service, it is possible to save 500 sessions, save 1000 errors, and save 1 million logs for free every month. Upgrading your plan will remove this limit and you will be charged for the excess while maintaining the free tier. There is no specific cost listed, but you can check the approximate charge for each usage amount on
Related Posts:
in Review, Software, Web Service, Web Application, Posted by log1d_ts
