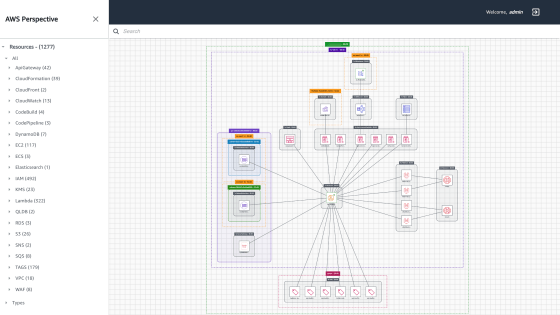
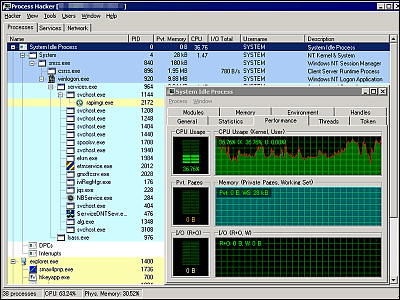
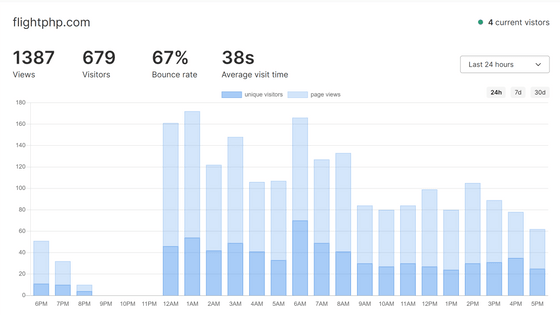
I tried using the open source system monitoring and analysis tool ``SigNoz'' that can acquire and track data from various applications compatible with OpenTelemetry
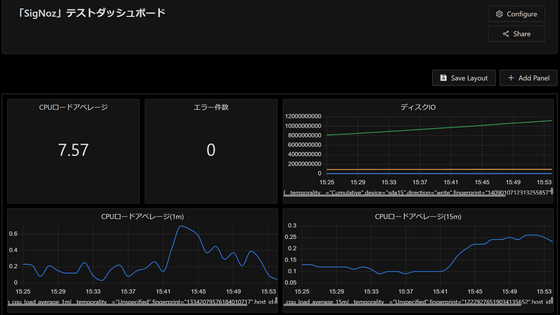
There are many tools for monitoring the
Open source APM | SigNoz
https://signoz.io/
In addition to macOS, SigNoz will work on the following Linux distributions.
・Ubuntu
・Debian
・OpenSuse
・CentOS
・SUSE Linux Enterprise Server (SLES)
Other distributions can also be started via Docker, but this time we will use Debian. First, update each package with the code below.
[code] sudo apt update && sudo apt upgrade -y[/code]
Install git with the command below.
[code]sudo apt install git -y[/code]
Clone the SigNoz repository with the command below.
[code]git clone -b main https://github.com/SigNoz/signoz.git && cd signoz/deploy/[/code]
Then run the install script with the following command.
[code]./install.sh[/code]
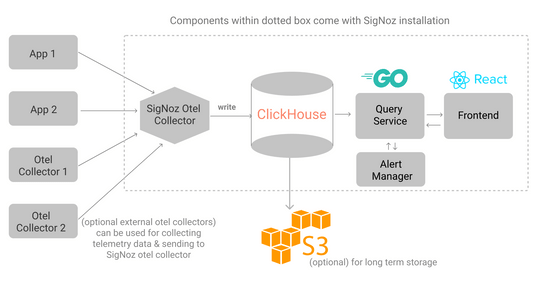
The image of the operation of SigNoz is as shown in the figure below. It says that the install script will install the components within the dotted border.
You will be asked for confirmation during the installation, so press Enter to continue.

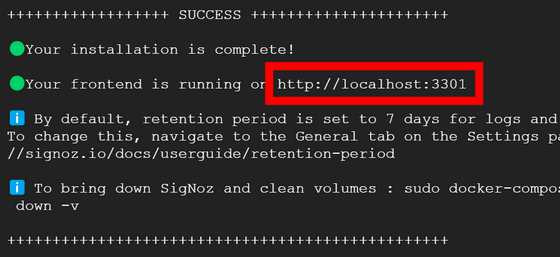
When the installation is completed, the following screen will be displayed, so start the browser and access 'localhost:3301'.
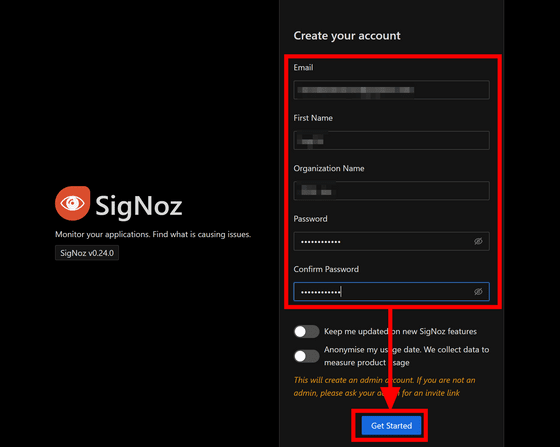
Enter 'e-mail address' 'name' 'organization name' 'password' and click 'Get Started'.
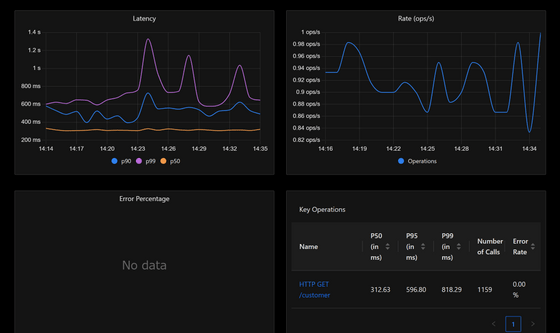
SigNoz has dummy data as a sample from the beginning, and when you log in, various apps are displayed in the service list as shown in the figure below. This time, we will use this dummy data to check how SigNoz displays the data. Click on the 'customer' application.
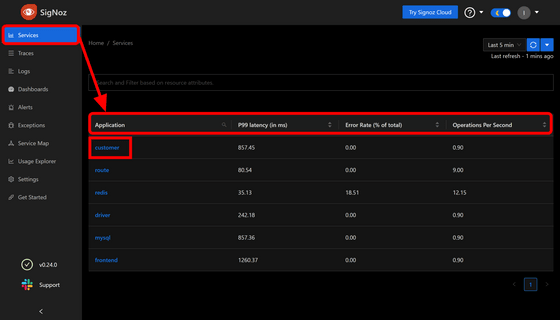
You can check latency, number of operations per second, and error rate on the application screen. The name of the operation that specifically occurred is also displayed in list format.
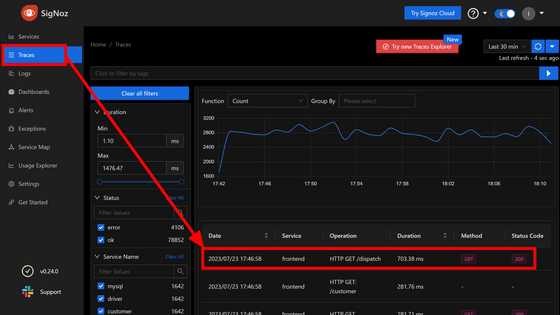
In system monitoring and tracking, system work is managed in units called 'spans.' On the 'Traces' tab, you can check the detailed contents for each span. From the list of spans, click the span for the operation 'HTTP GET /dispatch'.
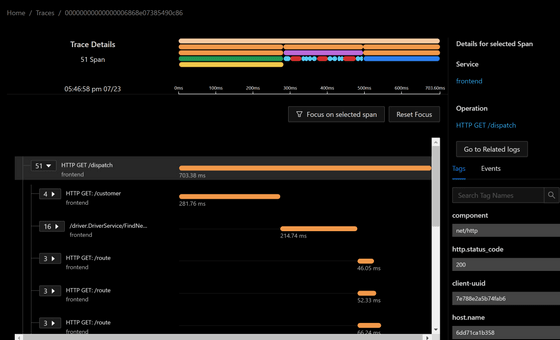
You can check detailed information about which work took how long within that span.
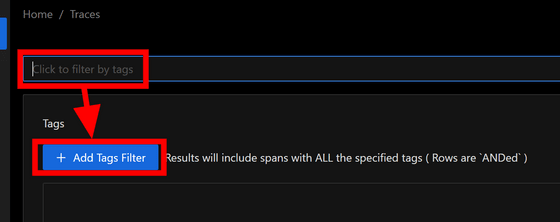
You can also filter the list of spans. Click 'Click to filter by tags' at the top of the Traces tab and click 'Add Tags Filter'.
When you click the Tags field, candidate elements for filtering appear, so select the content you want to narrow down. The format of this part follows
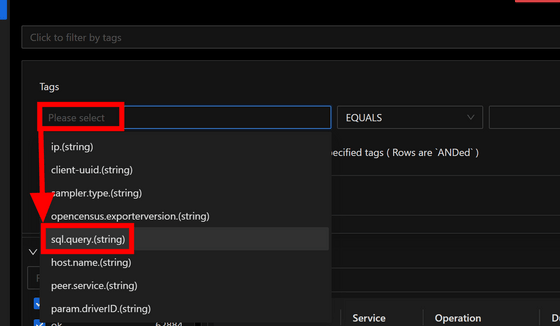
Then select a comparison operator. 'EQUALS' 'NOT EQUALS' 'IN' 'NOT IN' 'EXISTS' 'NOT EXISTS' 'STARTS WITH' 'NOT STARTS WITH' 'CONTAINS' 'NOT CONTAINS' can be selected. Click 'EQUALS' this time.
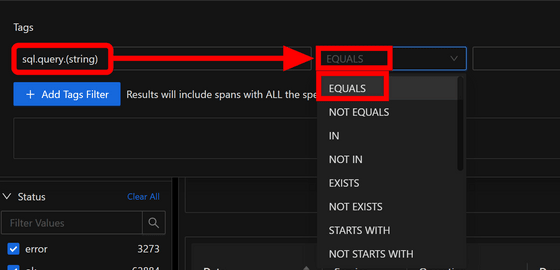
If you click the blank on the right end, SigNoz will give you a candidate, so click on the desired one.

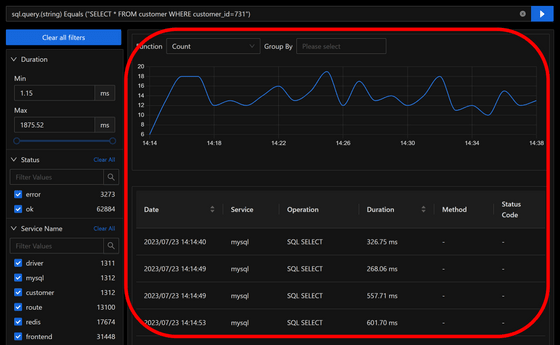
Now click 'Run Query' OK.

Now only those that match the content of the query are displayed.
On the 'Logs' tab, you can check the number of logs and their specific contents.
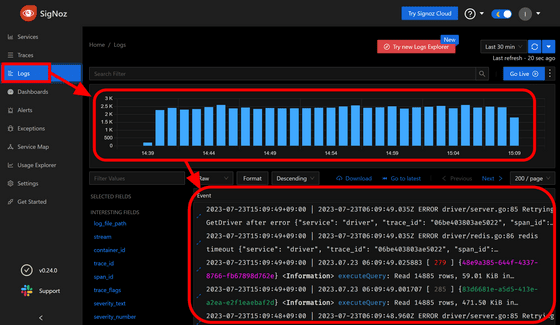
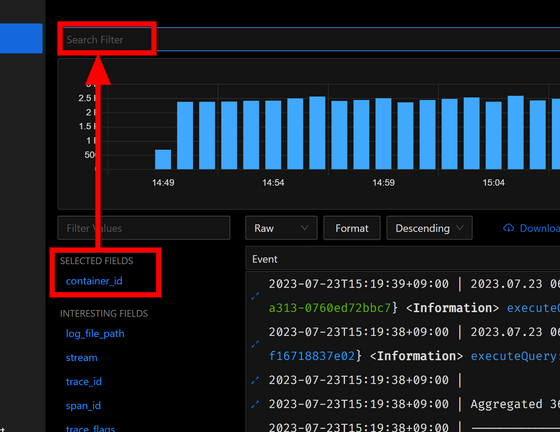
It is also possible to filter the logs. Since the list of fields is displayed in the lower left, click the field you want to narrow down to display it in 'SELECTED FIELDS' and then click 'Search Filter'.
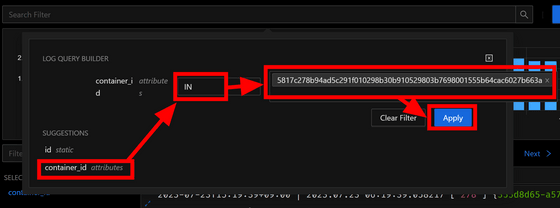
A field will appear in SUGGESTIONS, click on it, select an operator and paste the value. In addition to 'IN' 'NIN (Not IN)', the operator can select 'GTE (≥)' 'GT (>)' 'LTE (≤)' 'LT (<)' 'CONTAINS' 'NCONTAINS'. Click 'Apply' when you are done.
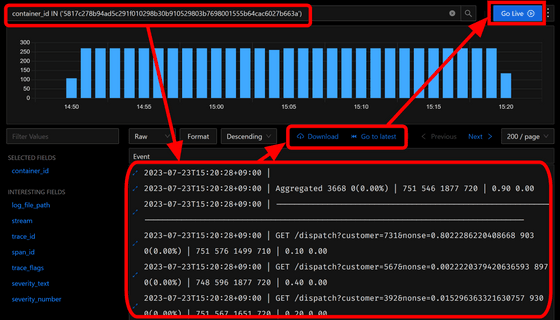
Now only the logs that match your selection are displayed. In addition to buttons to download log data and display the latest log data, it is also possible to update the screen in real time by clicking 'Go Live'.
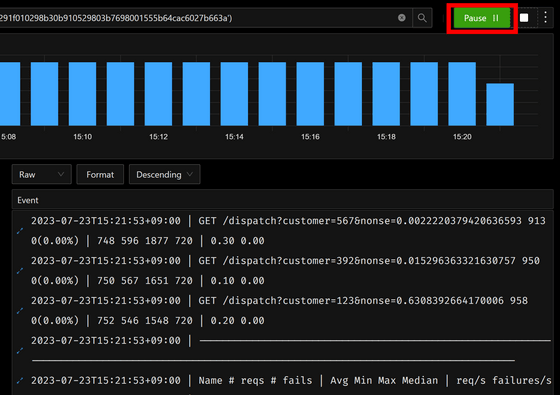
Since the log will continue to flow during real-time updating, it seems necessary to stop with 'Pause' when you want to check the details.
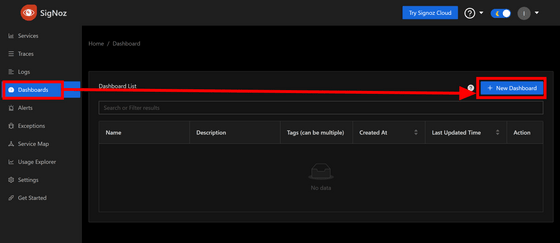
The Dashboard tab allows you to manage your dashboard. Click 'New Dashboard'.
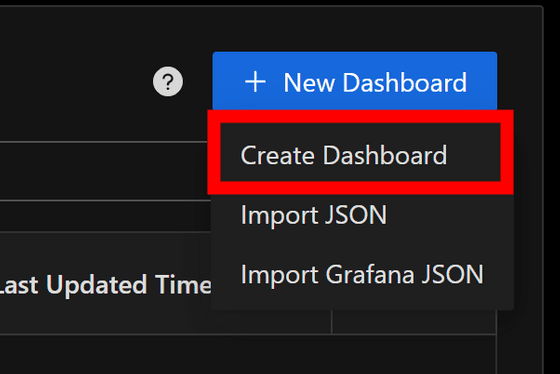
It is also possible to import a dashboard using JSON data or Grafana's JSON data, but this time we will create a new one by clicking 'Create Dashboard'.
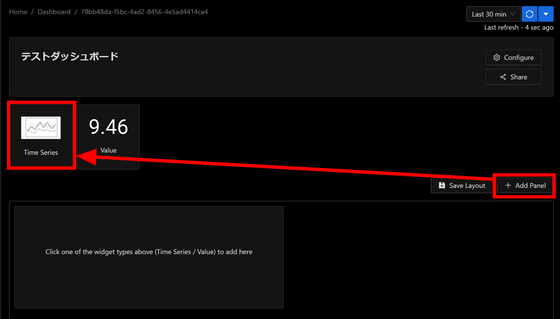
Click 'Add Panel' and you will be asked if you want to add graphs or values. Click on the graph this time.
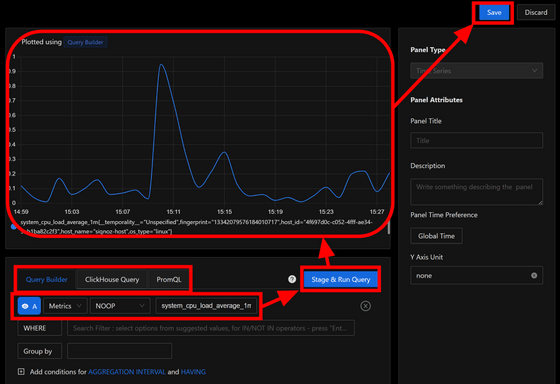
Set up your query at the bottom of the screen and click Stage & Run Query to see a preview. If there is no problem, click 'Save'.
Click OK to confirm.
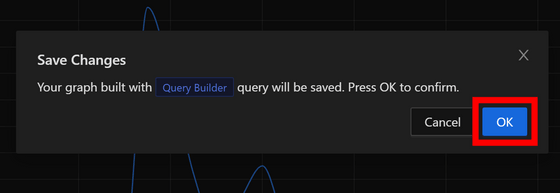
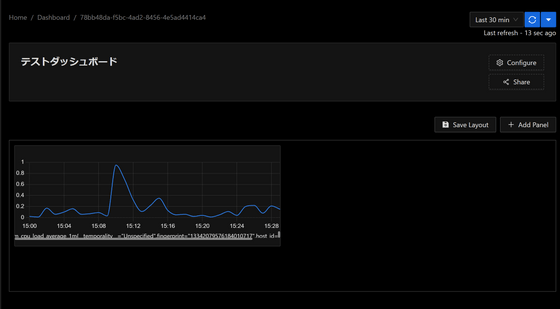
By continuing the same procedure, you can create a dashboard that collects only the data you need.
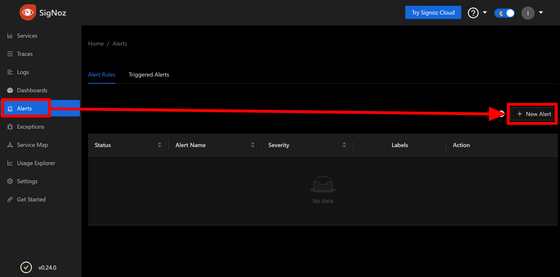
You can set alerts on the 'Alerts' tab. Click 'New Alert'.
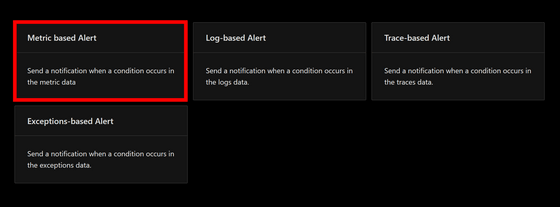
Alerts can be set based on four elements: 'Metric', 'Log', 'Trace' and 'Exceptions'. This time, click 'Metric based Alert'.
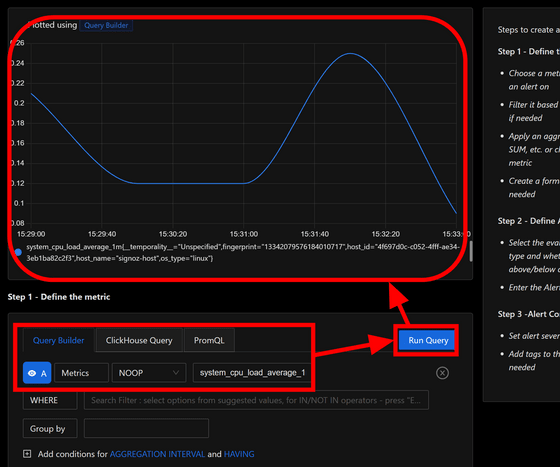
Query the metrics you want to alert on and click Run Query to preview the graph.
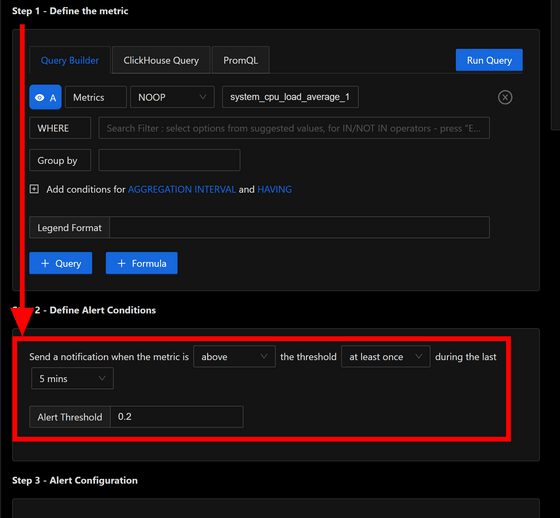
Scroll down and set the threshold that triggers the alert. This time, I set it as 'alert occurs when there is a moment exceeding 0.2 in the past 5 minutes'.
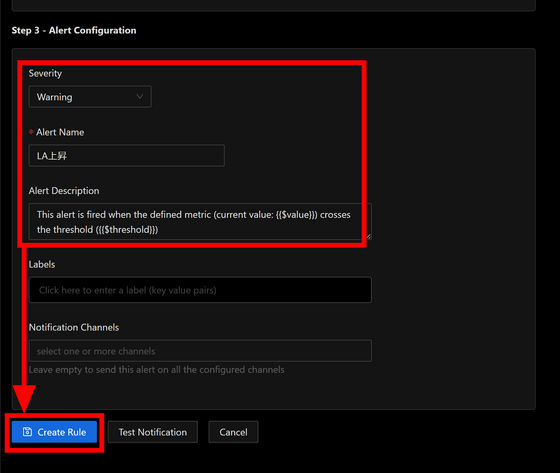
Enter the severity, name and description and click 'Create Rule'.
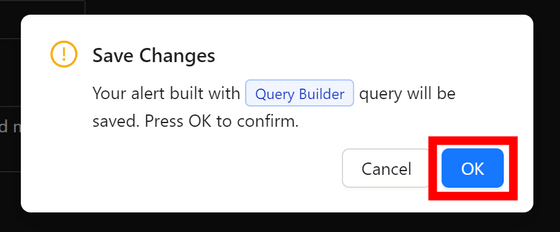
Click 'OK' for confirmation.
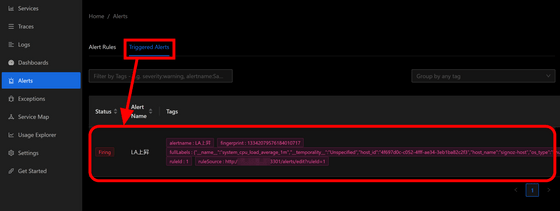
Click 'Triggered Alerts' and you can see that an alert has occurred.
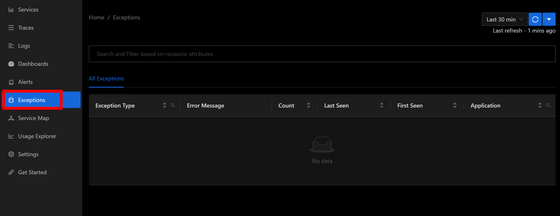
The 'Exceptions' tab displays information about exceptions that have occurred in the application. It is said that information such as stack traces can be viewed here, but it seems that exceptions do not occur in the demo data.
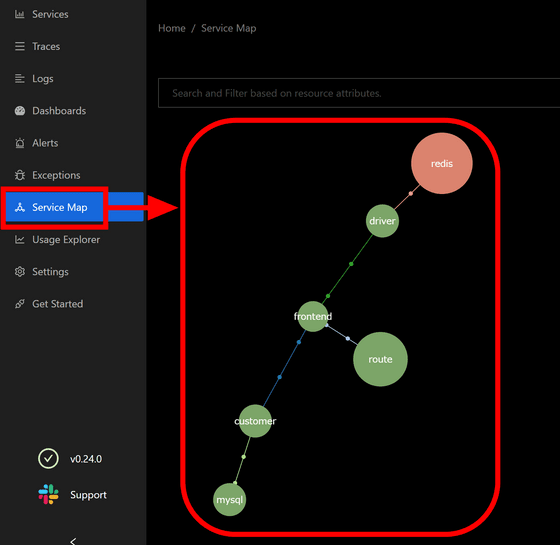
The 'Service Map' tab displays a graph of the dependencies between the components that make up the service.
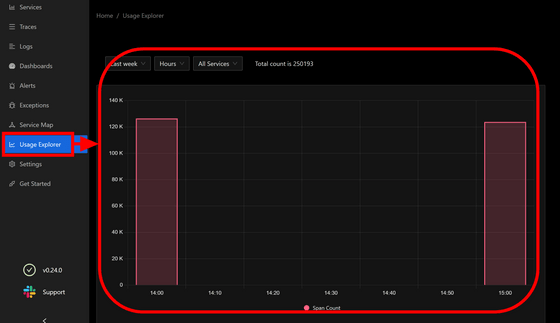
On the 'Usage Explorer' tab, you can check the usage amount for each hour and day.
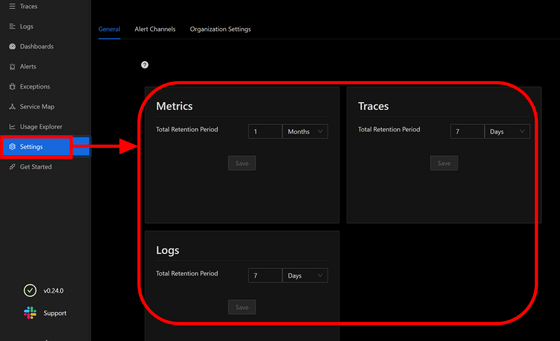
You can set the retention period for Metrics, Traces, and Logs on the 'Settings' tab.
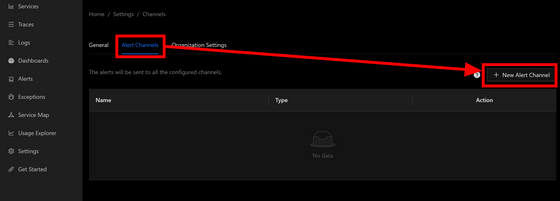
In addition, you can set the contact route when an alert occurs on the 'Alert Channels' page. Click 'New Alert Channel'.
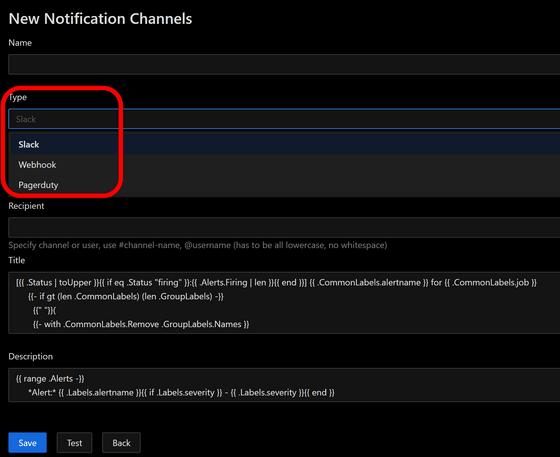
It is possible to notify in three ways: 'Slack', 'Webhook' and 'Pagerduty'.
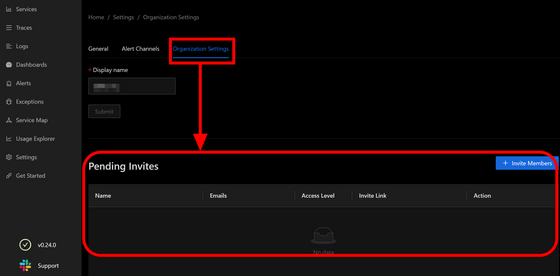
'Organization Settings' allows you to manage your team members.
'Get Started' at the bottom provides guides for introducing OpenTelemetry into applications written in each language. After deleting the demo data according to
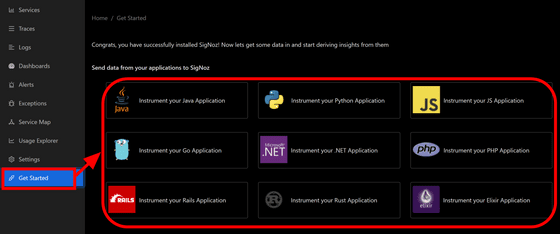
In the OpenTelemetry document , the support status for each language is as follows.
| Language | Traces | Metrics | Logs |
|---|---|---|---|
| C++ | Stable | Stable | Experimental |
| C#/.NET | Stable | Stable | Mixed* |
| Erlang/Elixir | Stable | Experimental | Experimental |
| Go | Stable | Beta | Not yet implemented |
| Java | Stable | Stable | Stable |
| JavaScript | Stable | Stable | Development |
| PHP | Beta | Beta | Alpha |
| Python | Stable | Stable | Experimental |
| Ruby | Stable | Not yet implemented | Not yet implemented |
| Rust | Beta | Alpha | Not yet implemented |
| Swift | Stable | Experimental | In development |
Related Posts:
in Software, Web Service, Review, Web Application, Posted by log1d_ts
