'GoAccess' review that allows you to visualize website access logs with a single command on a terminal or web browser
Many people are using
GoAccess-Visual Web Log Analyzer
https://goaccess.io/
This time I will install GoAccess on Ubuntu 18.04. To install the latest version, execute the following command.
[code]echo 'deb http://deb.goaccess.io/ $(lsb_release -cs) main' | sudo tee -a /etc/apt/sources.list.d/goaccess.list
wget -O-https://deb.goaccess.io/gnugpg.key | sudo apt-key add-
sudo apt-get update
udo apt-get install goaccess[/code]
Since GoAccess is software that visualizes log files, it is necessary to specify the log file format and execute the command. If you want to analyze Apache or Nginx logs on the terminal, specify '--log-format=COMBINED' as an option and execute the following command. The logs that can be visualized can be confirmed on the GoAccess manual page .
[code]goaccess log file path -c --log-format=COMBINED[/code]
When the command was executed, the visualized access status dashboard was displayed on the terminal.
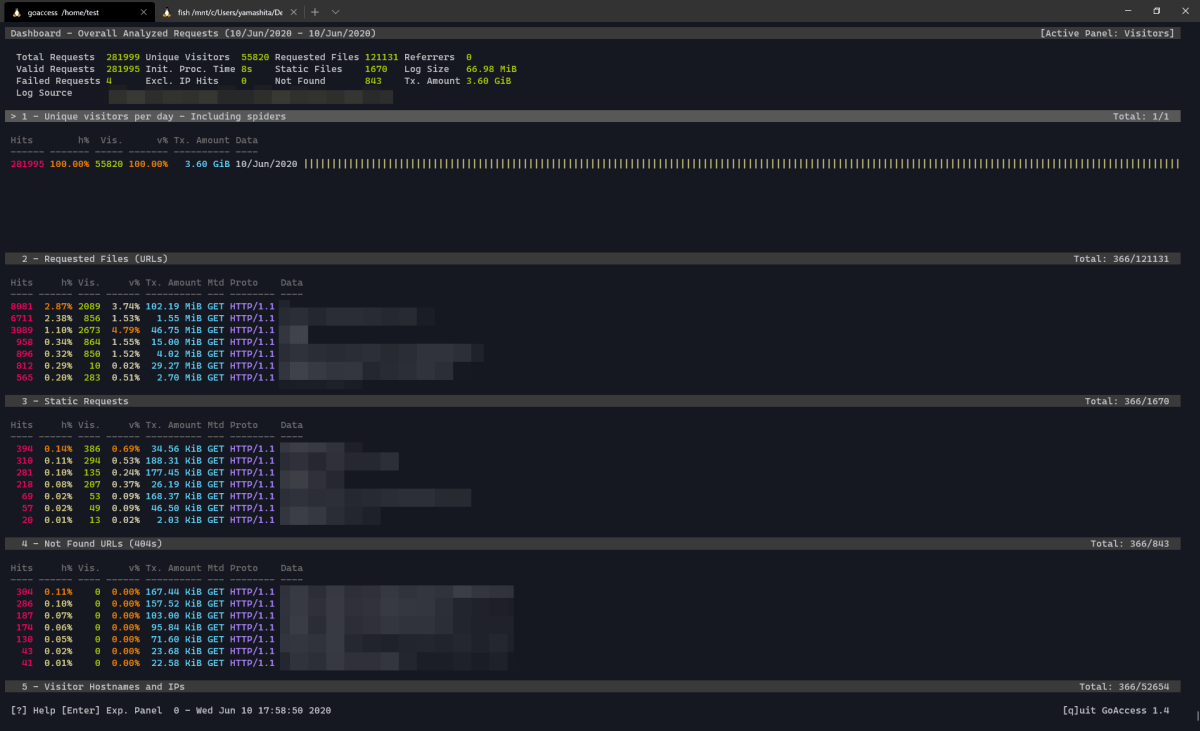
In addition to the total number of requests and unique users on the dashboard...
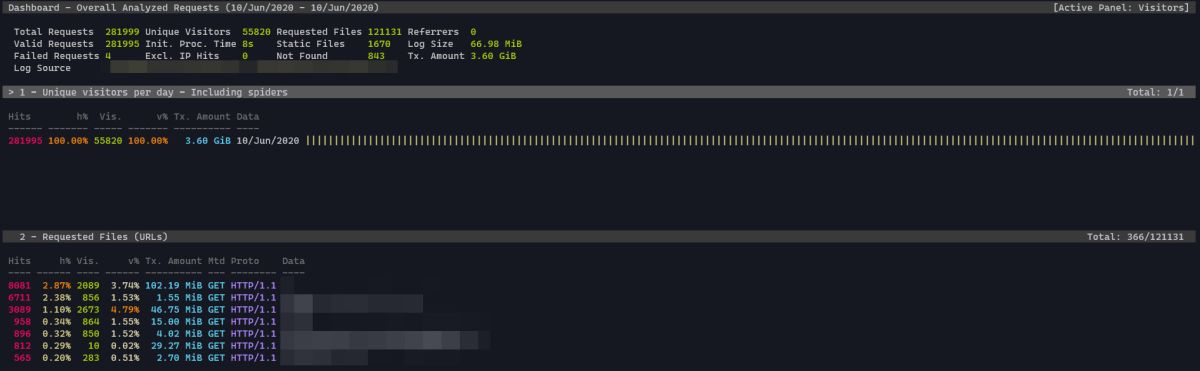
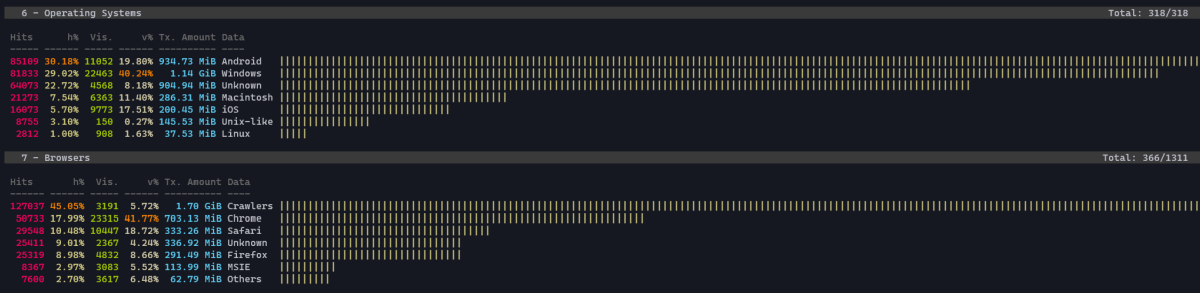
Any information that remains in the access log, such as the OS and browser from which it was accessed, makes it visible. In addition, since you can specify multiple log files, you can also check the access logs of different web servers.
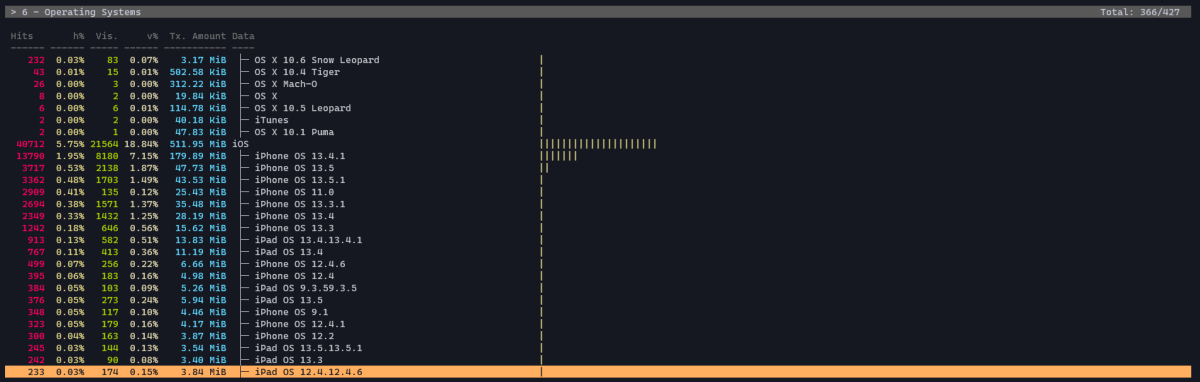
By pressing the 'Tab' key, you can advance the items to be displayed. Detailed information can be displayed by pressing the '→' key with the item selected.

Page down with the 'J' key and press the 'G' key to return to the beginning.
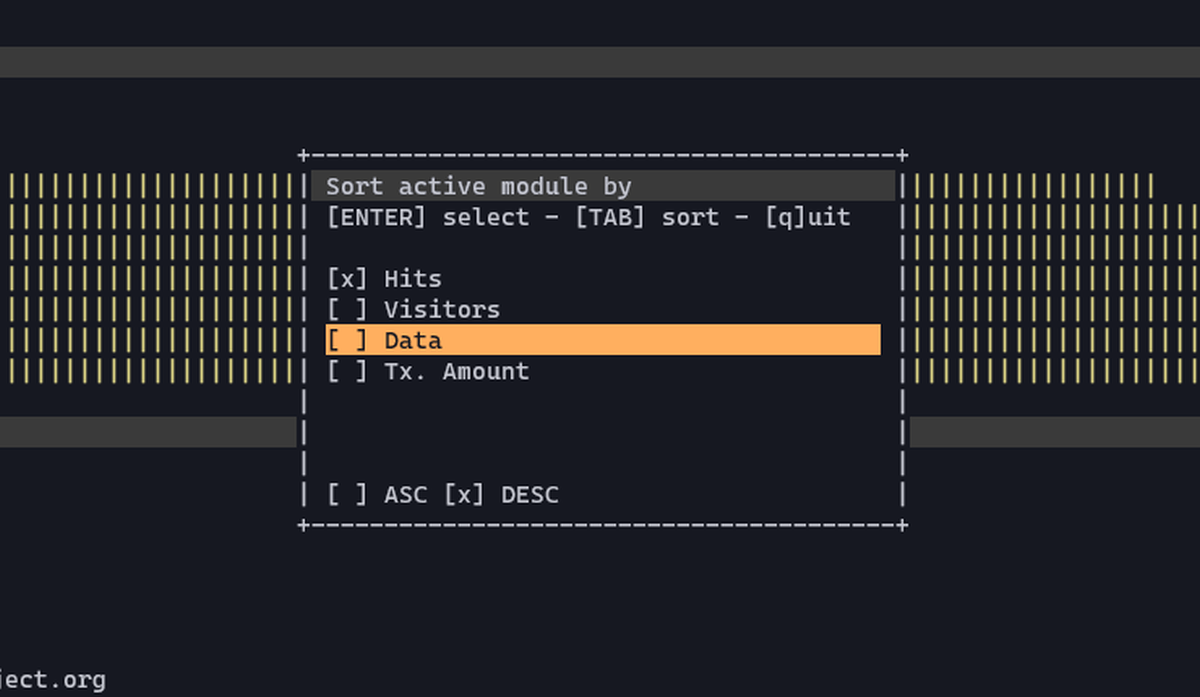
Sort condition can be selected from 'Number of hits', 'Number of visitors', 'Transfer amount', and 'Name'. You can also select ASC (ascending order) or DESC (descending order).
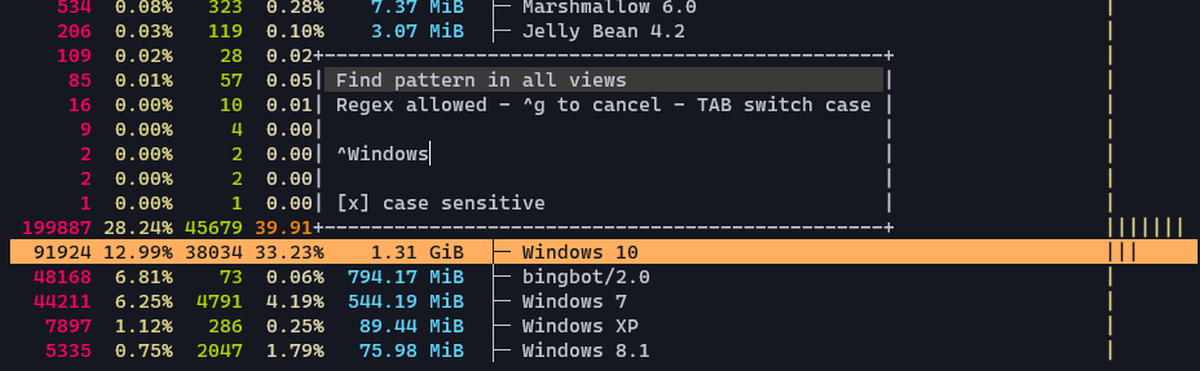
You can search for a character string with a regular expression by pressing the '/' key.
GoAccess can display the dashboard not only on the terminal but also on the web browser. In that case, specify '-o output HTML path' instead of '-c' option and execute the command.
[code]goaccess Log file path -o Output HTML path --log-format=COMBINED[/code]
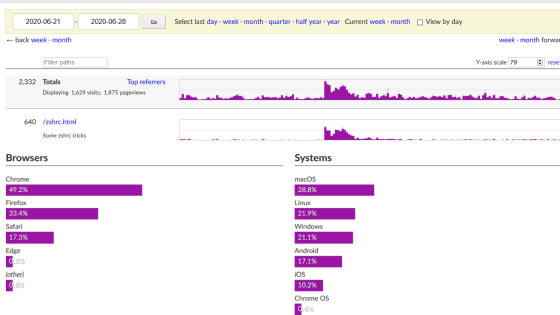
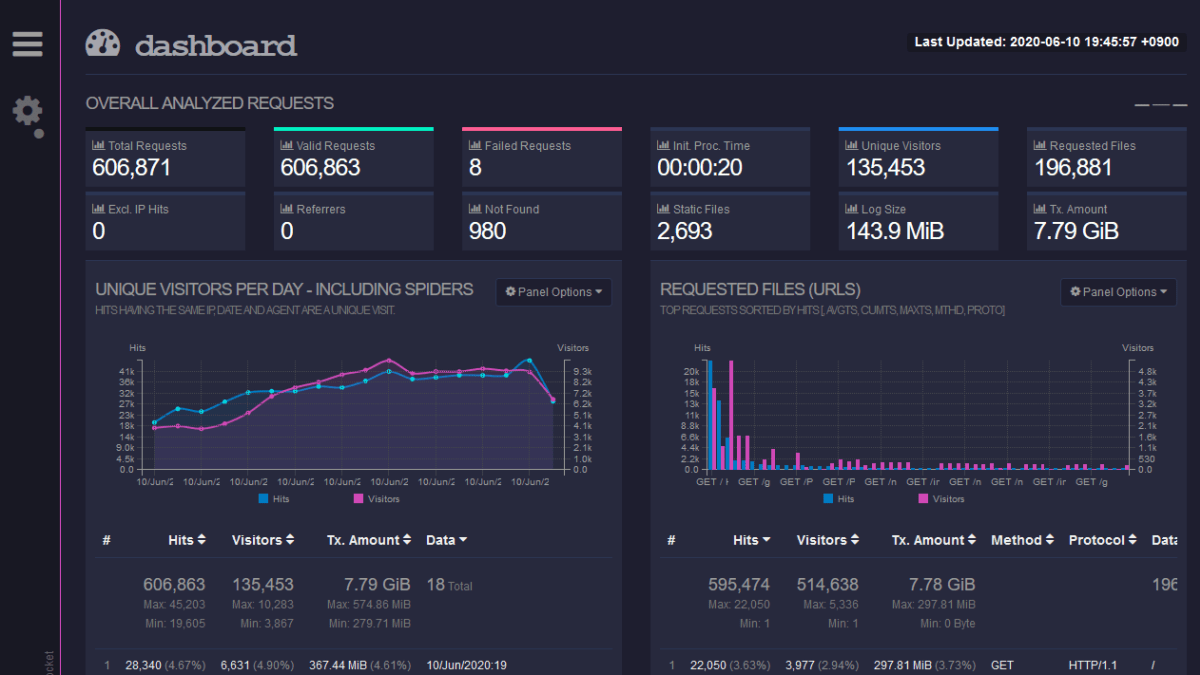
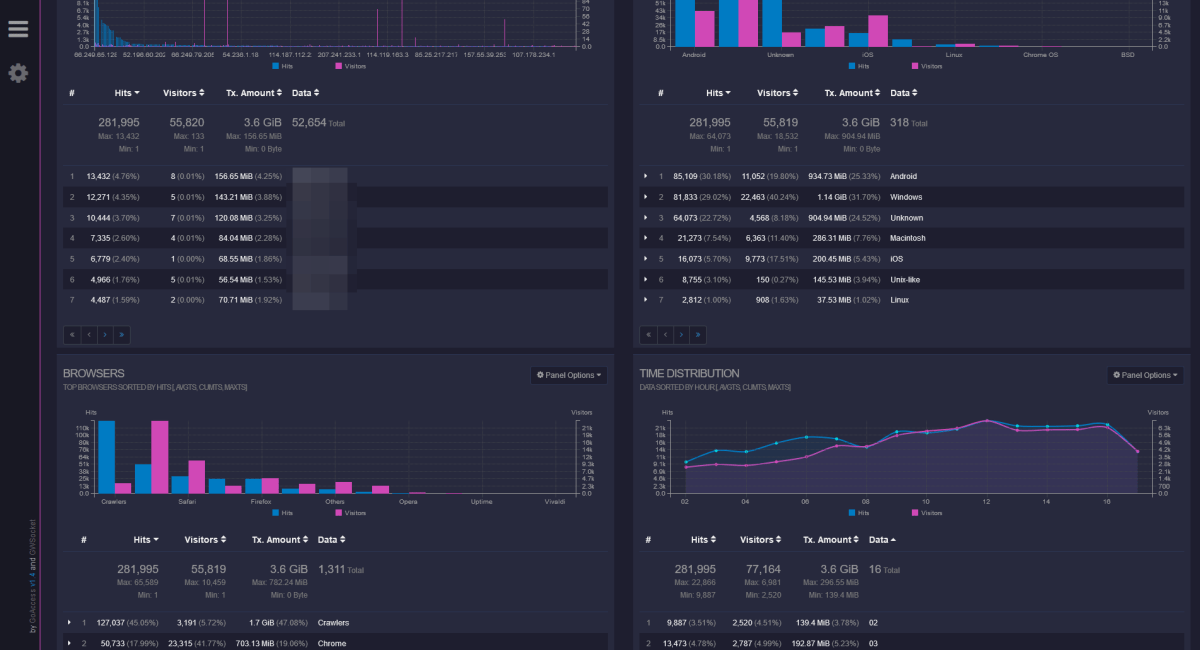
When the output HTML was displayed on the browser, a dashboard was displayed that made the information displayed on the terminal easier to see by using graphs.
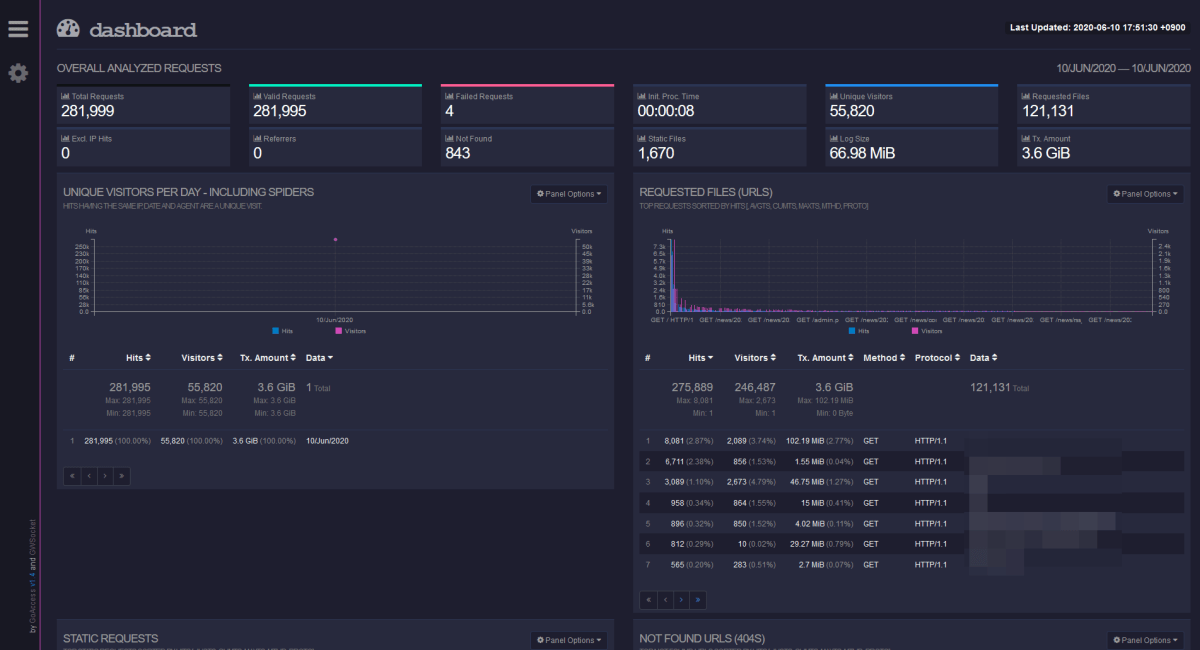
The bar chart and line chart are properly used according to the data to be displayed from the beginning.
By clicking 'Panel Options', you can change the type of graph and data to be displayed.
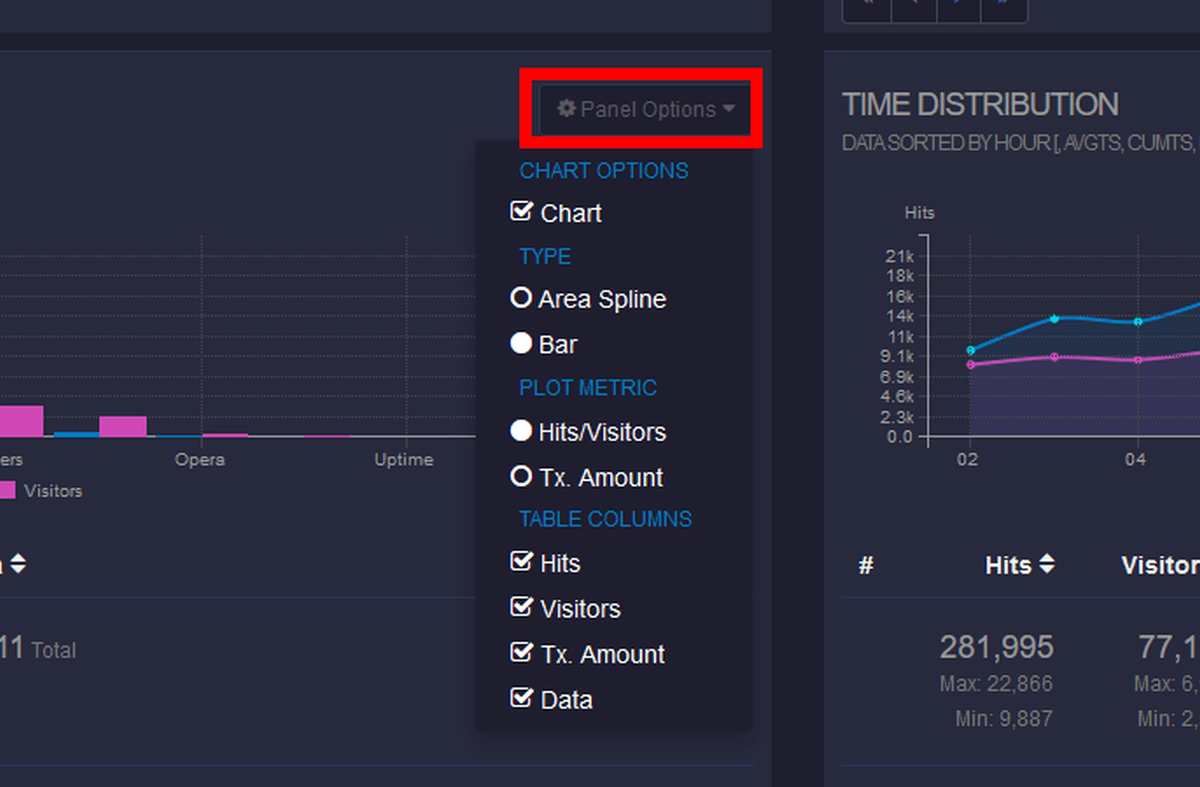
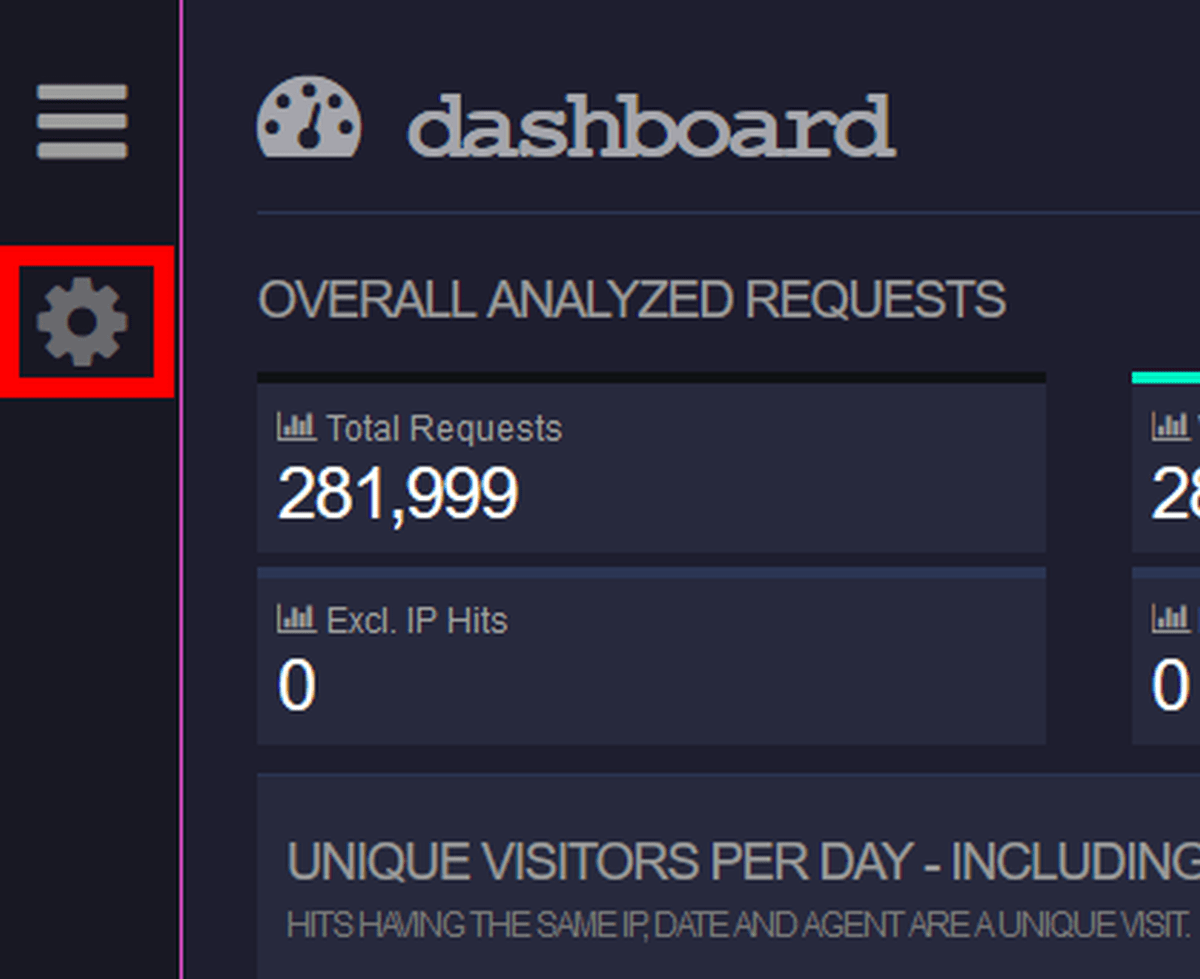
Click the red frame on the upper left to customize the entire dashboard.
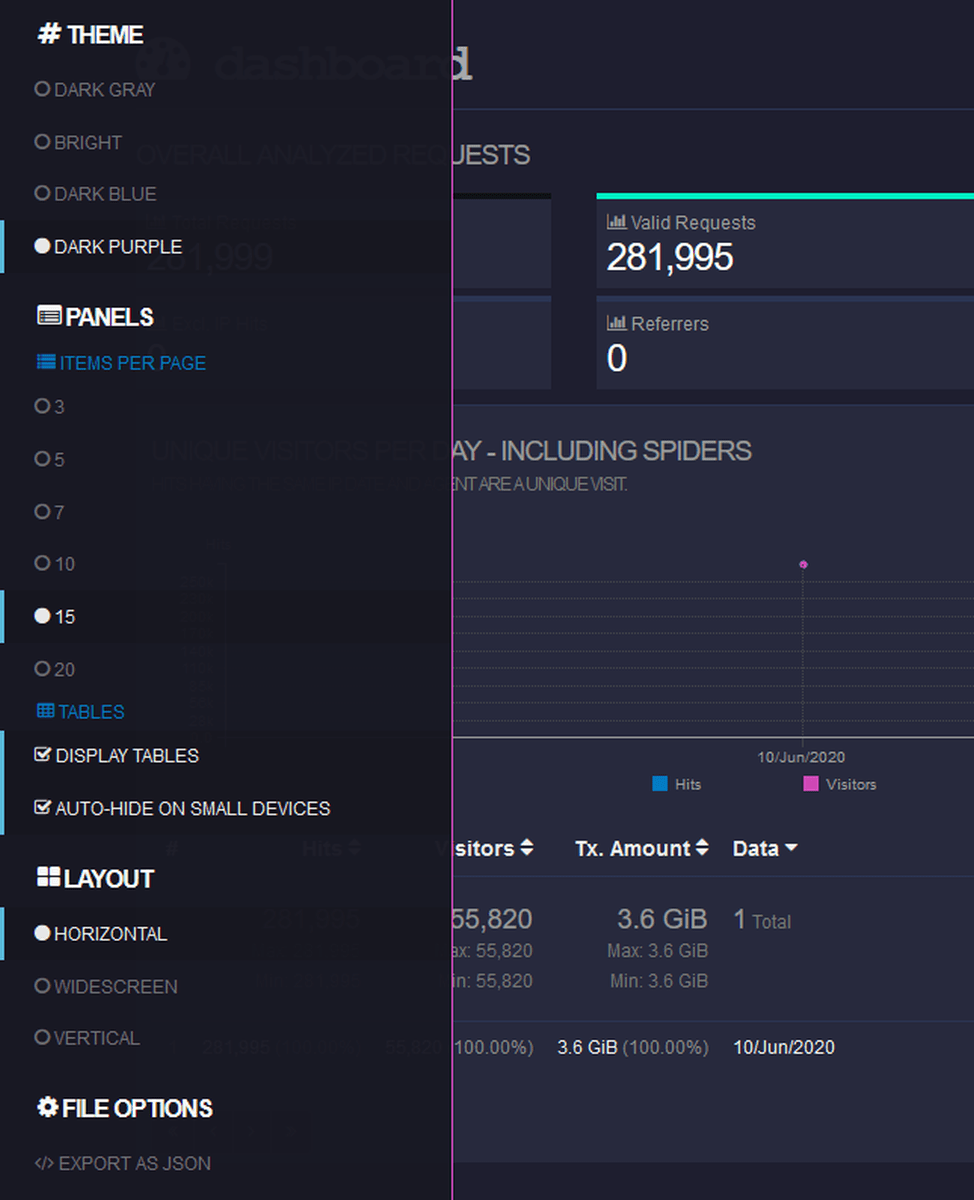
You can set the color of panels, the number of panels displayed on one page, and whether to show or hide tables.
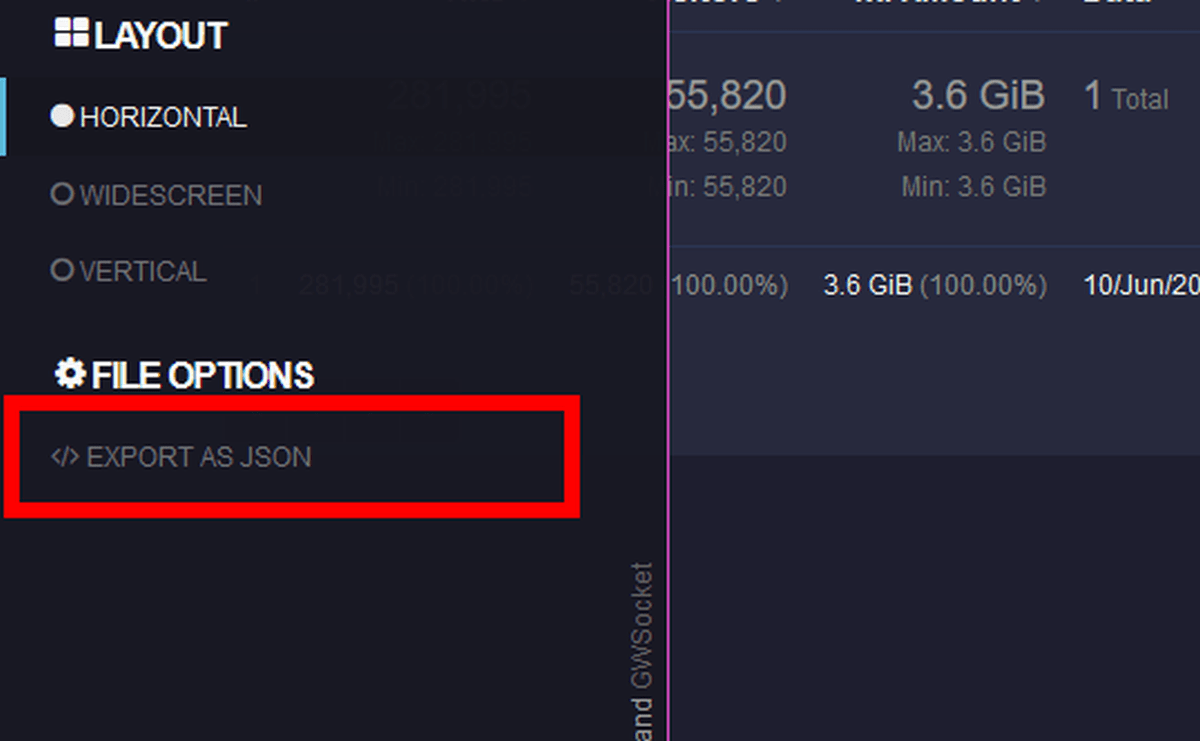
You can also output the dashboard information in JSON format by clicking 'EXPORT AS JSON'.
You can update the dashboard in real time by adding the '--real-time-html' option when running the command.
[code]goaccess Log file path -o Output HTML path --log-format=COMBINED --real-time-html[/code]
GoAccess itself does not have a function to collect logs from multiple servers. When using it in multiple server configurations, it seems convenient to use rsyslog etc. to collect logs in one place and visualize it with GoAccess.
Related Posts: