'Moloch' that can constantly and graphically monitor a large-scale network with free and open source

'
Moloch
https://molo.ch/
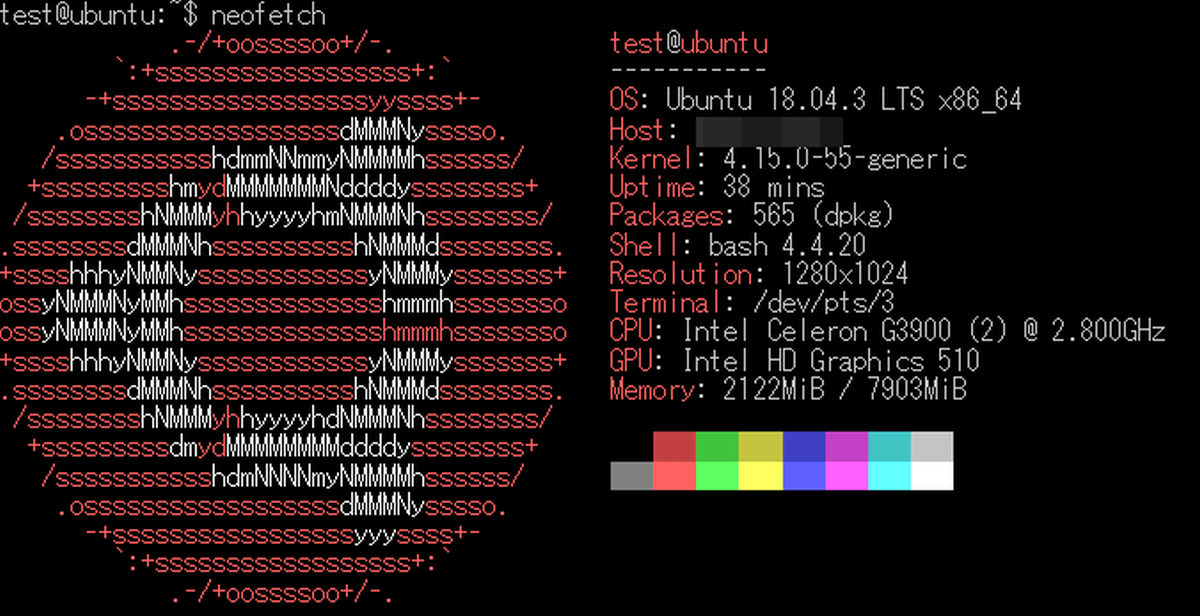
At the time of writing the article, pre-compiled packages are provided for CentOS 6/7/8 and Ubuntu 16.04 / 18.04, so this time I will install Moloch on Ubuntu 18.04.
Moloch uses the search engine
[code] docker pull docker.elastic.co/elasticsearch/elasticsearch: 7.6.2
docker run -d --name elasticsearch -p 9200: 9200 -p 9300: 9300 -e 'discovery.type = single-node' docker.elastic.co/elasticsearch/elasticsearch: 7.6.2 [/ code]
First, download the compiled package of Moloch.
[code] wget https://s3.amazonaws.com/files.molo.ch/builds/ubuntu-18.04/moloch_2.2.3-1_amd64.deb [/ code]
Install the downloaded package.
[code] sudo dpkg -i moloch_2.2.3-1_amd64.deb [/ code]
If the dependent package does not exist and the installation fails, resolve the dependency and install again.
[code] sudo apt --fix-broken install
sudo dpkg -i moloch_2.2.3-1_amd64.deb [/ code]
After the installation is complete, launch the setting script.
[code] sudo / data / moloch / bin / Configure [/ code]
Set the interface to be monitored and the URL of Elasticsearch.
[code] Found interfaces: docker0; enp5s0; lo; veth5d2f091
Semicolon';' seperated list of interfaces to monitor [eth1] enp5s0 # Specify the interface to monitor
Install Elasticsearch server locally for demo, must have at least 3G of memory, NOT recommended for production use (yes or no) [no]
Elasticsearch server URL [http: // localhost: 9200] #Specify the URL of Elasticsearch
Password to encrypt S2S and other things [no-default] no-default
Moloch --Creating configuration files
Not overwriting /data/moloch/etc/config.ini, delete and run again if update required (usually not), or edit by hand
Installing systemd start files, use systemctl
Download GEO files? (yes or no) [yes]
Moloch --Downloading GEO files
2020-04-29 16:43:04 URL: https://www.iana.org/assignments/ipv4-address-space/ipv4-address-space.csv [23322/23322]-> 'ipv4-address-space' .csv '[1]
2020-04-29 16:43:14 URL: https://raw.githubusercontent.com/wireshark/wireshark/master/manuf [1700105/1700105]-> 'oui.txt' [1]
Moloch --Configed --Now continue with step 4 in /data/moloch/README.txt [/ code]
Next, create a database in Elasticsearch.
[code] /data/moloch/db/db.pl http: // localhost: 9200 init [/ code]
Set Moloch's administrative user and password.
[code] /data/moloch/bin/moloch_add_user.sh admin 'Admin User' password --admin [/ code]
Start the Moloch service.
[code] sudo systemctl start molochcapture
sudo systemctl start molochviewer [/ code]
'Http: //
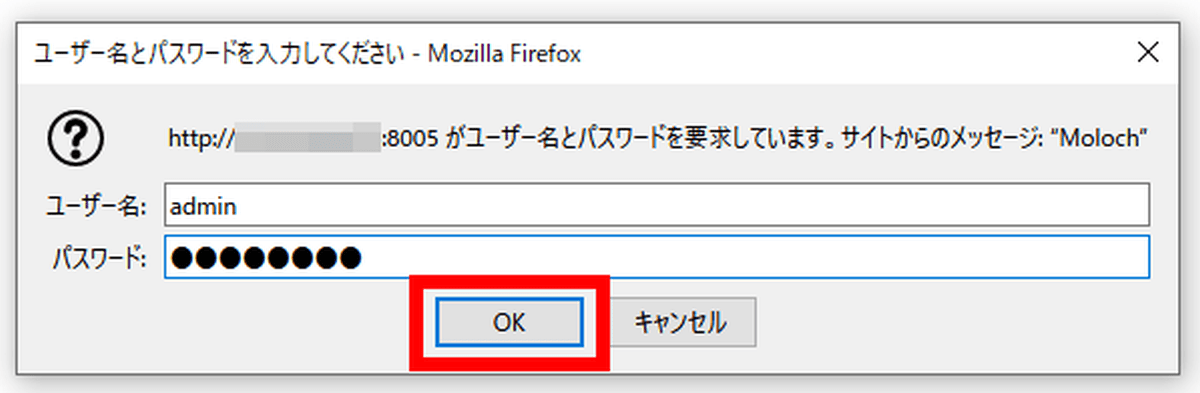
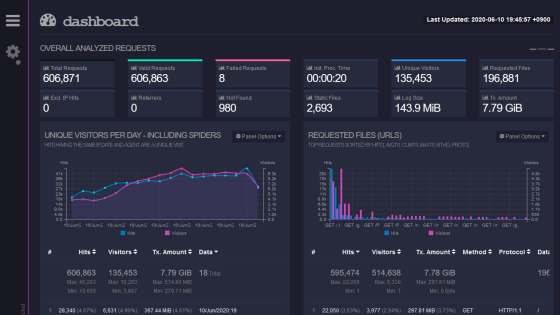
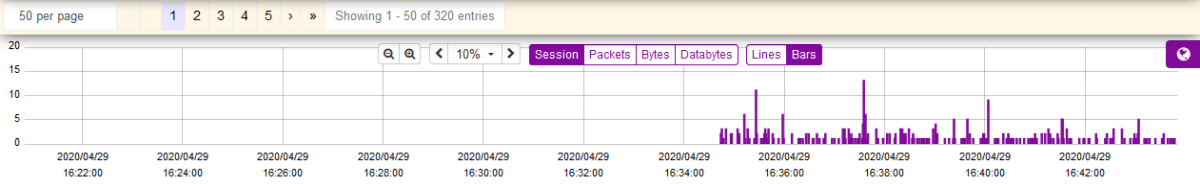
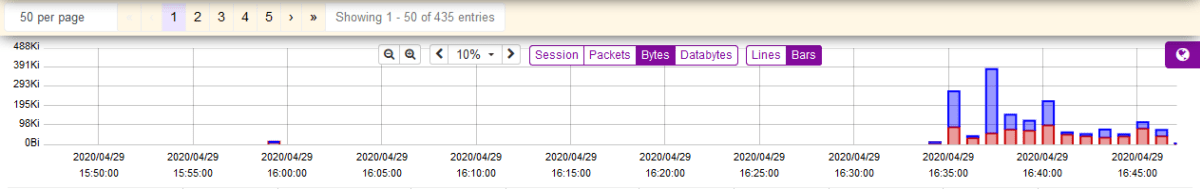
The Moloch screen is displayed. In 'Session', you can check information such as the protocol name and destination IP address of the packet together with the graph.
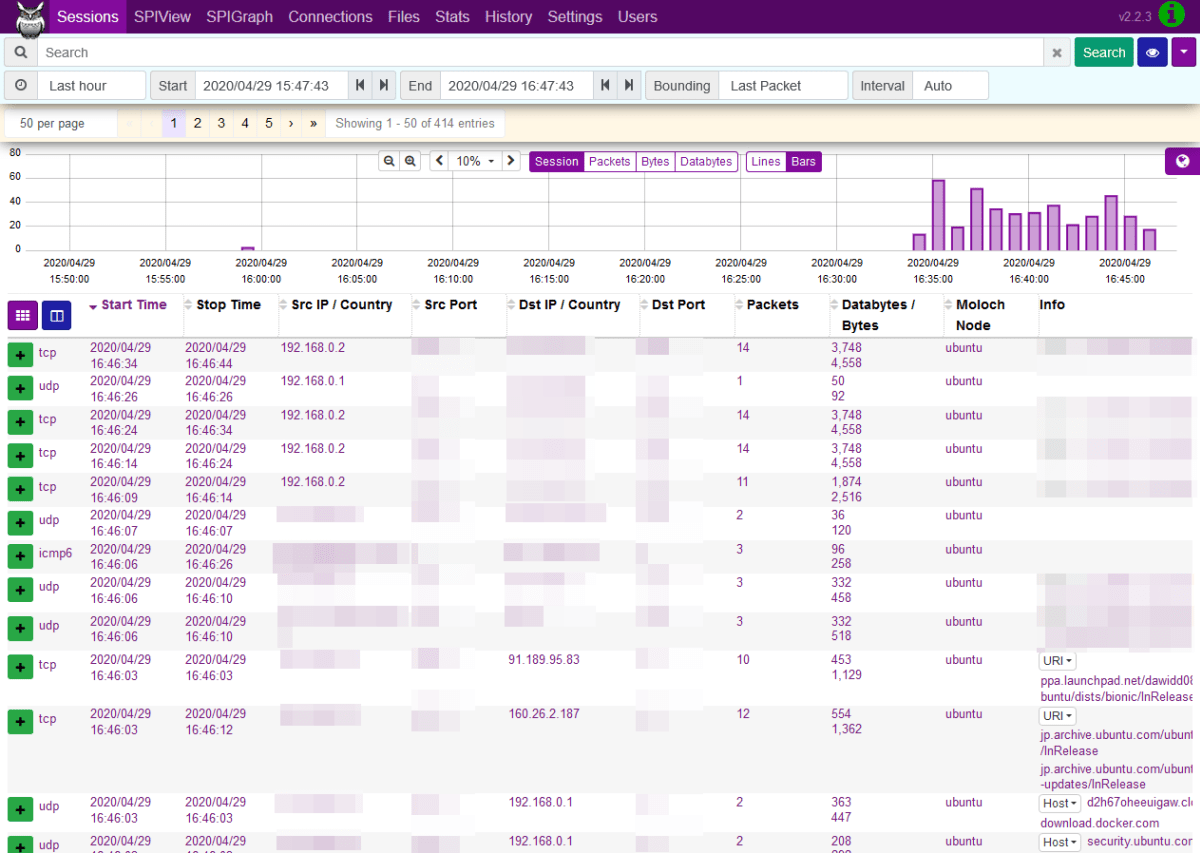
You can check the number of sessions and the amount of transfer in the graph. As for the transfer amount, blue indicates downlink and red indicates uplink communication.
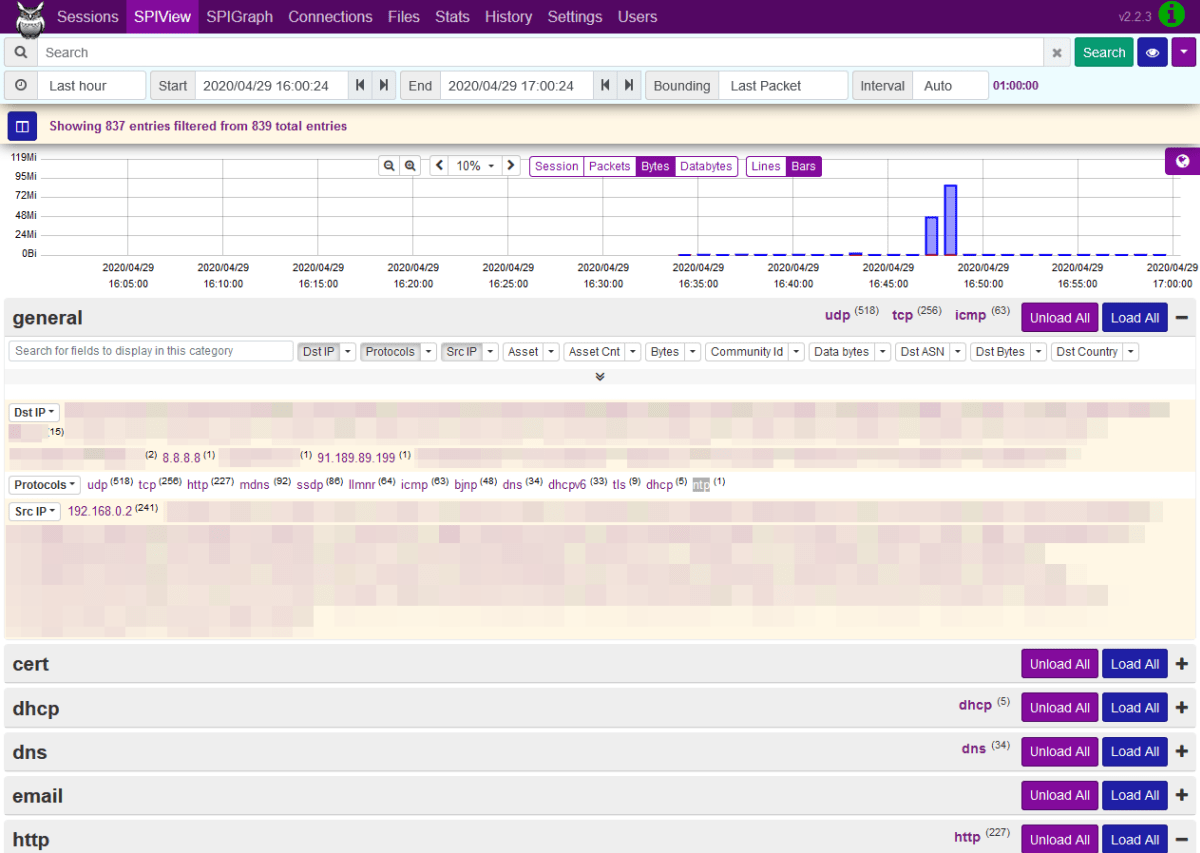
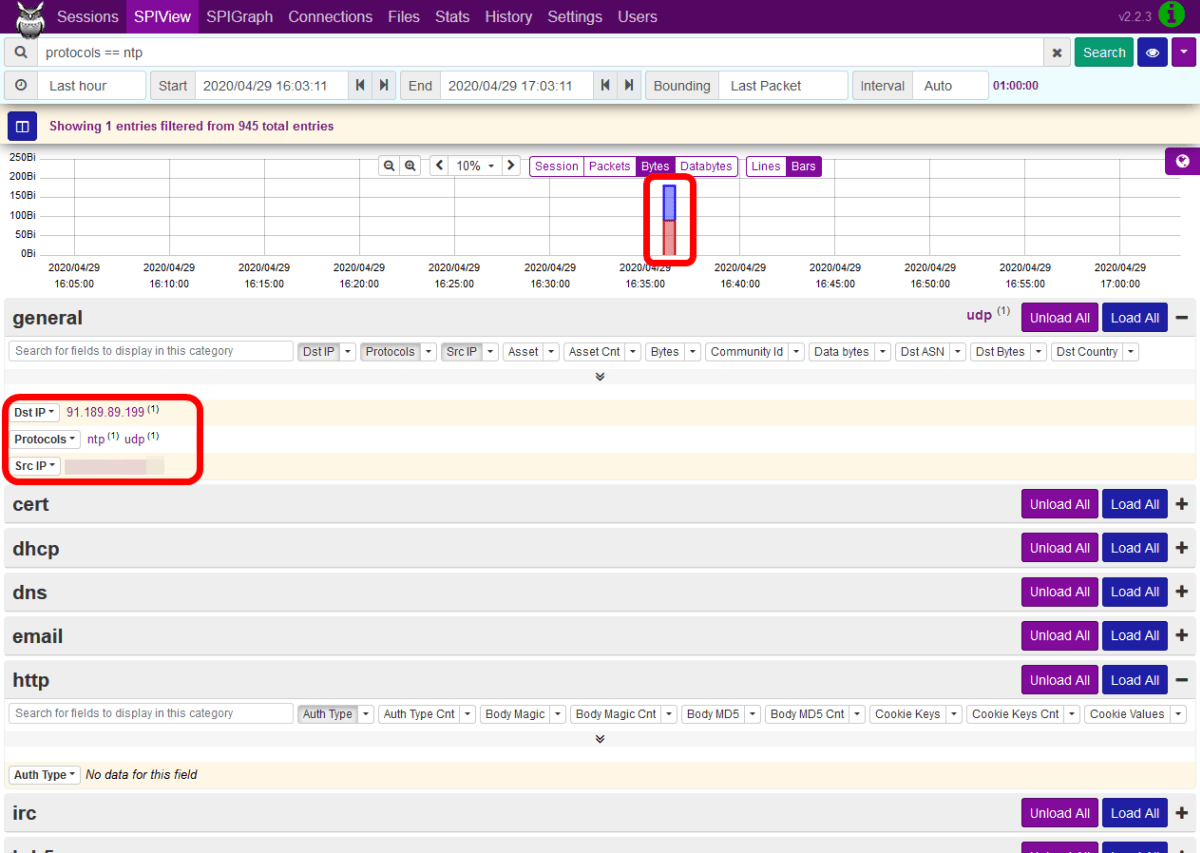
With 'SPIView', it is possible to search for sessions by communication content such as protocol type and IP address.
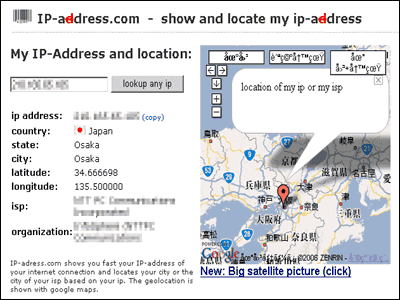
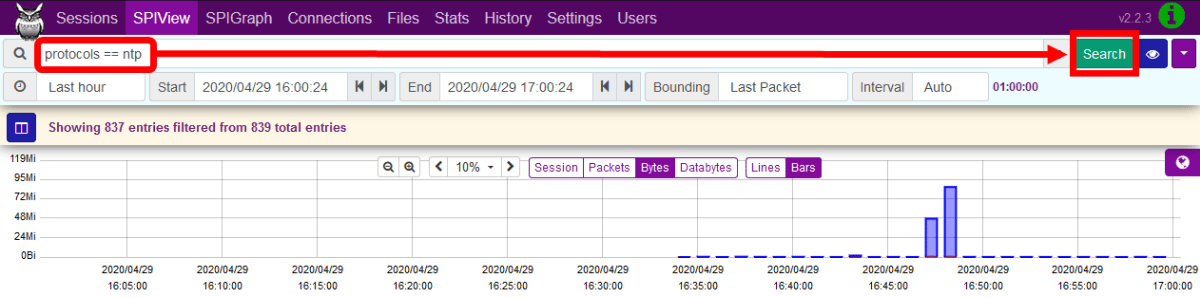
For example, if you want to know which NTP server you are communicating with, click 'ntp' and then 'and ntp'.
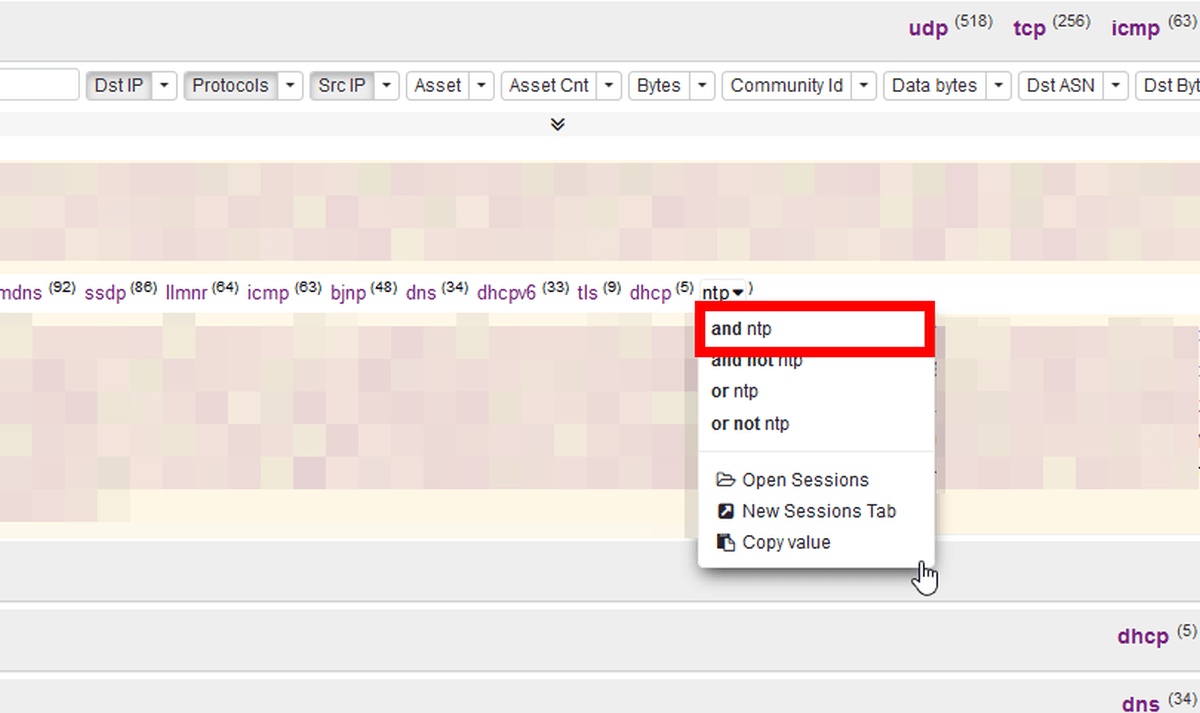
Then, the search conditions are automatically entered in the search screen at the top, so click 'Search'.
I was able to search for ntp communications. By the way, the destination IP address '91.189.89.199' was the IP address of
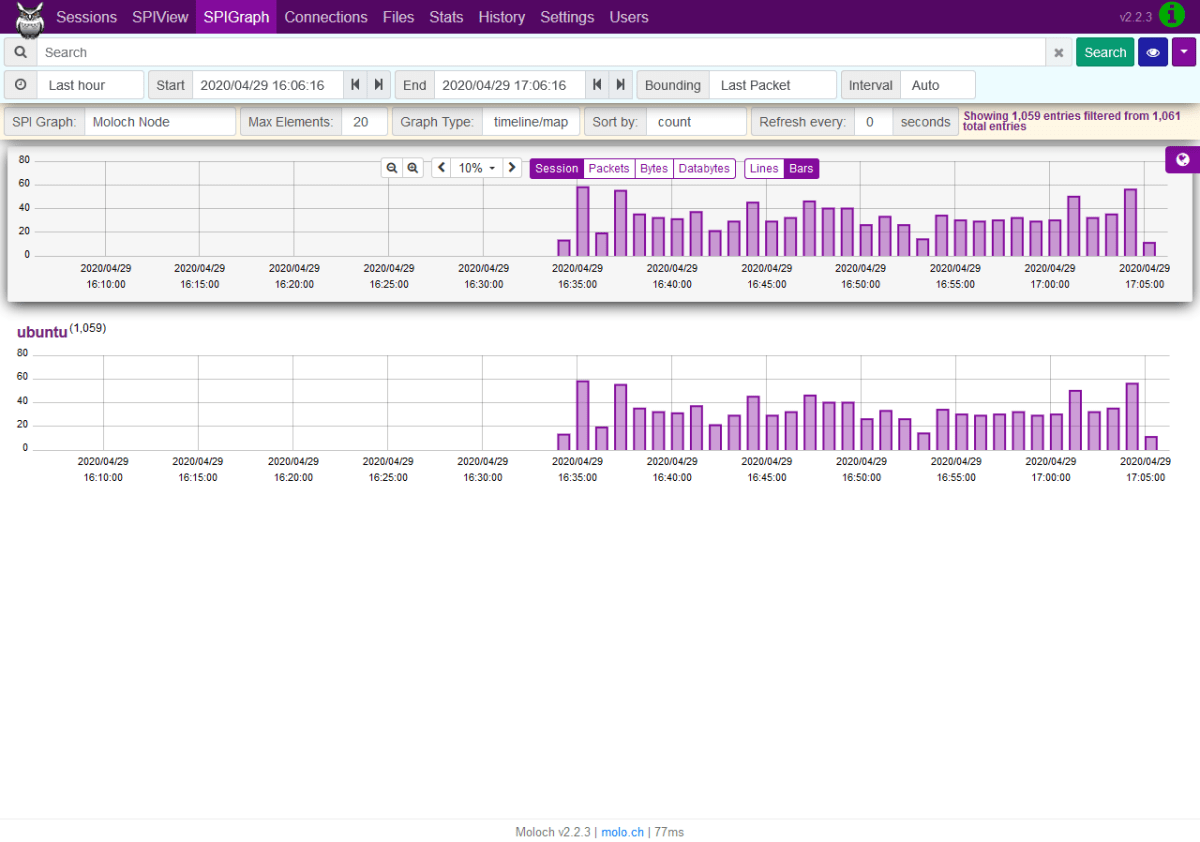
'SPI Graph' can display a graph for each node. You can also check the communication status of multiple servers by installing Moloch on another server and sending metrics to Elasticsearch.
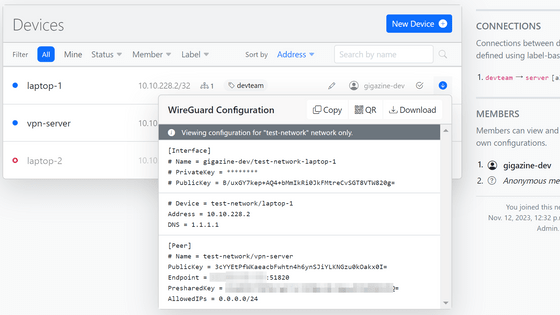
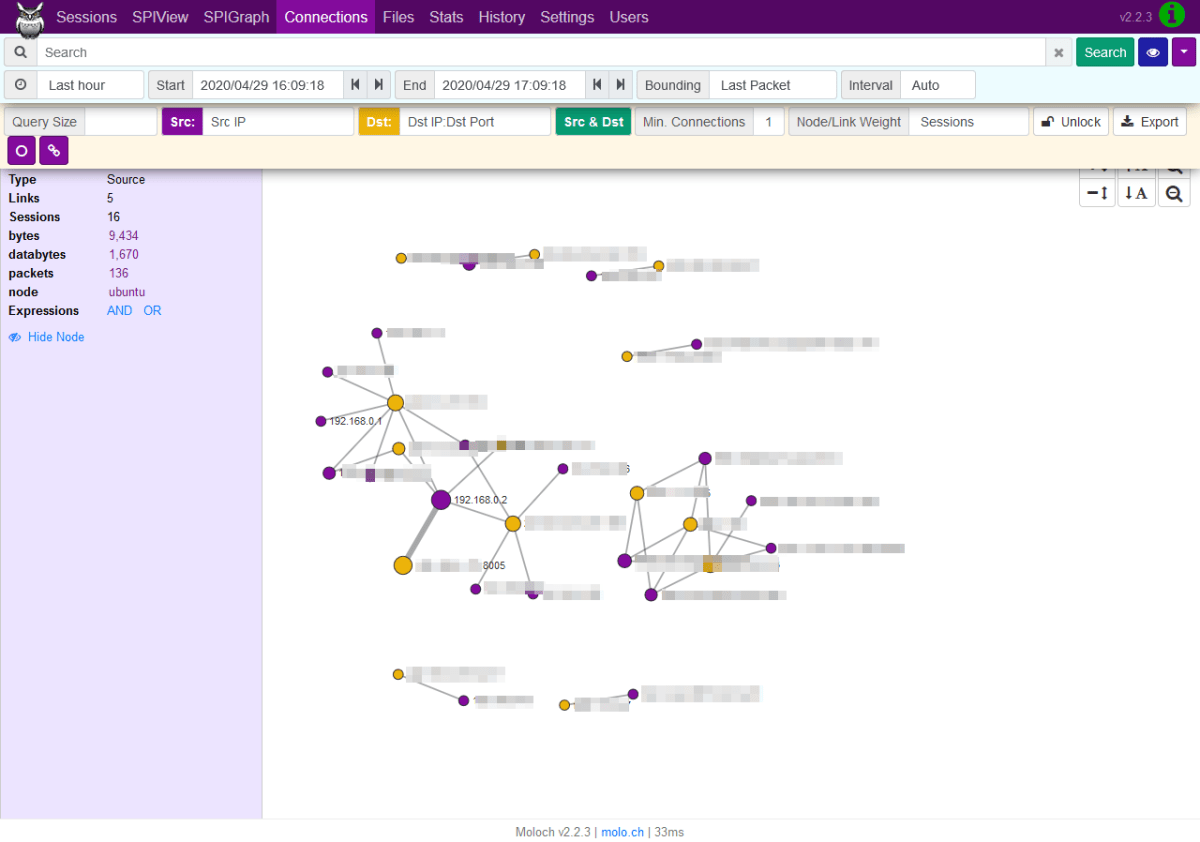
In 'Connection', you can display the relationship between the destination IP address and the source IP address in a graph.
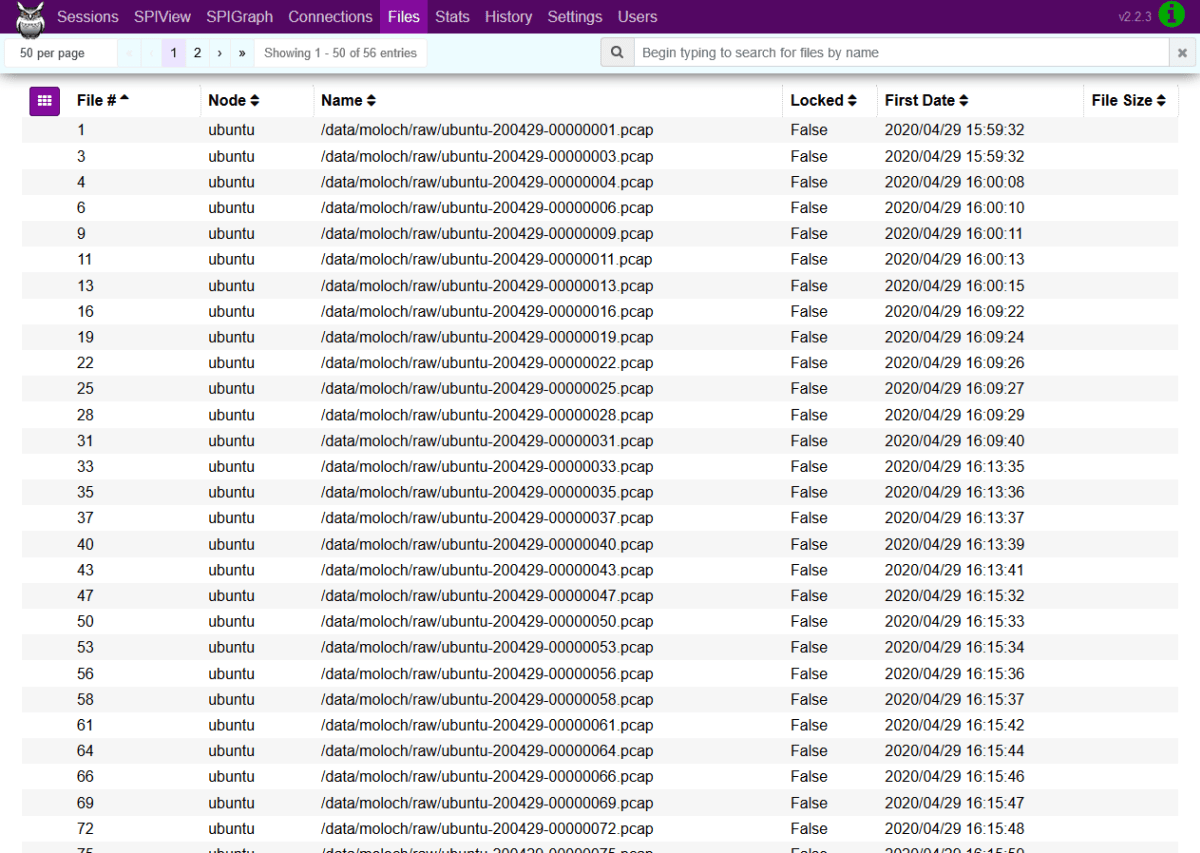
In 'Files', you can check the list of data files in which the capture information of the packet is written.
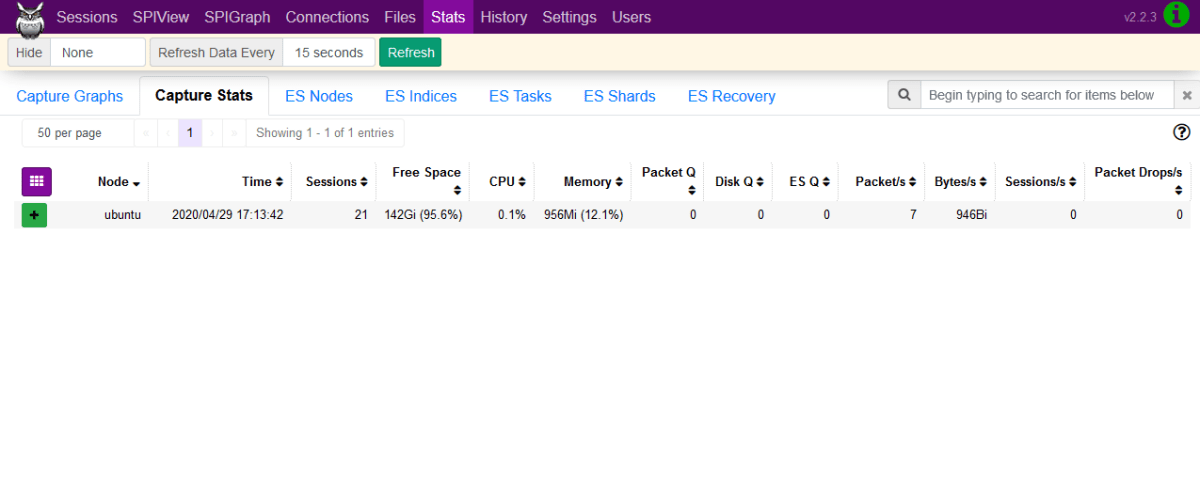
In 'Stats', you can check the operating status of the server that is capturing and Elasticsearch information.
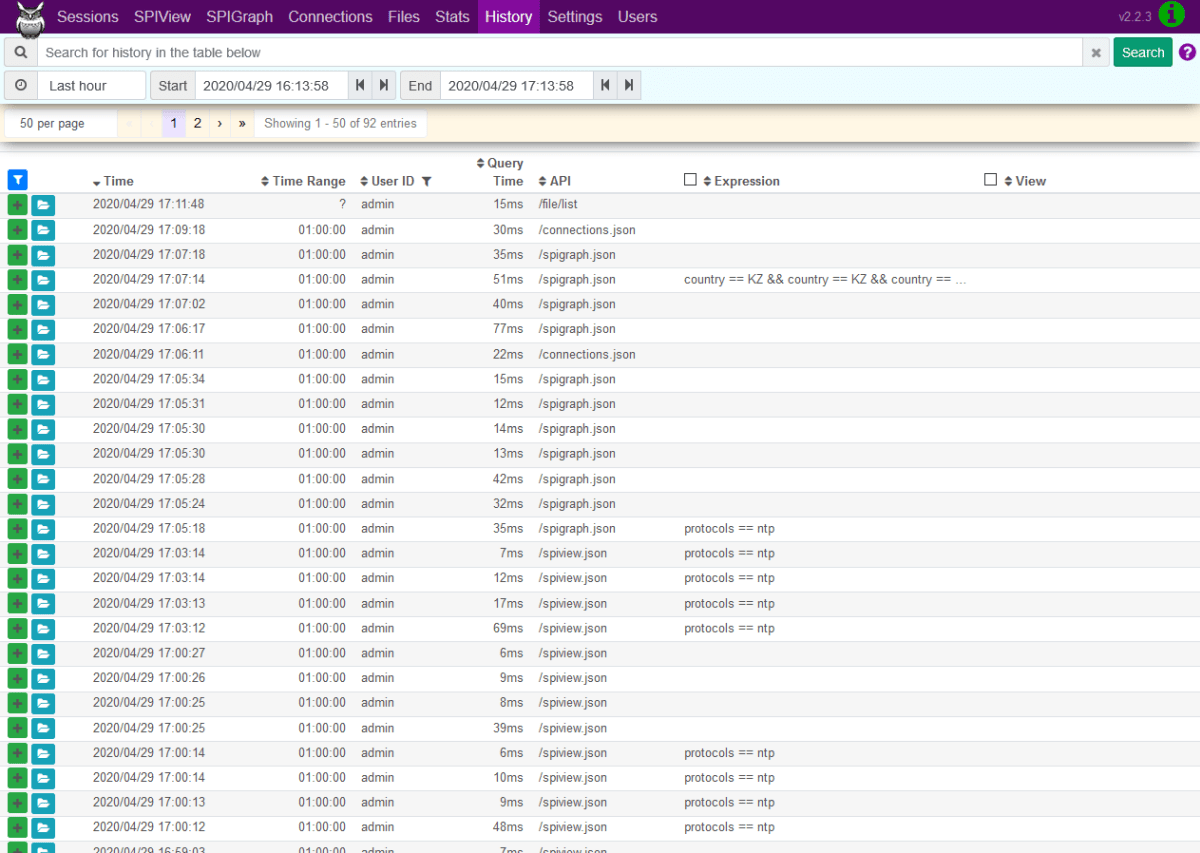
In 'History', you can check who did what in Moloch, such as the search history of communication.
You can set the time zone and appearance from 'Settings'.

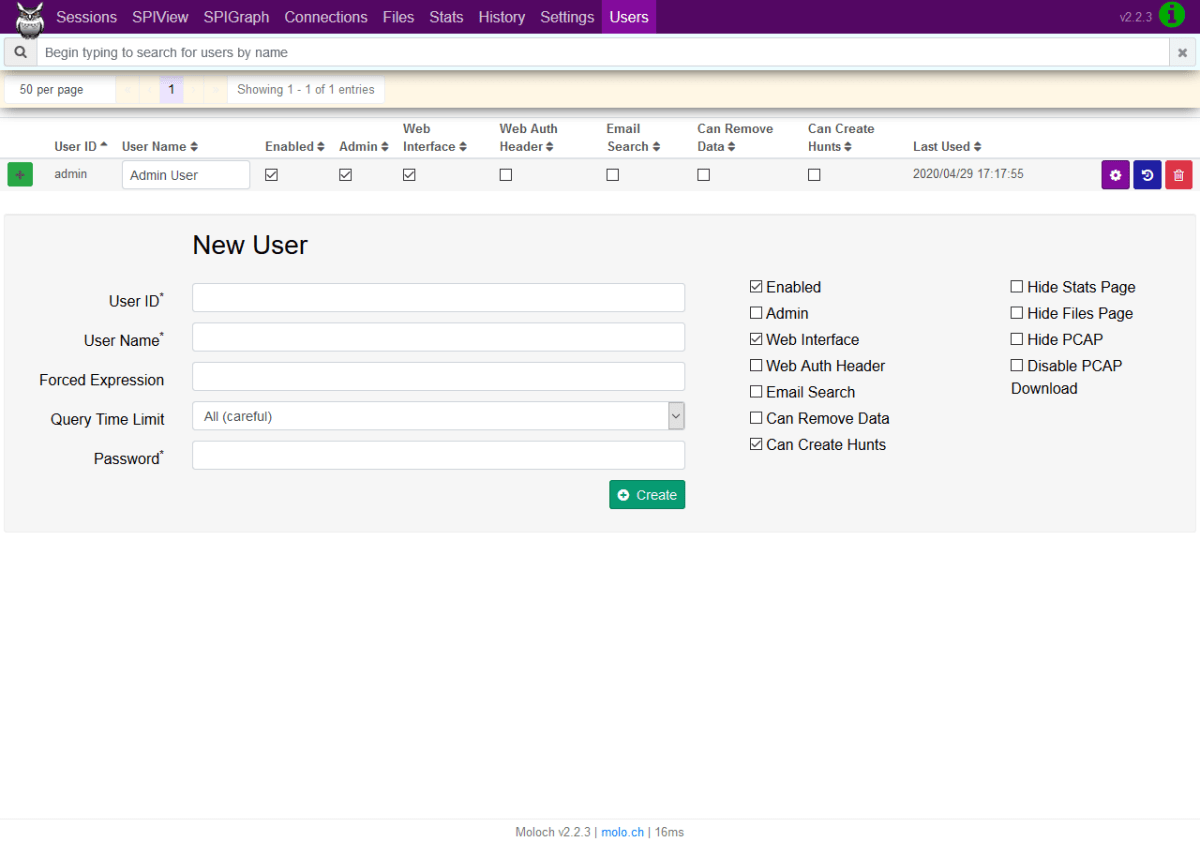
Operations such as adding and deleting users can be performed from 'Users'.
The source code of Moloch is available on GitHub.
GitHub --aol / moloch: Moloch is an open source, large scale, full packet capturing, indexing, and database system.
https://github.com/aol/moloch
Related Posts: