Glances, an open-source cross-platform monitoring tool, can monitor CPU, memory, disk, and network usage in both terminal and web server modes.
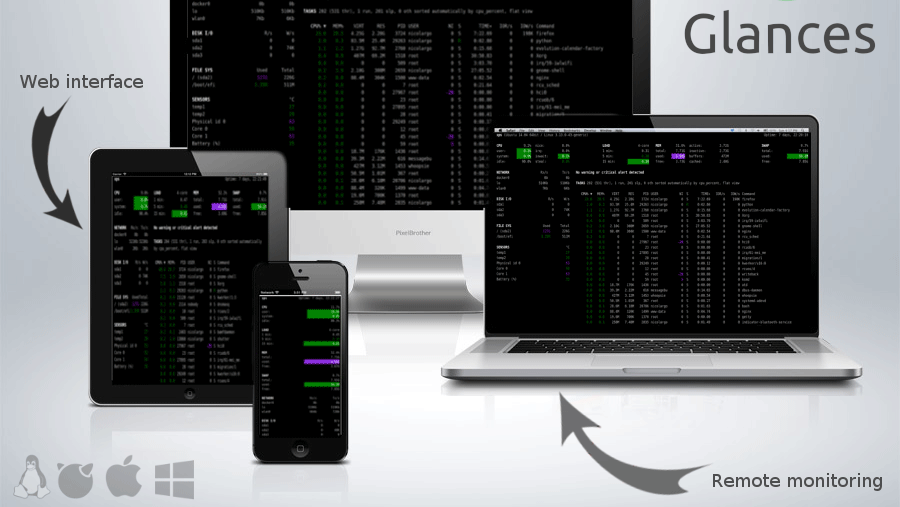
If you want to understand the status of your server or PC in real time, there is an open source system monitoring tool called ' Glances ' that allows you to check not only processes and CPU resources, but also network sending and receiving, disk reading and writing, and even Docker container resource information on a single screen.
nicolargo/glances: Glances an Eye on your system. A top/htop alternative for GNU/Linux, BSD, Mac OS and Windows operating systems.
◆Installation method
This time we will install it on an AlmaLinux server. Create a virtual environment in the user directory, activate it, and then install it using pip.
 cd ~/
 python3 -m venv ~/.venv
 source ~/.venv/bin/activate
 pip install glances
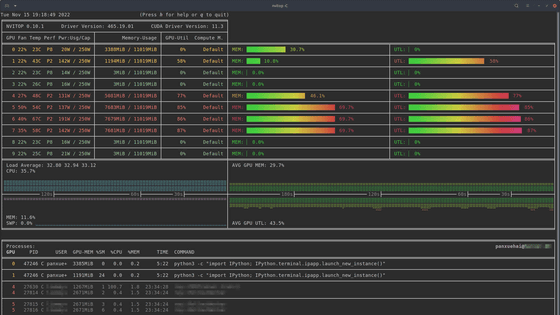
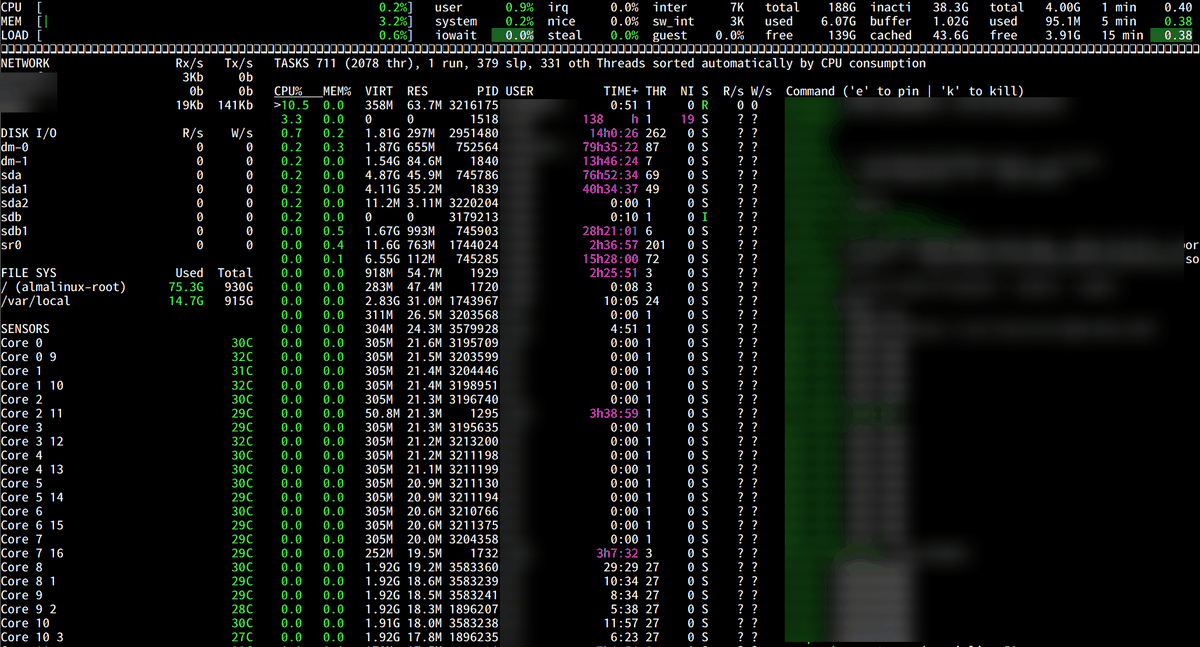
Run the glances command.
glances
In addition to the information available from top, disk usage, network traffic, CPU temperature, and more are updated in real time.
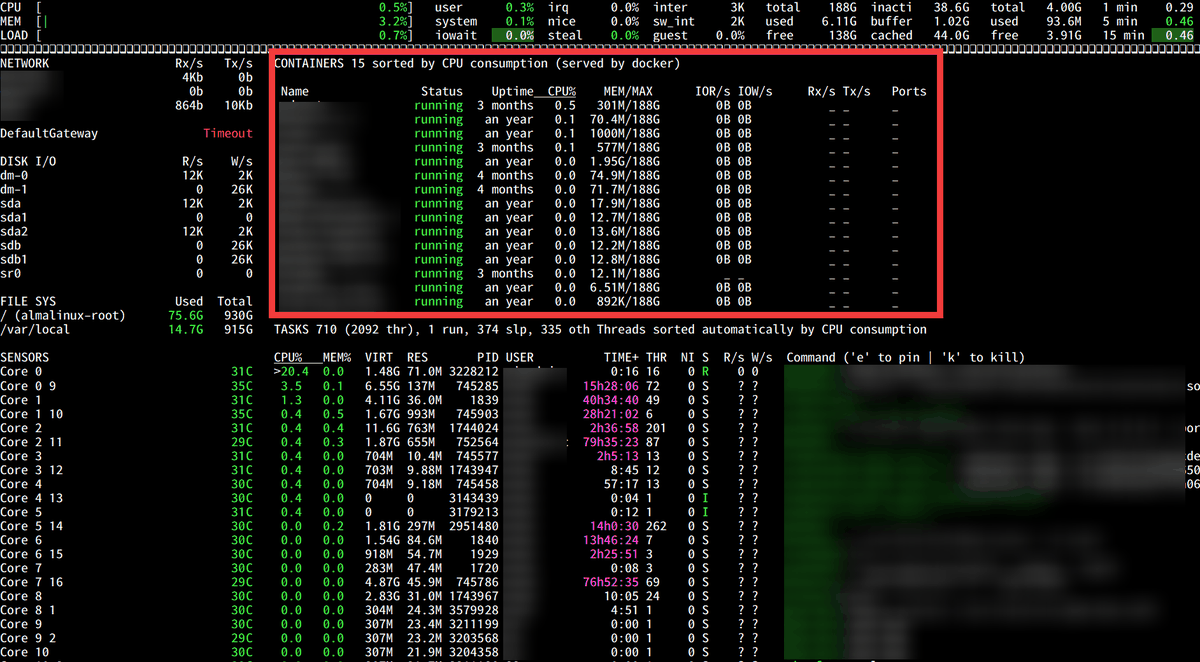
Plugins are also provided, so run the installation command with the '[all]' option to enable all plugins.
pip install glances[all]
Run the glances command again.
glances
With the addition of the plugin, it is now possible to obtain information about Docker containers.
◆Monitoring in two server modes
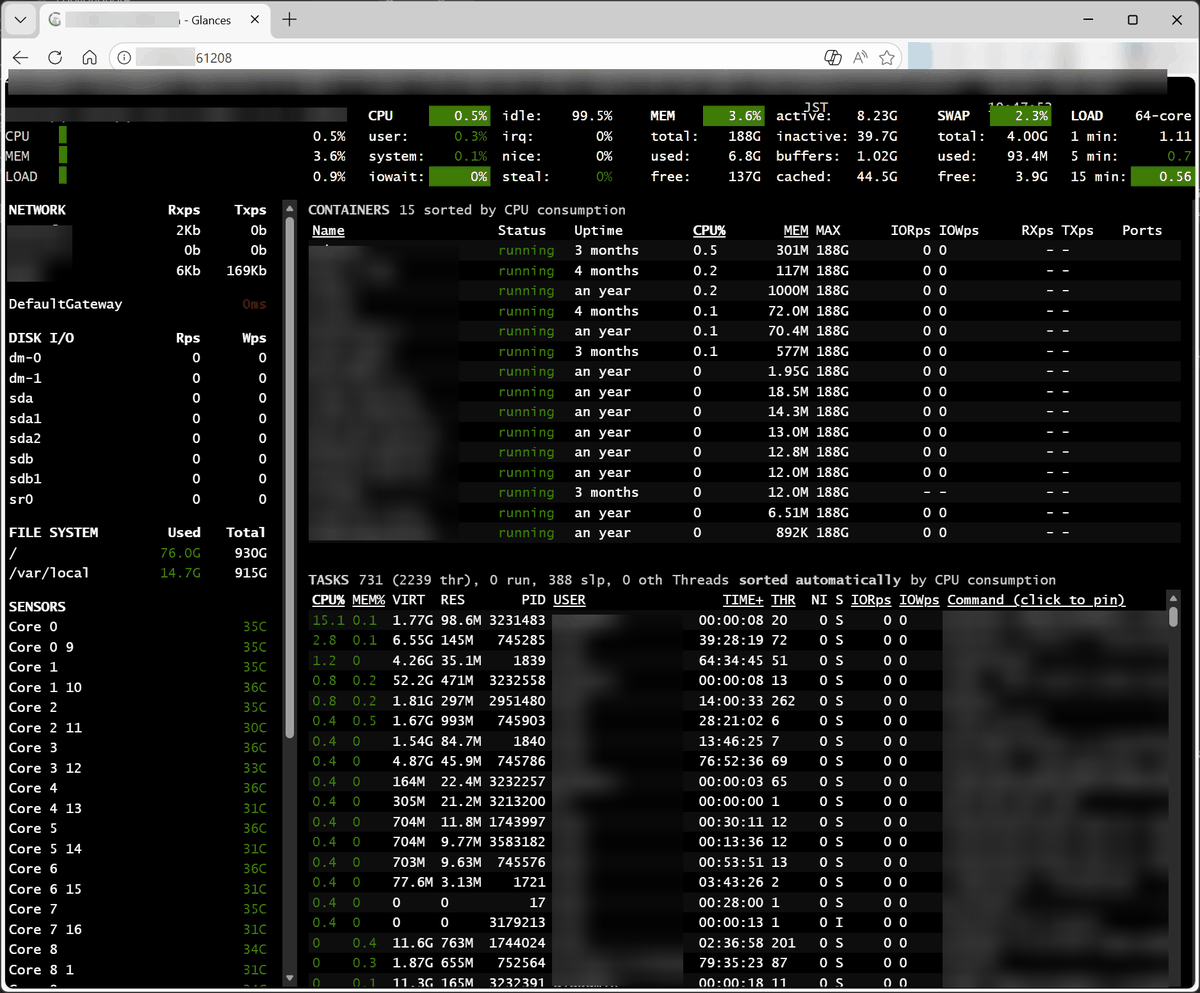
Glances can use two server modes depending on the startup option. Start it as a web server with the '-w' option.
glances -w
When you access 'http://[IP address]:61208' in your browser, the status of the server at the specified IP address will be displayed.
The '-s' option starts the program in server mode, which allows monitoring from the console of another machine.
glances -s
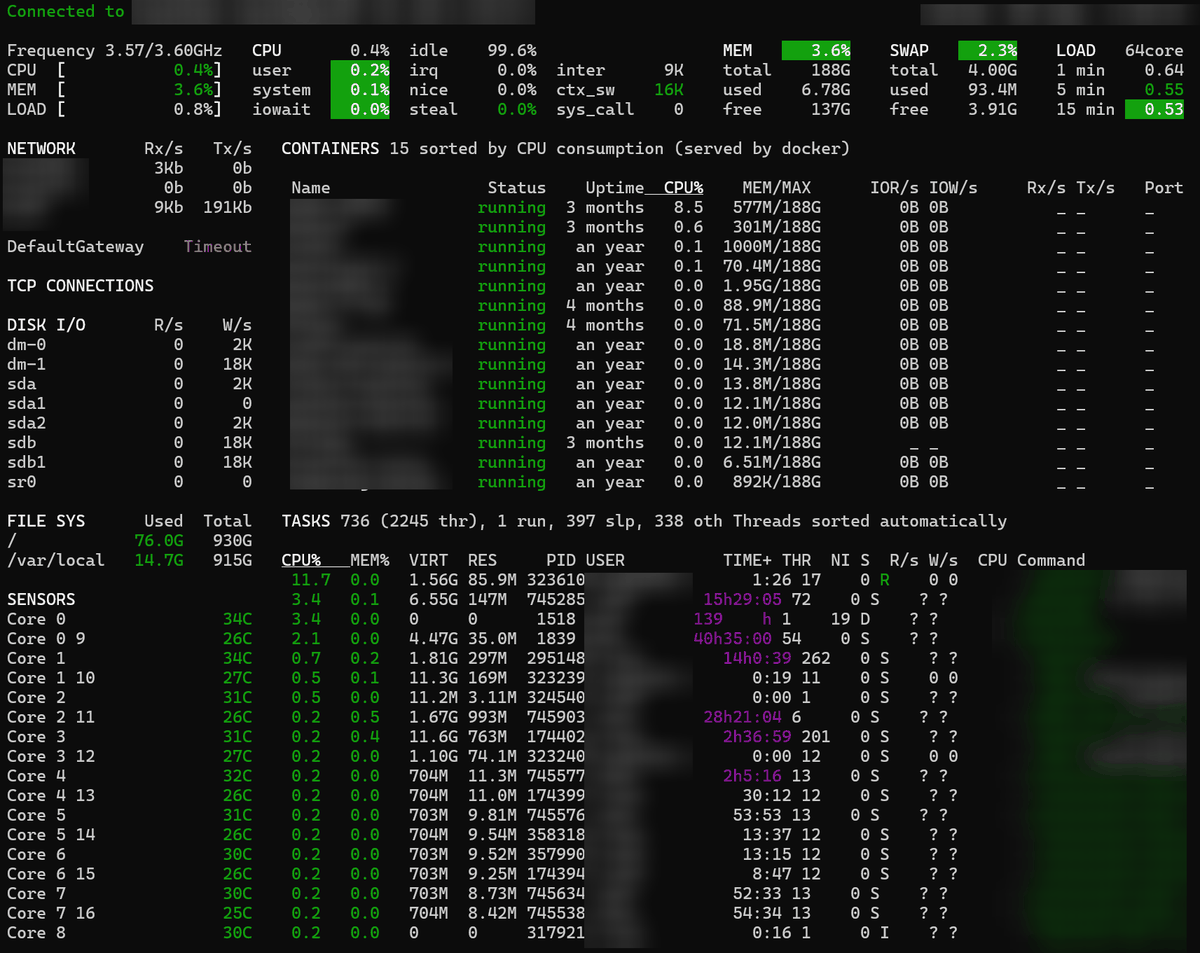
If you install Glances on another machine and start it with the '-c [IP address]' option...
glances -c [IP address]
The status of the server at the specified IP address was displayed.
◆ Output and export as logs
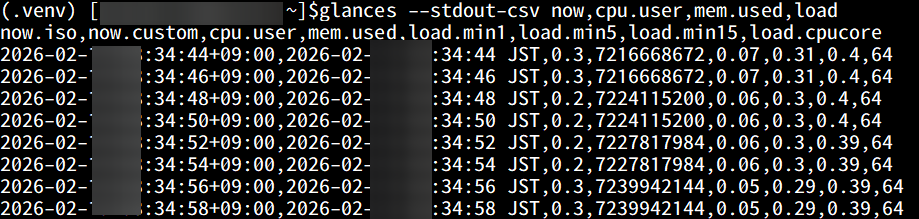
It is also possible to output it as a log. The command to output it in CSV format is as follows:
glances --stdout-csv now,cpu.user,mem.used,load
When executed, the log was output every 2 seconds.
In addition to file output in CSV and JSON formats, it also supports exporting to databases such as
◆Simple display
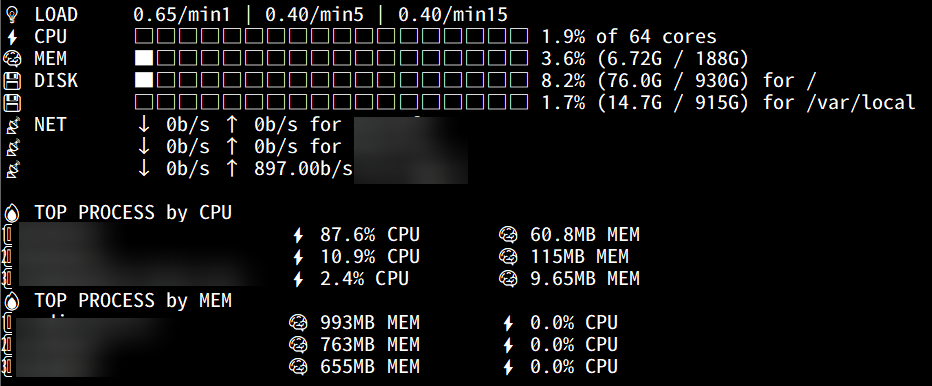
By adding the '--fetch' option, you can get a simple display of the numerical values at the time of execution.
glances --fetch
The data was displayed in a simple yet highly visible format using pictograms and graphs.
Glances is continuously updated under the MIT license and can be used for a wide range of purposes, from personal server management to operational monitoring in production environments.
Related Posts: