Customize Munin and try increasing the types of graphs displayed
I introduced in GIGAZINE before "Munin"Is dramatically easier to install than MRTG, it also monitors the system and gets various values by acquiring various values, but this time it is a way to enable plugins not activated in Munin , How to deal with when the graph is not displayed at all even though it is activated, and how to use the plugin additionally.
Because, for some reason, as soon as I turned GIGAZINE into a new server MySQL's graph disappeared. Apparently the symbolic link to the MySQL plugin has been lost, as well as the value was not successfully acquired, it seems that it was removed from the beginning when installing by RPM. Likewise, the Apache related Munin plugin does not seem to be activated either.
So here is how to add graphs to Munin.
◆ Installing Munin
First off. This time the procedure to install Munin on Red Hat Enterprise Linux ES 4 (RHEL 4). First install munin-node. Due to dependency occurrence, it had to be installed beforehand before installing, so as a result it was decided to install and install the following files.
Rpm - ivh sysstat - 5.0.5 - 11. Rhel 4. I 386. Rpm
Rpm -ivh perl-Net-Server-0.90-1.2.el4.rf.noarch.rpm
Rpm -ivh perl-Crypt-DES-2.05-3.2.el4.rf.i386.rpm
Rpm -ivh perl-Net-SNMP-4.1.2-0.2.el4.rf.noarch.rpm
Rpm - ivh munin - node - 1.2.5 - 1 rhel 4. Noarch. Rpm
Next is the installation of munin itself. I had to install some beforehand before I got it as follows. It seems that rrdtool sometimes does not work with Munin when the version is very high.
Rpm - ivh perl - HTML - Template - 2.7 - 1. 2 .el 4. Rf. No.
Rpm - ivh perl - DateManip - 5.42 a - 3. noarch. Rpm
Rpm - ivh rrdtool - 1.0.50 - 3 .el 4. Rf. I 386. Rpm
Rpm - ivh perl - rrdtool - 1.0.50 - 1. 2 .el 4. Rf. I 386. Rpm
Rpm - ivh munin - 1.2.5 - 1 rhel 4. No. Rpm
For other details refer to the following article.
"Munin" which can graph the load and traffic easily from MRTG - GIGAZINE
After that, it is OK if it is set by "ntsysv" command so that it will automatically start up when the machine is restarted. Last time I had forgotten it so I had time when the graph was not being drawn on rebooting the machine .... It was awful.
◆ Munin's plug-in enables invalid ones and adds graphs
Munin 's graph type increases by adding a plug - in. Let's add a MySQL related graph prepared by default this time.
First of all, Munin's plug-in main unit is in the following place.
/ Usr / share / munin / plugins /
Symbolic links are placed in the following places.
/ Etc / munin / plugins /
In other words, if you create a symbolic link with "ln - s", the type of graph will increase. The ln command looks like the following.
Ln -s source file name full path link destination file full path
So, for MySQL related graphs, you can create a symbolic link as follows.
Ln -s / usr / share / munin / plugins / mysql_bytes / etc / munin / plugins / mysql_bytes
Ln -s / usr / share / munin / plugins / mysql_isam_space / / etc / munin / plugins / mysql_isam_space _
Ln -s / usr / share / munin / plugins / mysql_queries / etc / munin / plugins / mysql_queries
Ln -s / usr / share / munin / plugins / mysql_slowqueries / etc / munin / plugins / mysql_slowqueries
Ln -s / usr / share / munin / plugins / mysql_threads / etc / munin / plugins / mysql_threads
However, the fact that the graph of MySQL is not displayed at the time of the initial installation means that this alone will not work. In addition, the following settings are required.
Q: Why are the graphs for the MySQL plugin blank?
The reason why the graph is not displayed is because the location of "mysqladmin" has not been specified. Therefore, if you specify the location explicitly in the configuration file, it works. First of all run the following command and find the location of "mysqladmin".
Which mysqladmin
It is roughly located in the following places.
/ Usr / bin / mysqladmin
Next, open "/etc/munin/plugin-conf.d/munin-node". Then add the following lines and save.
Env.mysqladmin / usr / bin / mysqladmin
Then restart the munin-node as "/etc/init.d/munin-node restart" and it is completed. Since it is executed every 5 minutes, let's check that the graph is properly displayed after 5 minutes.
◆ Display Apache related graph
Let's put a symbolic link first.
Ln -s / usr / share / munin / plugins / apache_accesses / etc / munin / plugins / apache_accesses
Ln -s / usr / share / munin / plugins / apache_processes / etc / munin / plugins / apache_processes
Ln -s / usr / share / munin / plugins / apache_volume / etc / munin / plugins / apache_volume
Then open httpd.conf and confirm that there are the following lines. If you commented out, let's return it. The plug-in can not operate if "mod_status" providing information on the server's activity status and performance is off.
LoadModule status_module modules / mod_status.so
Next, add the following code or change it from comment out and change it so that Status becomes usable. Points should be set so that they can be viewed from the local host after "Allow from". If you do not set this value, you can not get the value. If you are assigning 127.0.0.1 or localhost or an IP address, let's specify an IP address that can be referred to locally.
SetHandler server-status
Order Deny, Allow
Deny from all
Allow from 127.0.0.1
Allow from localhost
Then let ExtendedStatus be "On".
ExtendedStatus On
Then restart the munin-node as "/etc/init.d/munin-node restart" and it is completed. Since it is executed every 5 minutes, let's check that the graph is properly displayed after 5 minutes. However, some graphs will not be displayed without some value, so let's wait patiently.
◆ Download and add plugins
Munin has quite a lot of plugins by default, but there are more plugins on the following sites.
MuninExchange
http://muninexchange.projects.linpro.no/
You can see all plugins by clicking "Search" and selecting "ALL CATEGORIES". Click on the plugin name to see the actual graph image, comments and code, and click "Download" to download it.
The following four installations which added this time this time.
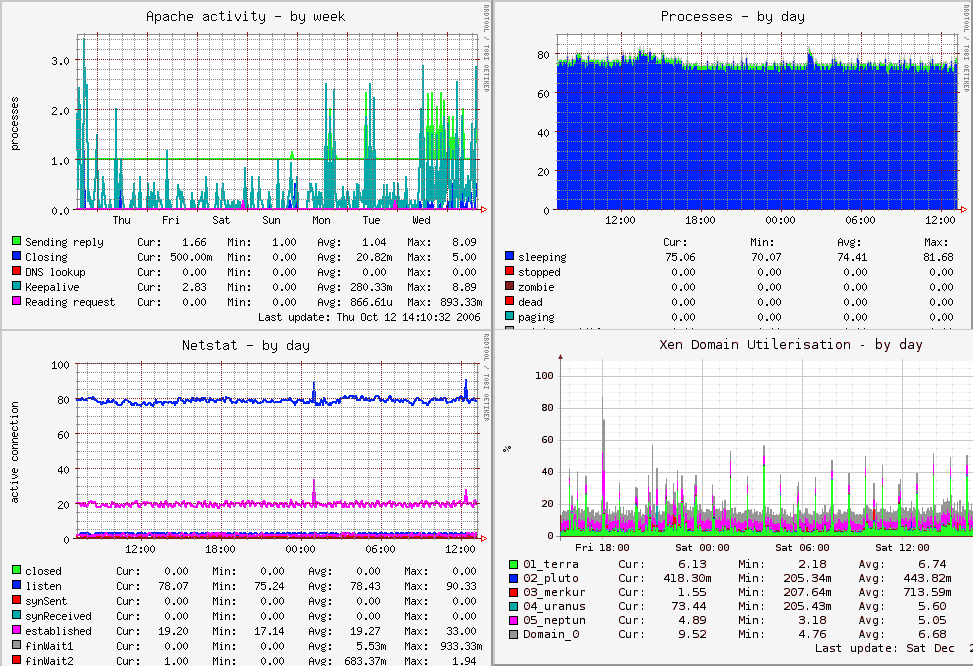
Apache_activity: Graph the contents that can be checked with Keepalive or Closing or the usual Status module
Processes: Graphically summarize the values of sleeping and zombie displayed by the top command
Mysql_qcache: Graph the number of query caches (query_cache) added in MySQL 4 and later
Mysql_qcache_mem: Graph the size of the query cache (query_cache) added in MySQL 4 and later
Upload the downloaded file below "/ usr / share / munin / plugins /" and execute the following command.
Ln -s / usr / share / munin / plugins / apache_activity / etc / munin / plugins / apache_activity
Ln - s / usr / share / munin / plugins / processes / etc / munin / plugins / processes
Ln -s / usr / share / munin / plugins / mysql_qcache / etc / munin / plugins / mysql_qcache
Ln -s / usr / share / munin / plugins / mysql_qcache_mem / etc / munin / plugins / mysql_qcache_mem
Then restart the munin-node as "/etc/init.d/munin-node restart" and it is completed. Since it is executed every 5 minutes, let's check that the graph is properly displayed after 5 minutes.
The other plugins looking interesting are as follows.
Apcupsd_ww: Graph the value of UPS
Cpuload_: Graph the CPU load only for a specific process name. Only Apache or MySQL can be used.
Temperature: Graph the temperature obtained from weather.noaa.gov
Xen: Graph the status of virtual machines running on Xen
Related Posts:


in Software, Web Service, Review, Posted by darkhorse