`` Diagrams '' that you can write code in Python and output the system configuration diagram of AWS and Kubernetes
Many engineers should have experience creating system configuration diagrams when sharing system configurations internally or explaining them externally. Using the diagram creation software ' Diagrams ', like the services related to '
Diagrams · Diagram as Code
https://diagrams.mingrammer.com/
First, install the packages required for the operation of Diagrams. This time, Ubuntu 18.04 is used to install Diagrams.
[code] sudo apt install -y python3 python3-pip graphviz [/ code]
Then install Diagrams.
[code] pip3 install diagrams [/ code]
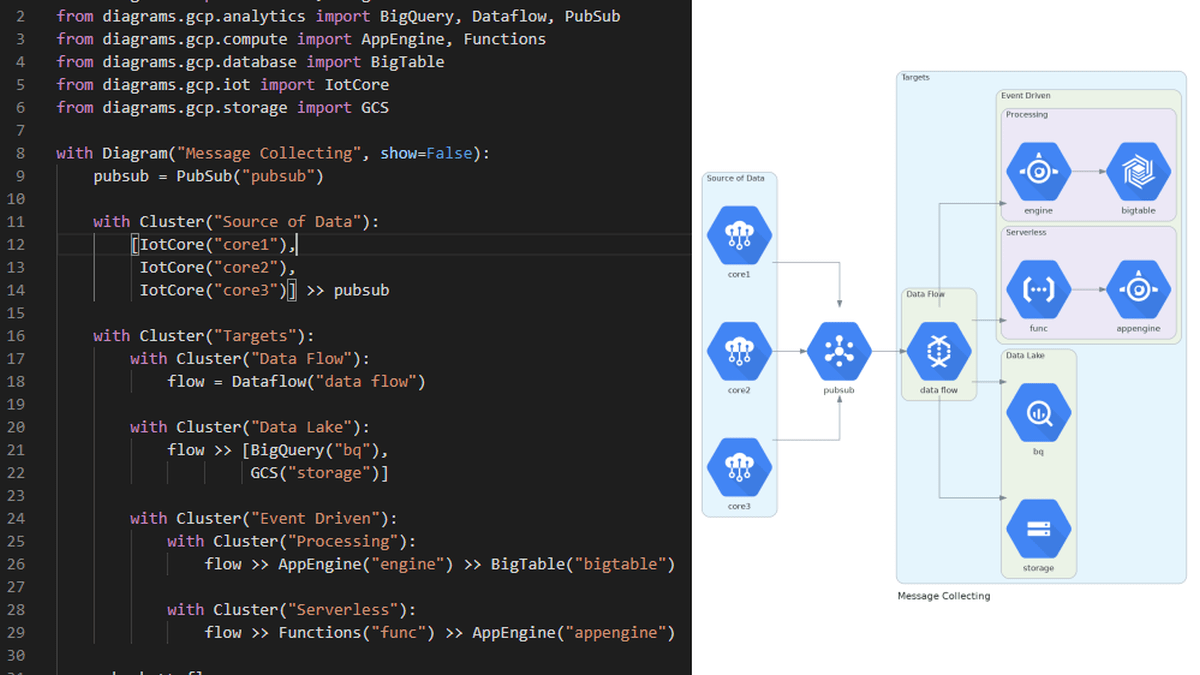
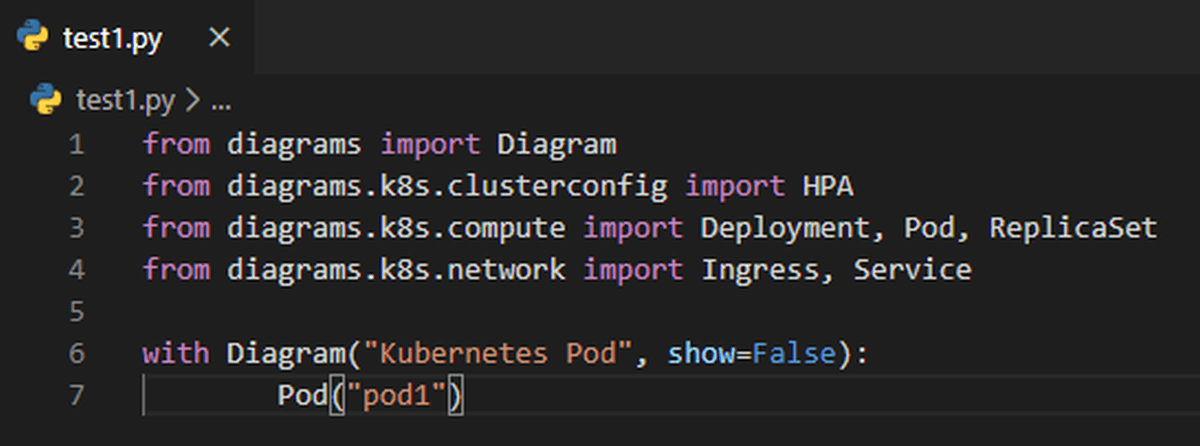
Now that Diagrams is available in Python, I'm ready to write the code. Diagrams can draw configuration diagrams of AWS, GCP, Kubernetes, etc. This time, to draw the Kubernetes configuration diagram, import the necessary modules.
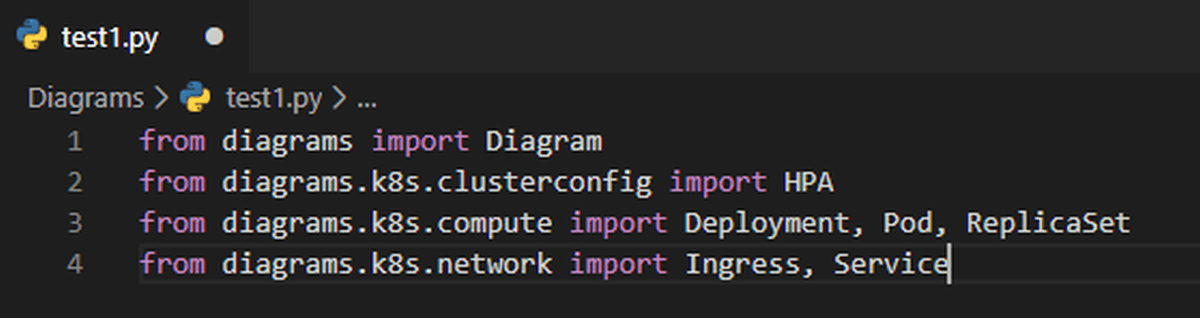
It is possible to output the configuration diagram by creating an instance of the Diargam class within the with syntax. I tried writing the code as shown below.
When I execute the code I wrote, a PNG file was output under the current directory at the time of execution.
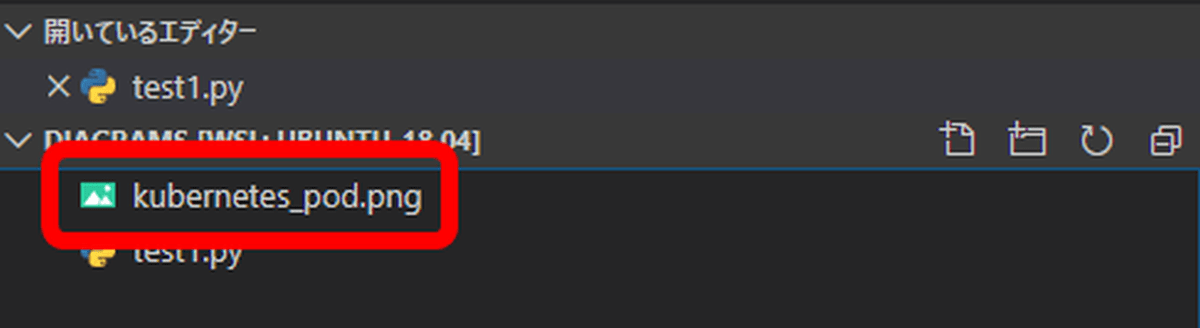
The output PNG file looks like this.

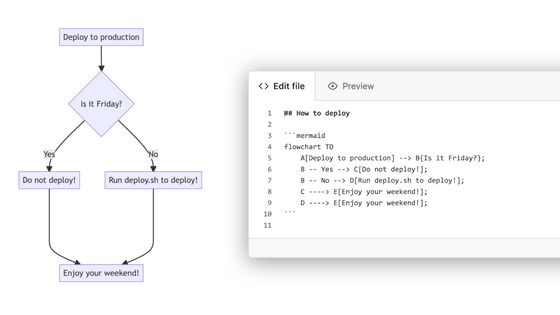
Use '>>' and '<<' to connect multiple diagrams with arrows.
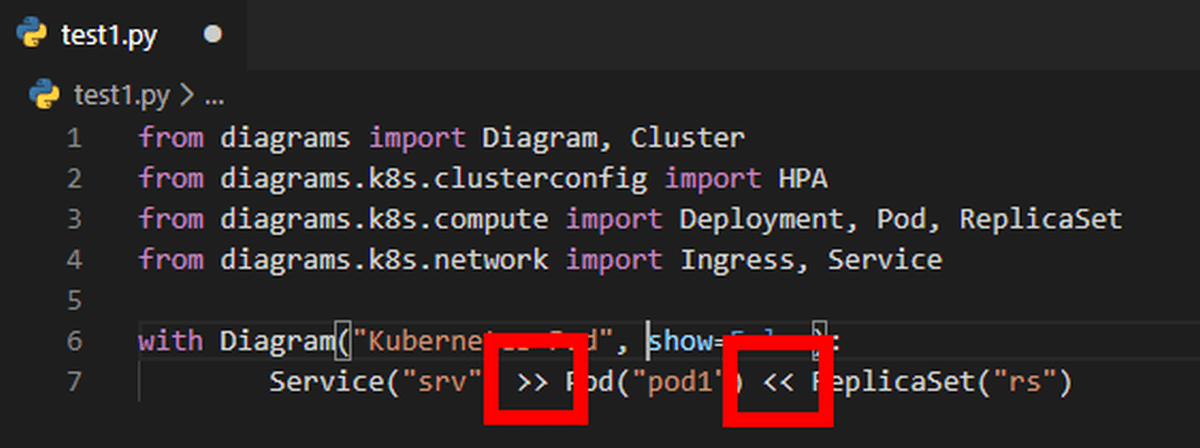
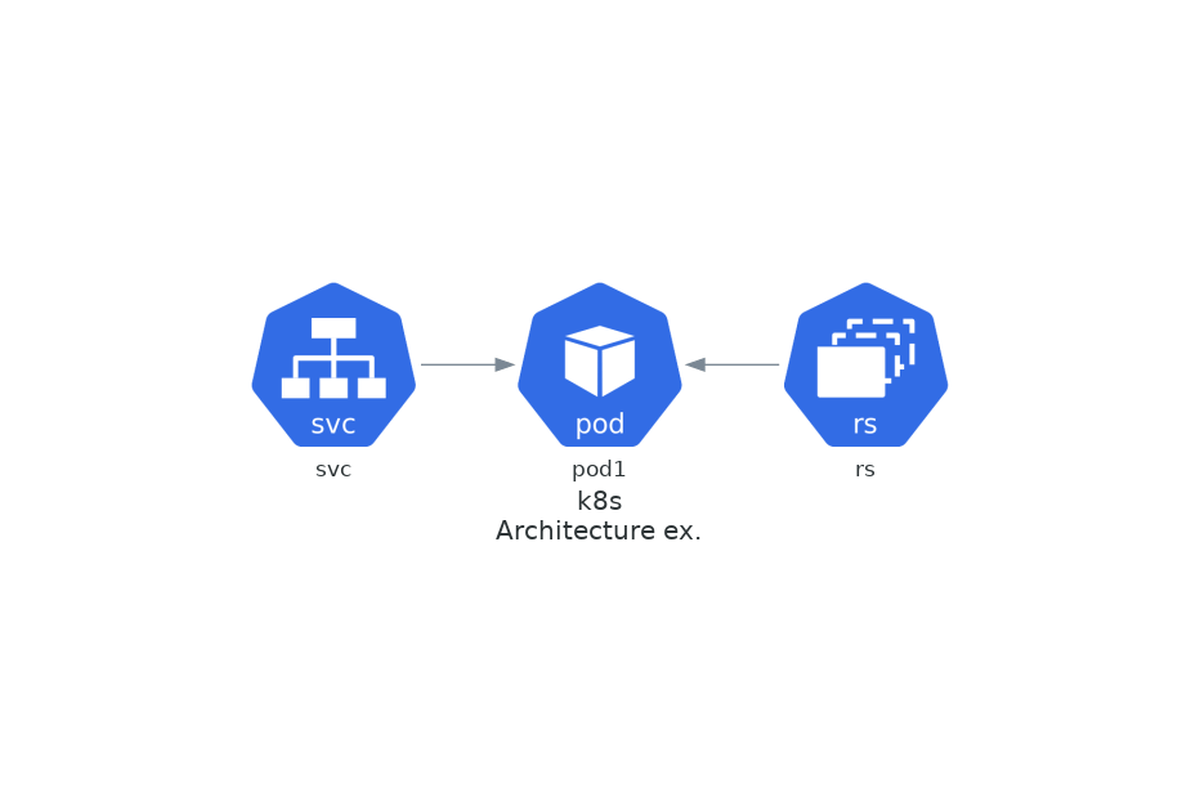
When you run the code, you should see an arrow output, as in the image below.
If you use '-' instead of '>>' or '<<', you can output a non-directional bar.

The file name and extension to be output and the direction of the configuration diagram can be set by specifying values for the instance variables 'filename' 'outformat' 'direction'.
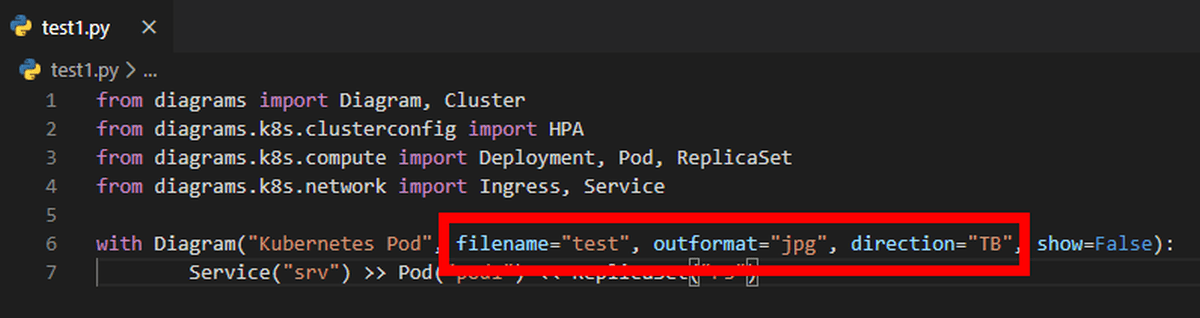
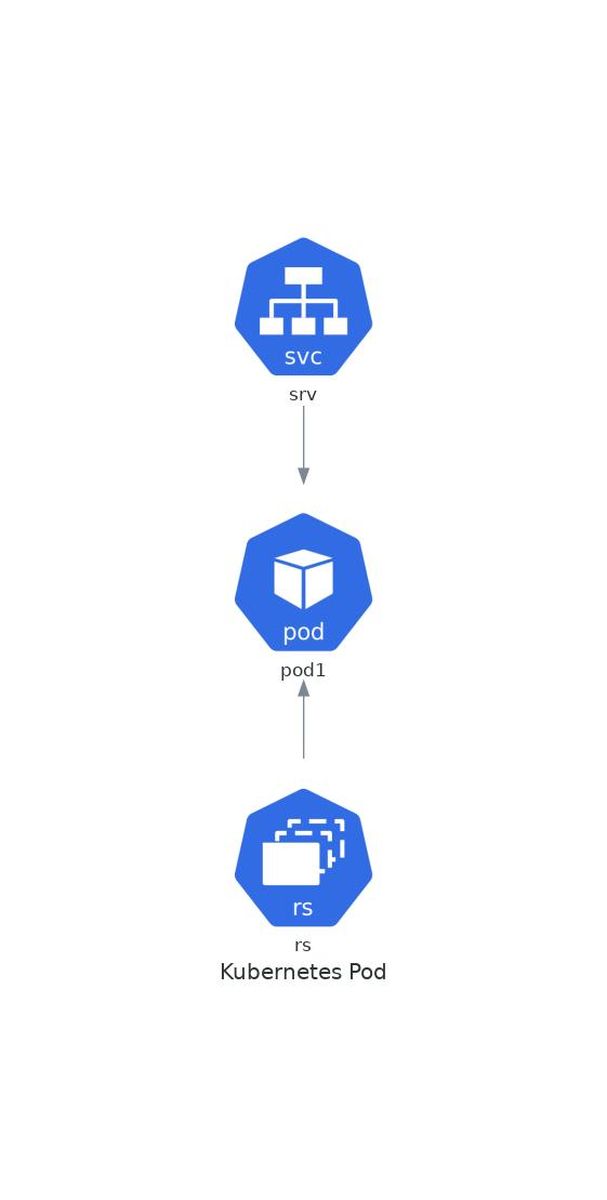
For example, if 'TB' is specified in the 'direction' variable, the following image will be output. 'TB' is arranged from top to bottom, 'BT' is arranged from bottom to top, 'LR' is arranged from left to right, and 'RL' is arranged from right to left.
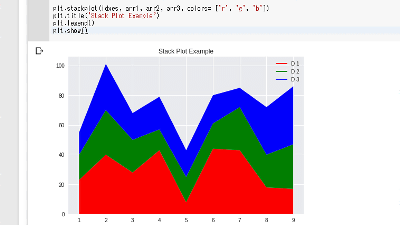
You can also customize the color and shape of the arrows and bars. If you import the Edge class and create an Edge instance that describes the color and shape between '>>' and '<<' ...
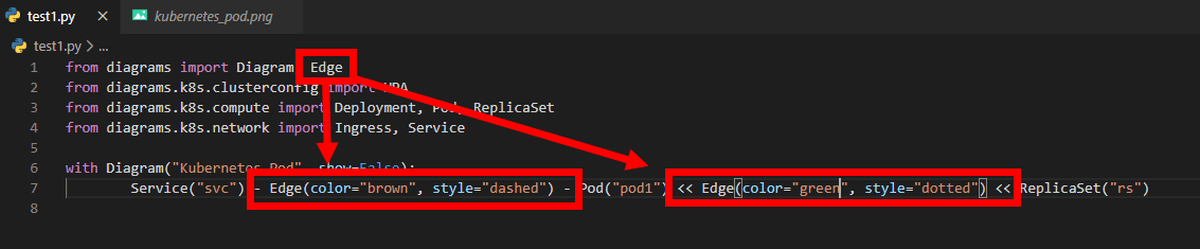
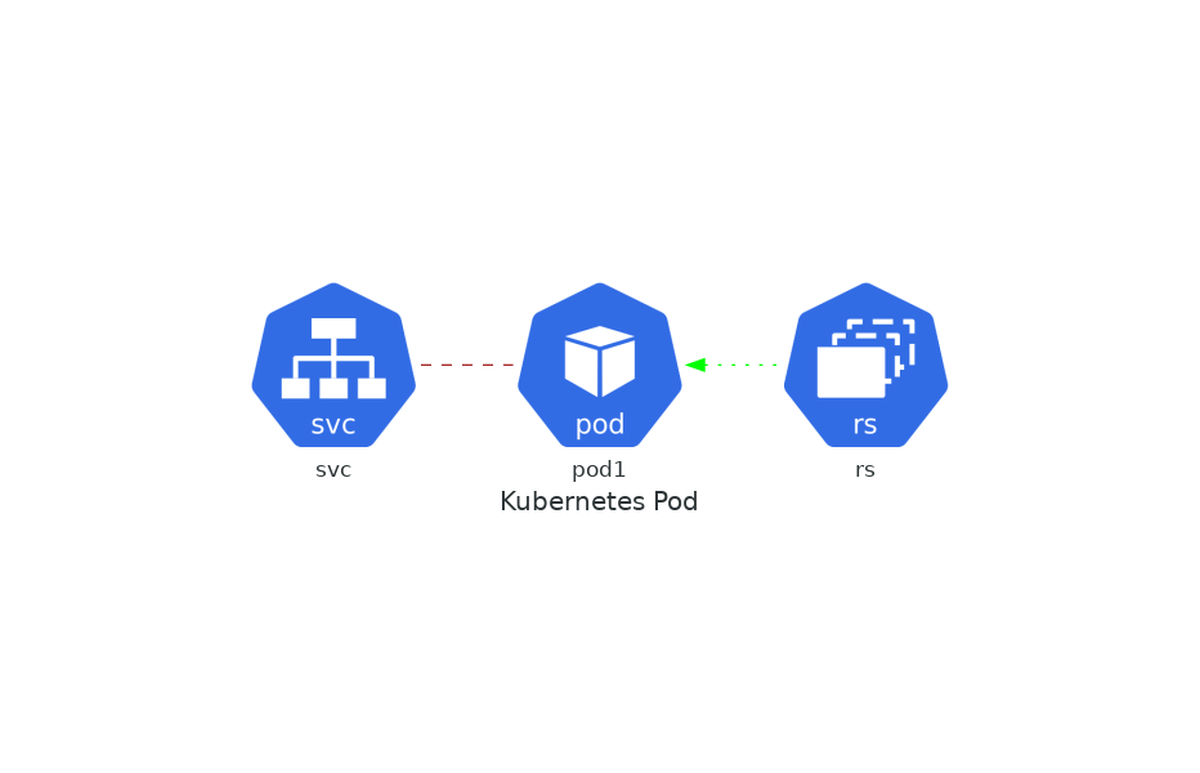
You can change the color and shape of the arrows and bars as shown in the image below.
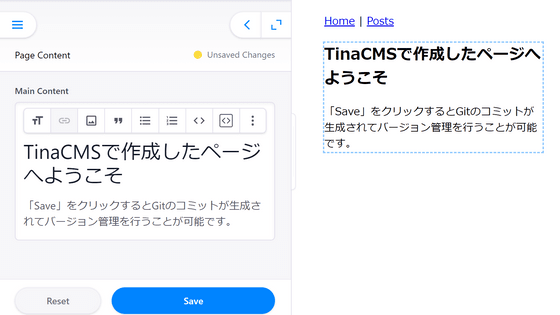
If you want to display the diagrams all together, import the Cluster class and create a Cluster instance within the with block that describes the Diagram instance.
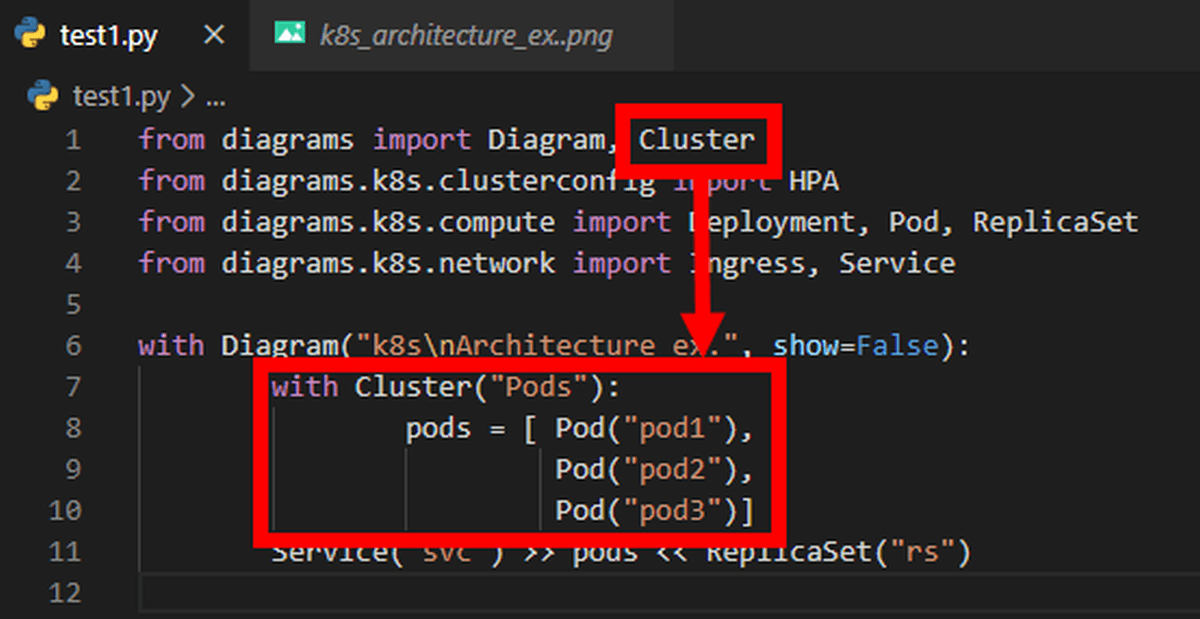
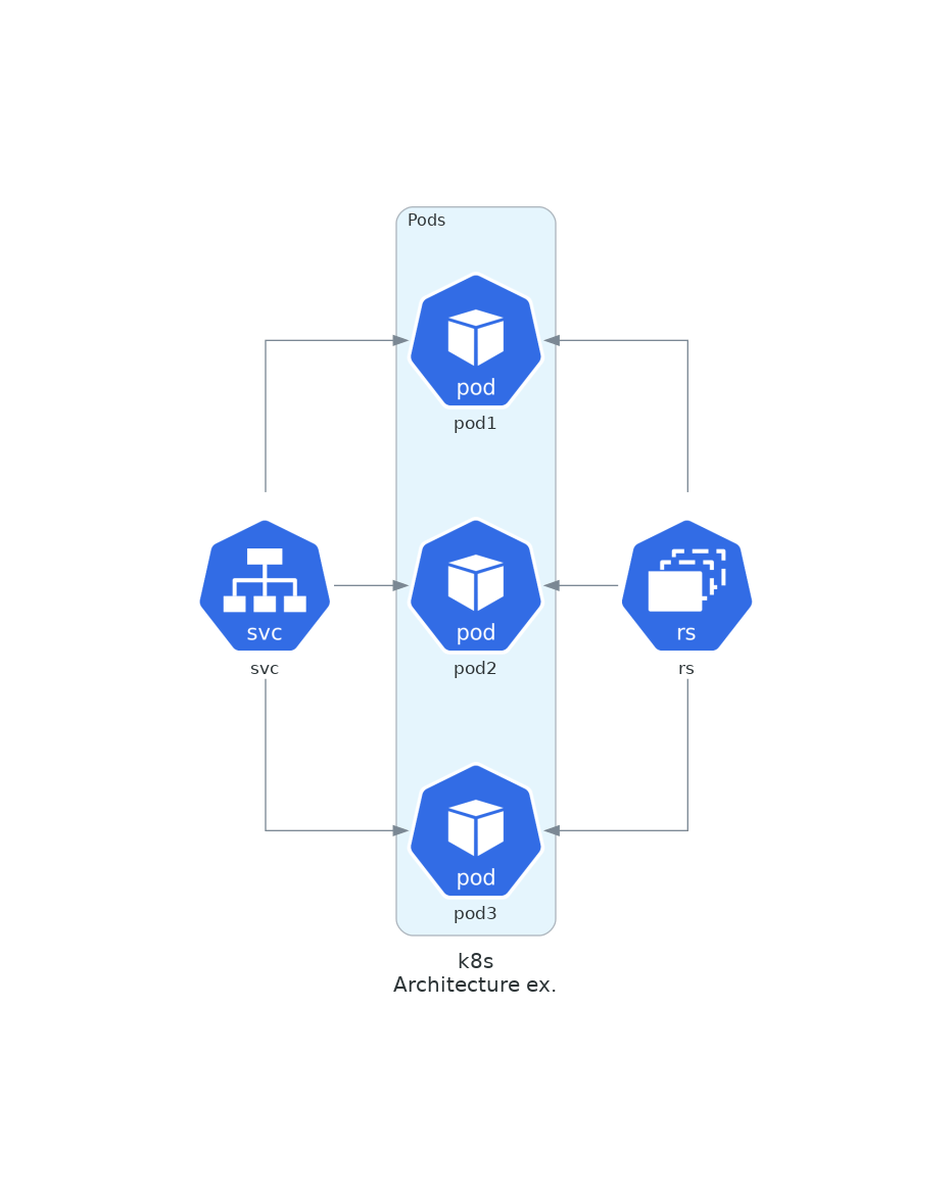
When I run the code, this image is output.
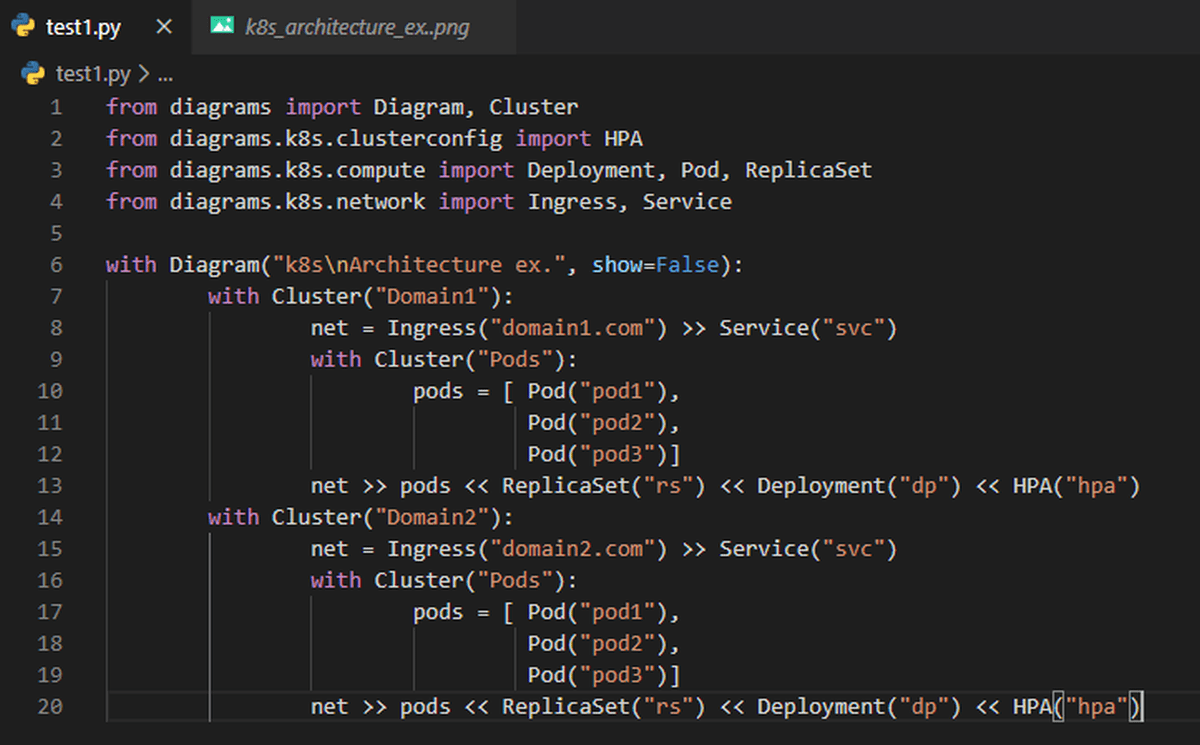
Even if you draw two identical configurations ...
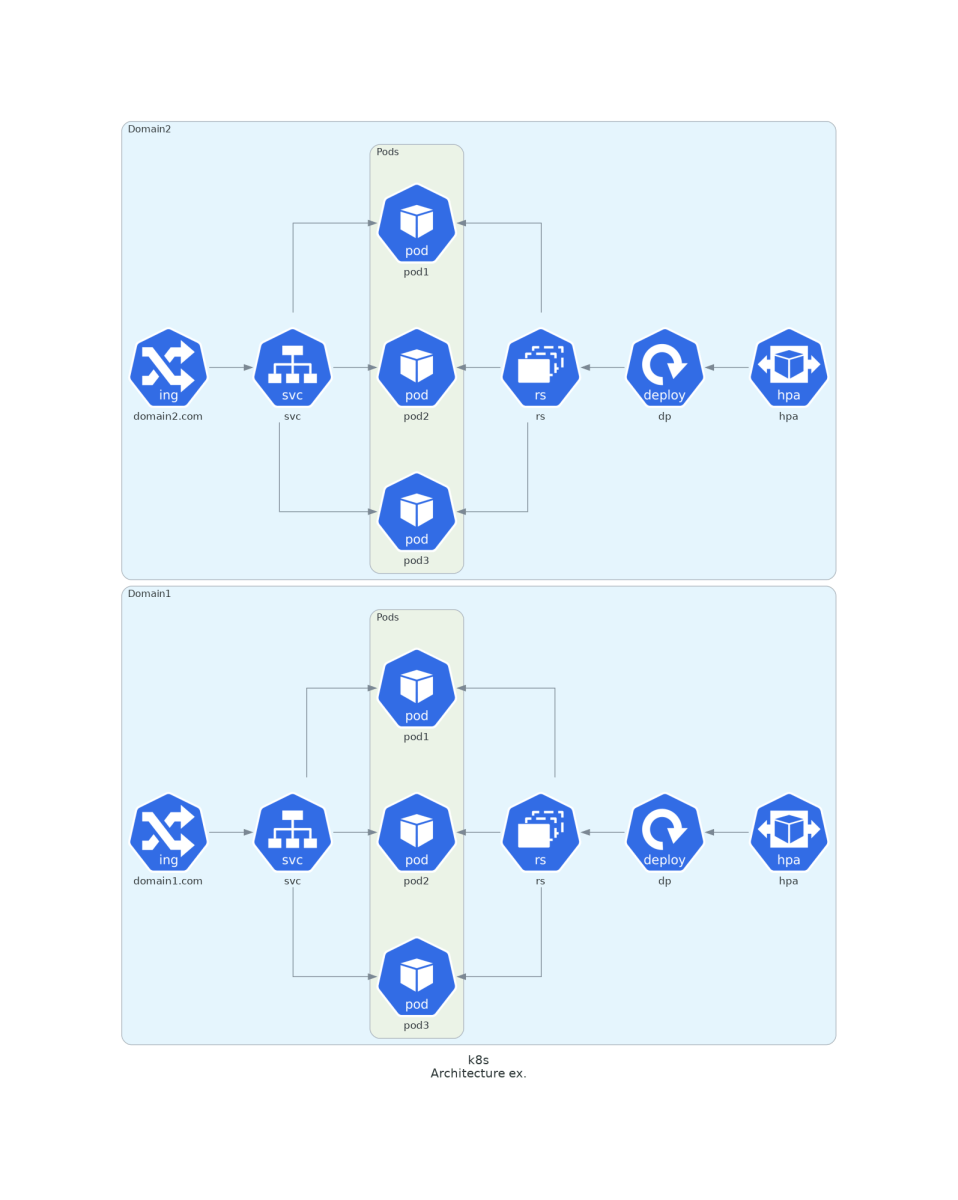
It's easy because you just copy and paste the code.
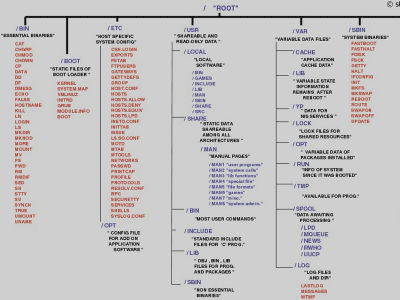
You can see the icons that can be used from the following.
Doc Diagrams
https://diagrams.mingrammer.com/docs/nodes/onprem
Related Posts: