"Darkstat" which can graph the Linux traffic statistics in a simple way
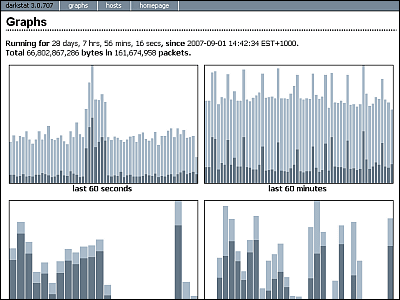
There are various software to capture and analyze packets, but this "DarkstatIt is uri that it is still simple and yet lightweight among them. Although it is simple, it is possible to view graphs from the last 60 seconds to the last 31 days via a built-in mini server, check the transfer amount for each connected host, check the transfer amount of each host It is possible to display up to statistics by port and protocol.
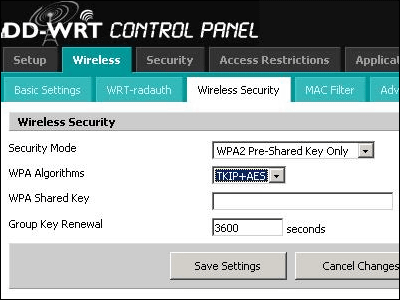
Firmware that extends wireless LAN access point "OpenWrt"It is also adopted and it is quite nice feeling.
Details are as below.
Darkstat
http://dmr.ath.cx/net/darkstat/
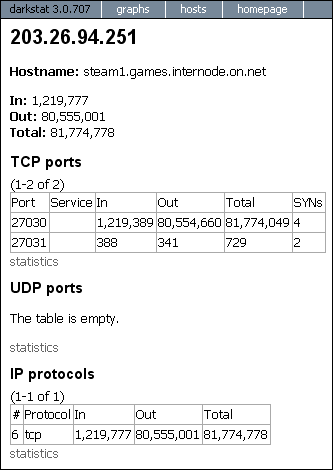
Statistics by host connected in this way are also possible

We can also display further details of each host
To actually use it, first download the file
wget http://dmr.ath.cx/net/darkstat/darkstat-3.0.707.tar.bz2
Expand.
Tar jxf darkstat - 3.0.707.tar.bz2
Move directory.
Cd darkstat - 3.0.707
And installation, it is done quickly.
./configure; make; make install
If you do not have libpcap, you will get an error such as "configure: error: can not find usable libpcap", so in that case you can install it without problems after installing libpcap in advance.
If you want to install with RPM, we have all of them below.
DAG: darkstat RPM packages for Red Hat, CentOS and Fedora
In the meantime, to start up and monitor all traffic coming in and out, do as follows.
Darkstat - i eth 0
Then it is displayed as follows.
Darkstat 3.0.707 (built with libpcap 2.4)
Darkstat (12722): starting up
Darkstat (12722): daemonizing to run in the background!
Darkstat (12723): I am the main process
Darkstat (12724): set uid / gid to 99/99
Darkstat (12723): DNS child has PID 12724
Darkstat (12723): caplen is 54
Darkstat (12723): capturing in promiscuous mode
Darkstat (12723): listening on 0.0.0.0: 667
Darkstat (12722): parent waiting
Darkstat (12723): loaded 129 protos
Darkstat (12723): loaded 253 tcp and 217 udp servs, from total 477
Darkstat (12723): chrooted into: / var / empty
Darkstat (12723): set uid / gid to 99/99
Darkstat (12723): local_ip update (eth 0) = ***. ***. ***. **
Darkstat (12723): entering main loop
Darkstat (12722): parent done reading, calling waitpid
Darkstat (12722): waitpid ret 0, status is 134533031
In the third line, "daemonizing to run in the background!" Indicates that the service automatically operated as a daemon, and "12723" on the fourth line is the PID. Therefore, when stopping it
Kill-9 12723
Or,
Killall darkstat
In case you can stop it.
あとは「http://そのサーバのIPアドレス:667」として接続すればグラフなどを見ることができるというわけ。
Also,Linux.comAccording to the explanation, it is possible to change to a port number other than 667 by "- p" or to monitor only a specific port number with "- f". To monitor only port 22 of SSH, do as follows.
Darkstat - i eth 0 - l 192.168.0.0 / 255.255.255.0 - f "port 22"
When you read the manual, it is possible to output statistical results to a text file. It seems to be applicable to a wide range of applications.
Related Posts:
