'Draw the.net' review that allows you to draw a network configuration diagram from abundant icons with free & YAML
The system configuration of web services changes day by day, and many people want to perform version control in the same way as program code. With the free open source software ' drawthe.net ', you can draw a network configuration diagram in
GitHub --cidrblock / drawthe.net
https://github.com/cidrblock/drawthe.net
drawthe.net: Enterprise NTP
http://go.drawthe.net/
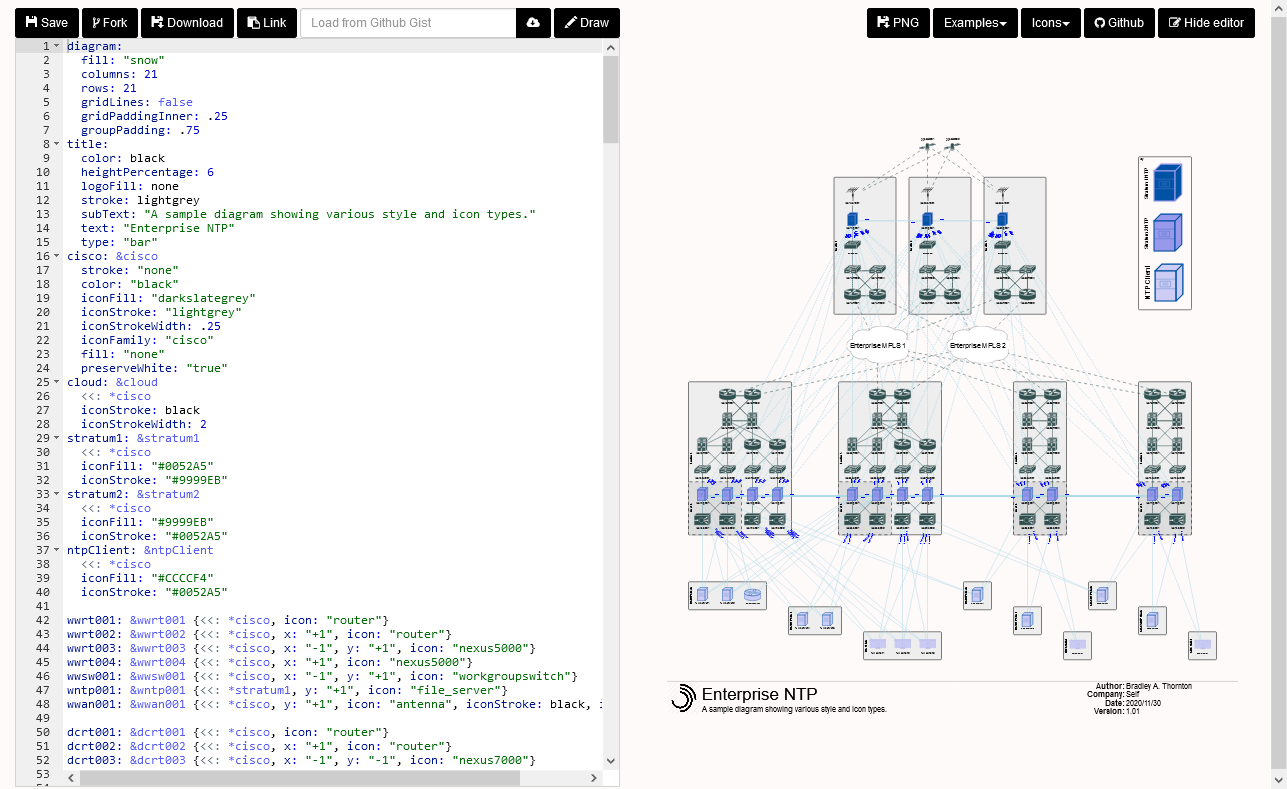
Since the source of drawthe.net is open to the public, you can build it yourself, but you can also use the public web app . When I accessed drawthe.net , a configuration diagram of the NTP server was drawn as a sample.
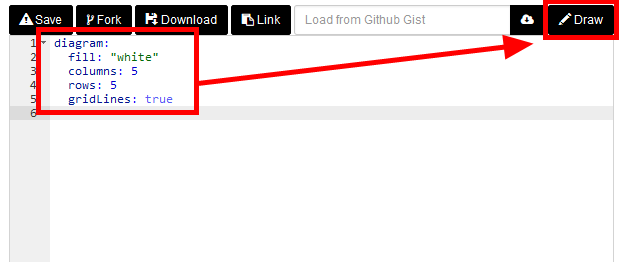
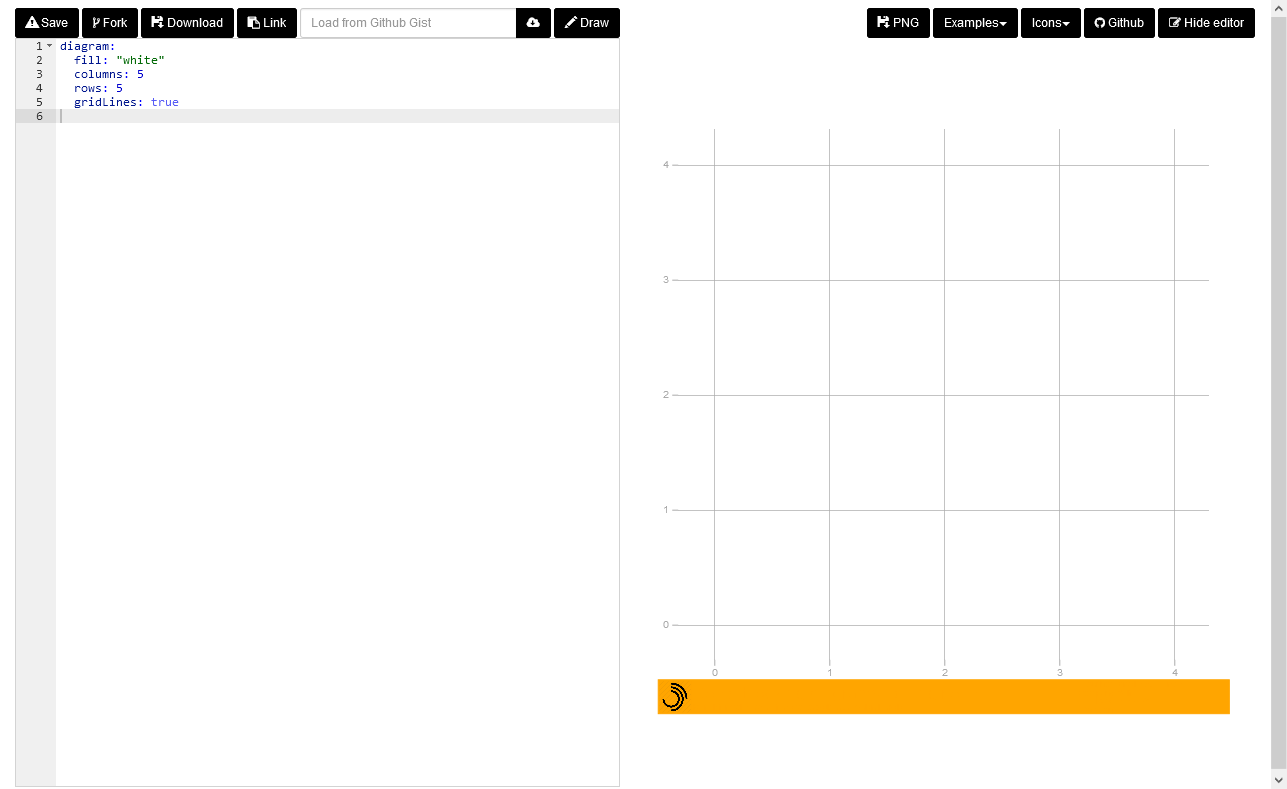
Since I write YAML myself, I deleted all the sample descriptions. First, I described the background of the network configuration diagram and the grid settings. 'Fill' sets the background color, 'columns' and 'rows' set the number of columns and rows, and 'grid Lines' sets the grid on and off. Click Draw to view the network diagram.
The foundation of the network configuration diagram has been drawn.
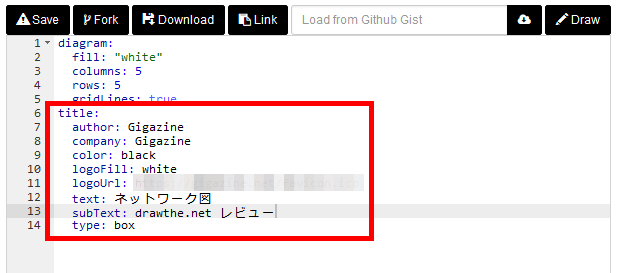
Next, describe the title part of the network configuration diagram. 'Author' and 'company' for the author and company name, 'color' for the text color, 'logoUrl' for the logo URL, 'logoFill' for the logo background fill color, and 'text' and 'subtext' for the title text Set the title type in the subtext, 'type'.
It looks like this when drawn with 'Draw'.
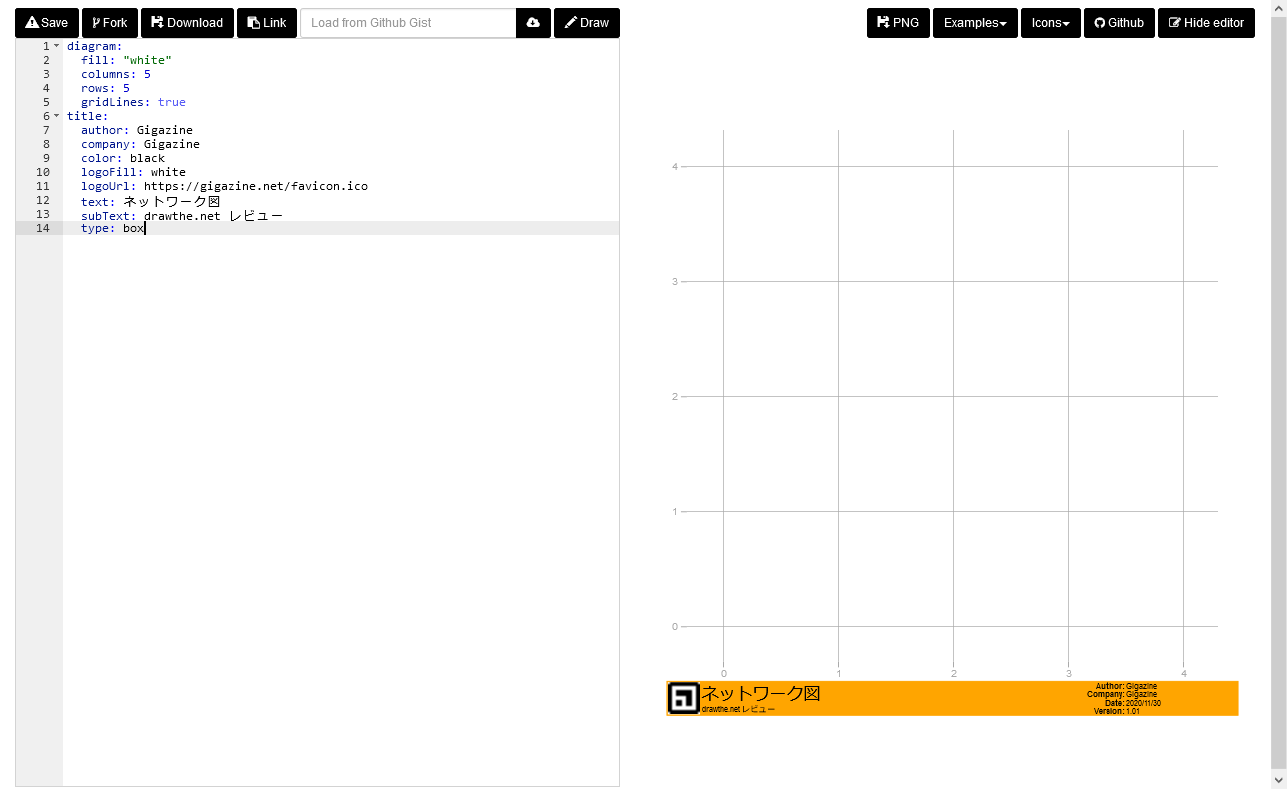
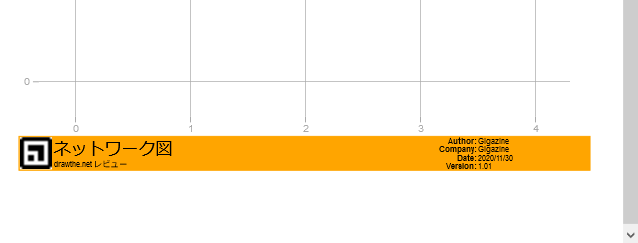
A title has been added at the bottom of the grid.
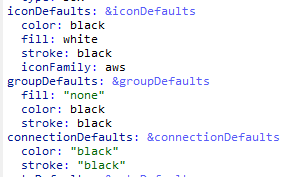
Now that the foundation and title of the network diagram is complete, the next step is to describe the default settings for icons, groups, connections, and comments with 'iconDefaults', 'groupDefaults', 'connectionDefaults', and 'noteDefaults'.
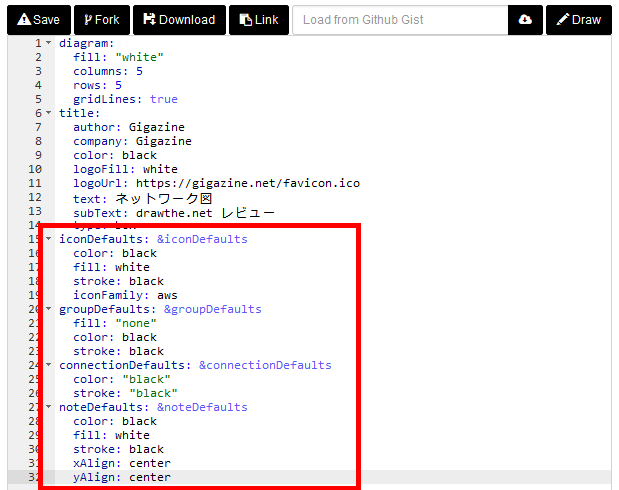
In 'icon Defaults', 'group Defaults', and 'connection Defaults', set the text color with 'color', the presence / absence of fill with 'fill', and the border color with 'stroke'.
You can check the icon types that can be specified in 'icon Family' from the 'Icons' button. For example, if you click 'aws' ...
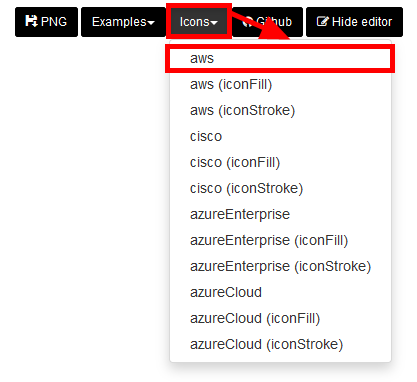
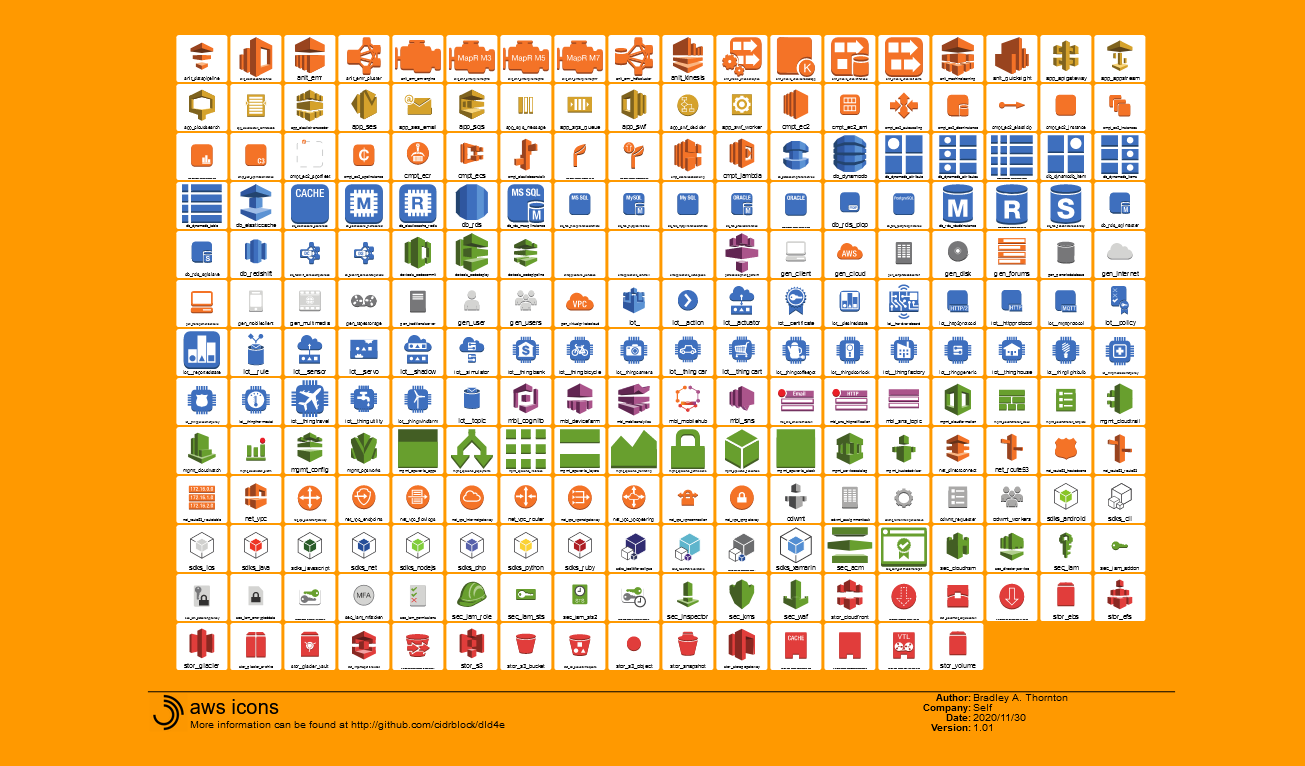
A list of icons available in the icon Family called 'aws' is displayed.
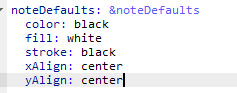
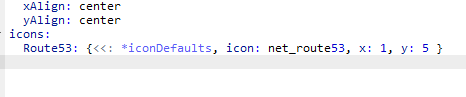
In 'note Defaults', in addition to the text color and border color, you can set the text alignment with 'xAlign' and 'yAlign'.
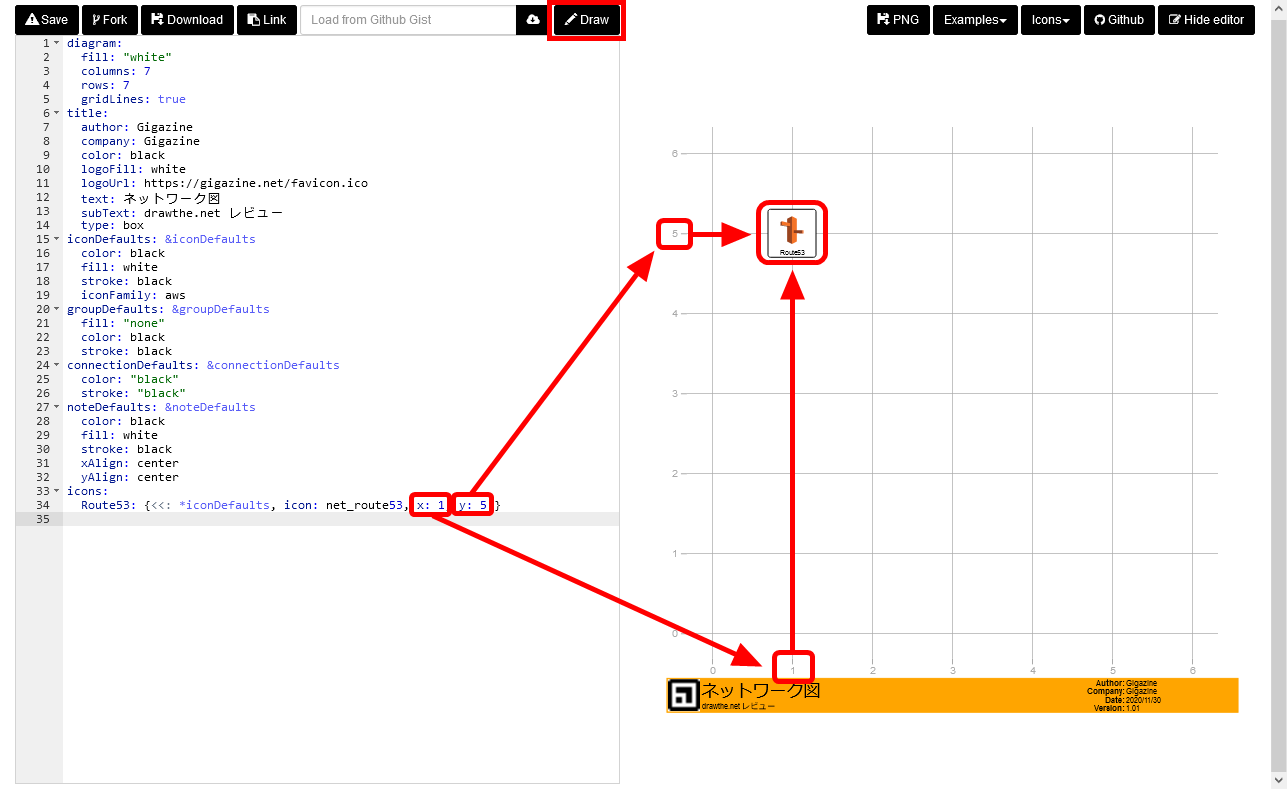
This completes the preparation. Check the icon family icon list set as the default, specify the icon in 'icons', and specify the coordinates to place the icon with 'x' and 'y'.
When I clicked 'Draw', the icon was displayed on the specified axes.
Coordinate axes can be specified not only in absolute value but also in relative value to the icon described above.
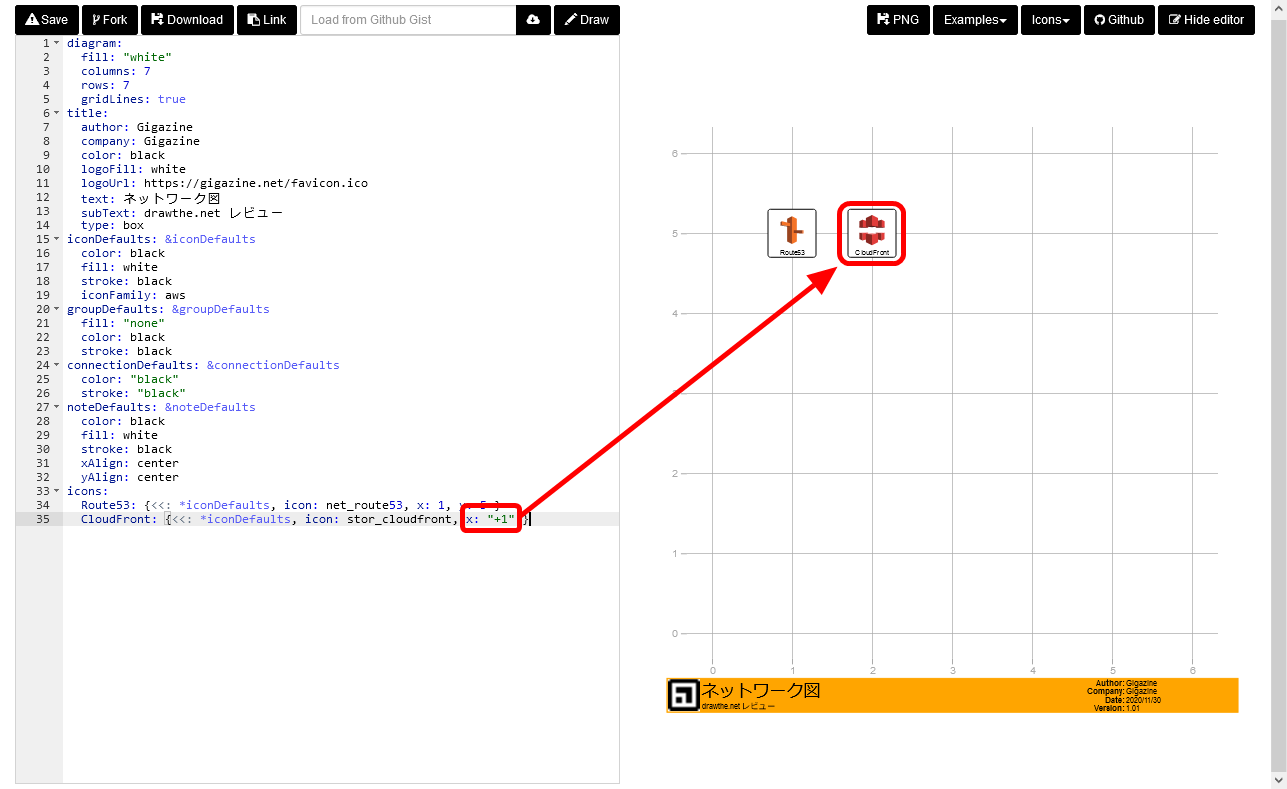
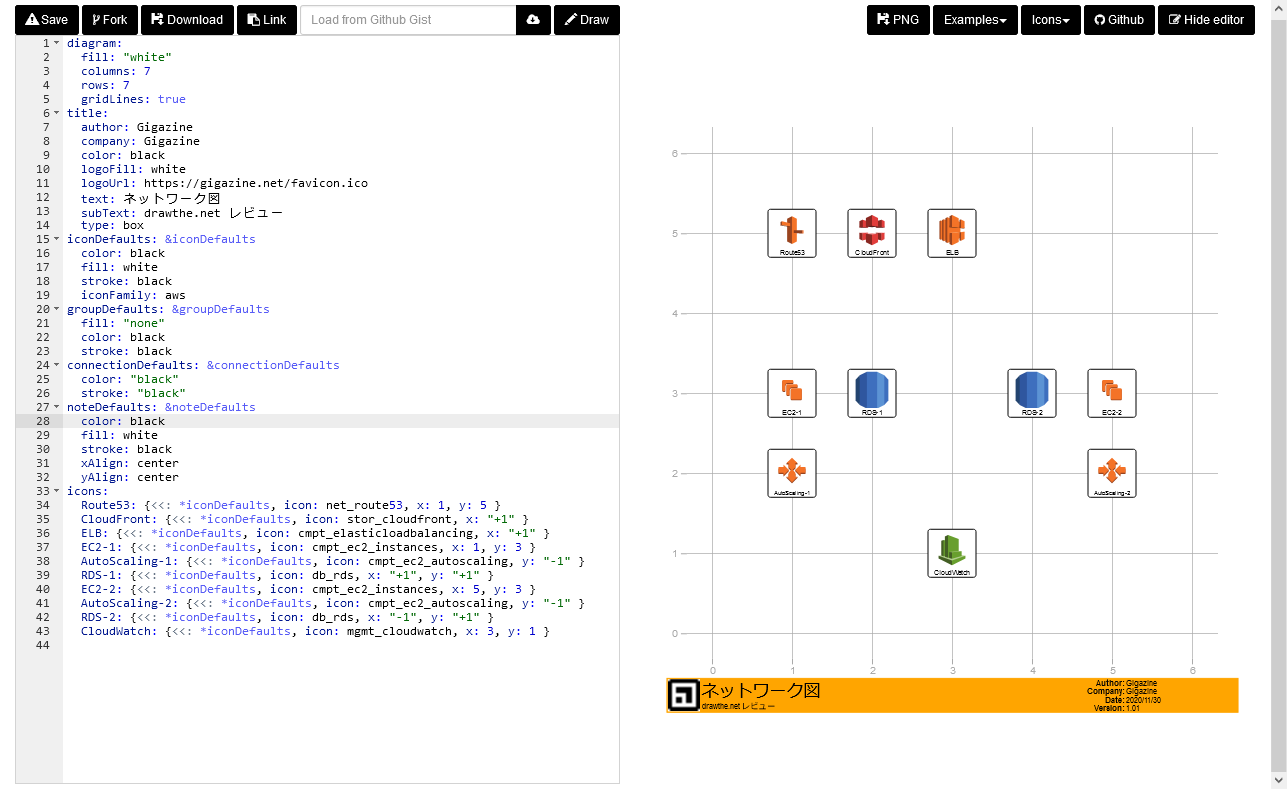
Arrange the icons well while using a combination of absolute and relative values.
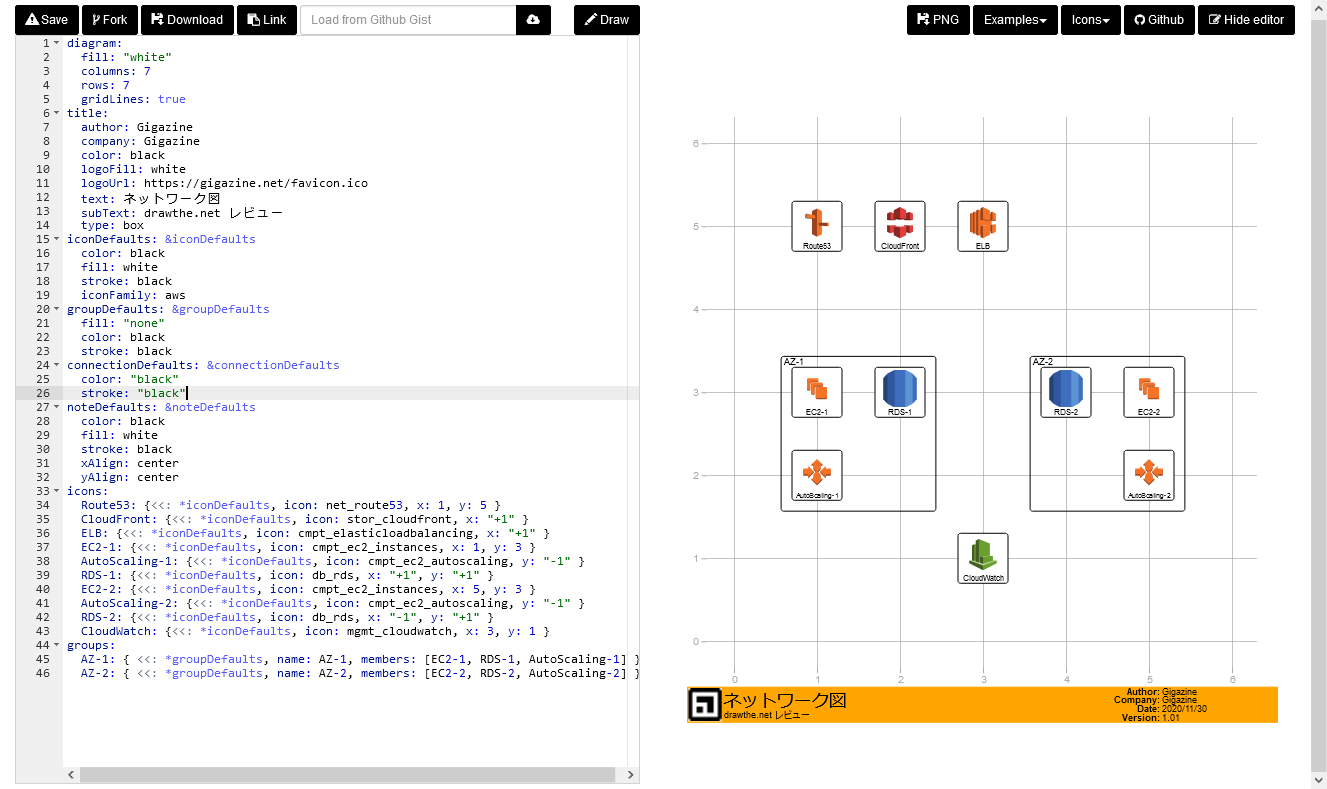
Once the icons have been placed, the next step is to group each component by 'groups'. Specify the group name in 'name' and the grouping icon in 'members'.
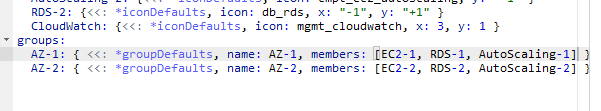
When I drew, the icons were grouped. On AWS, grouping icons by
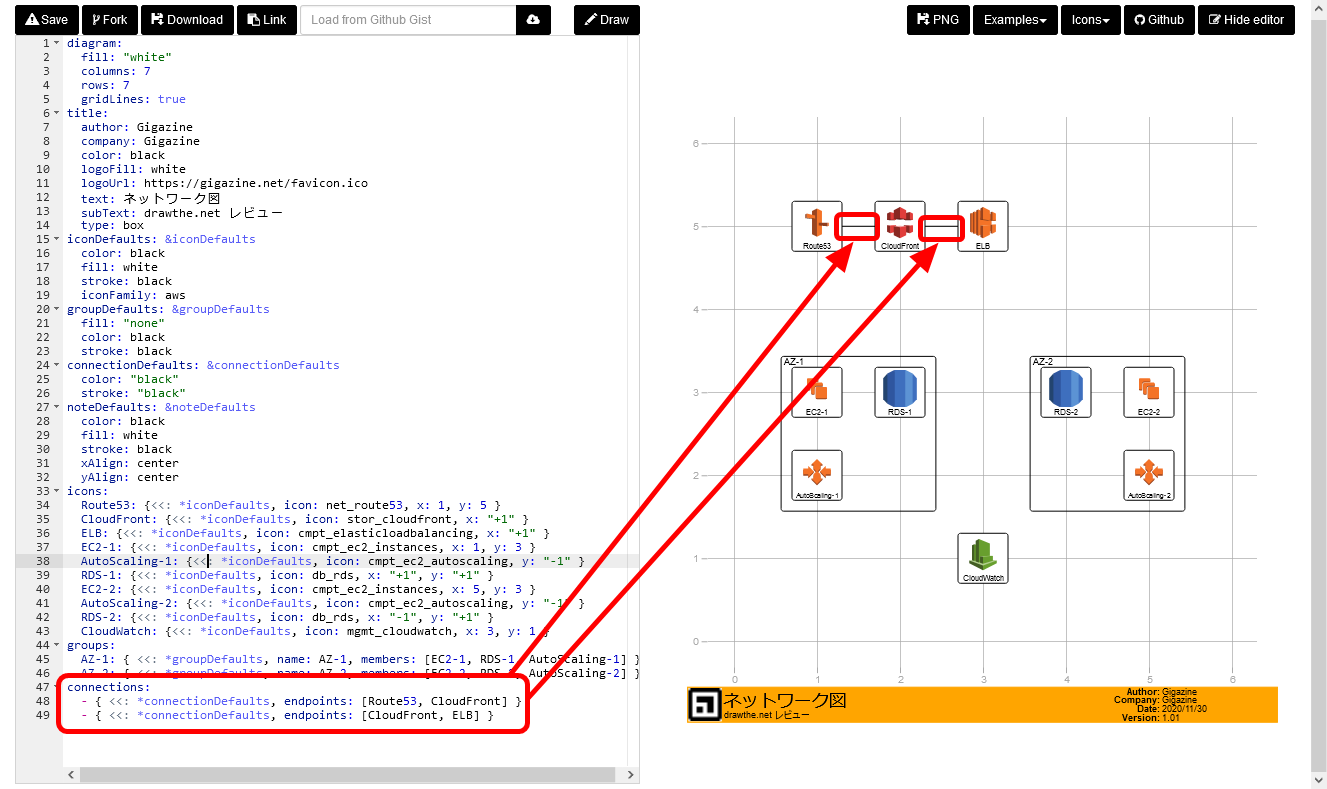
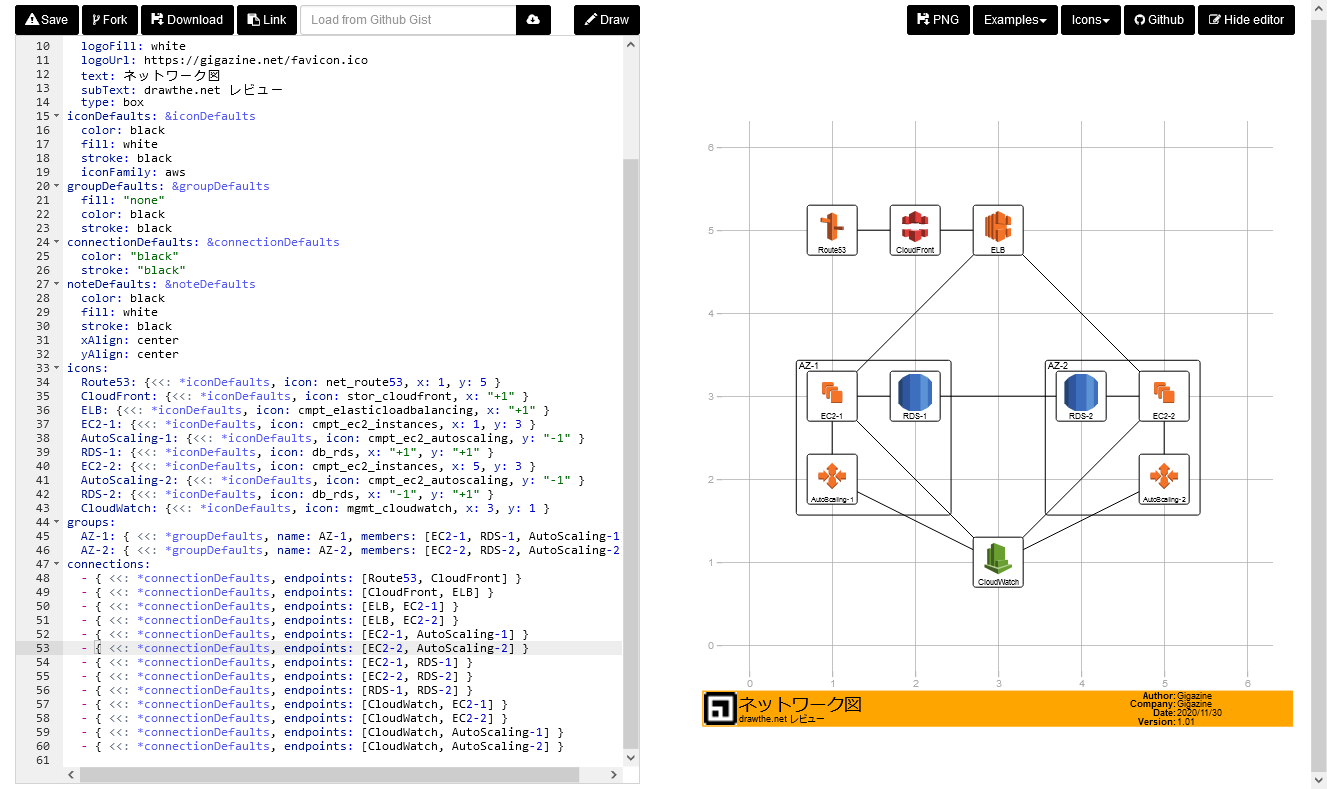
Finally, connect each icon with 'connections'. If you specify the icon you want to connect with in 'endpoints' ...
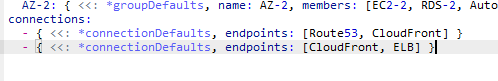
I was able to connect the icons with a solid line.
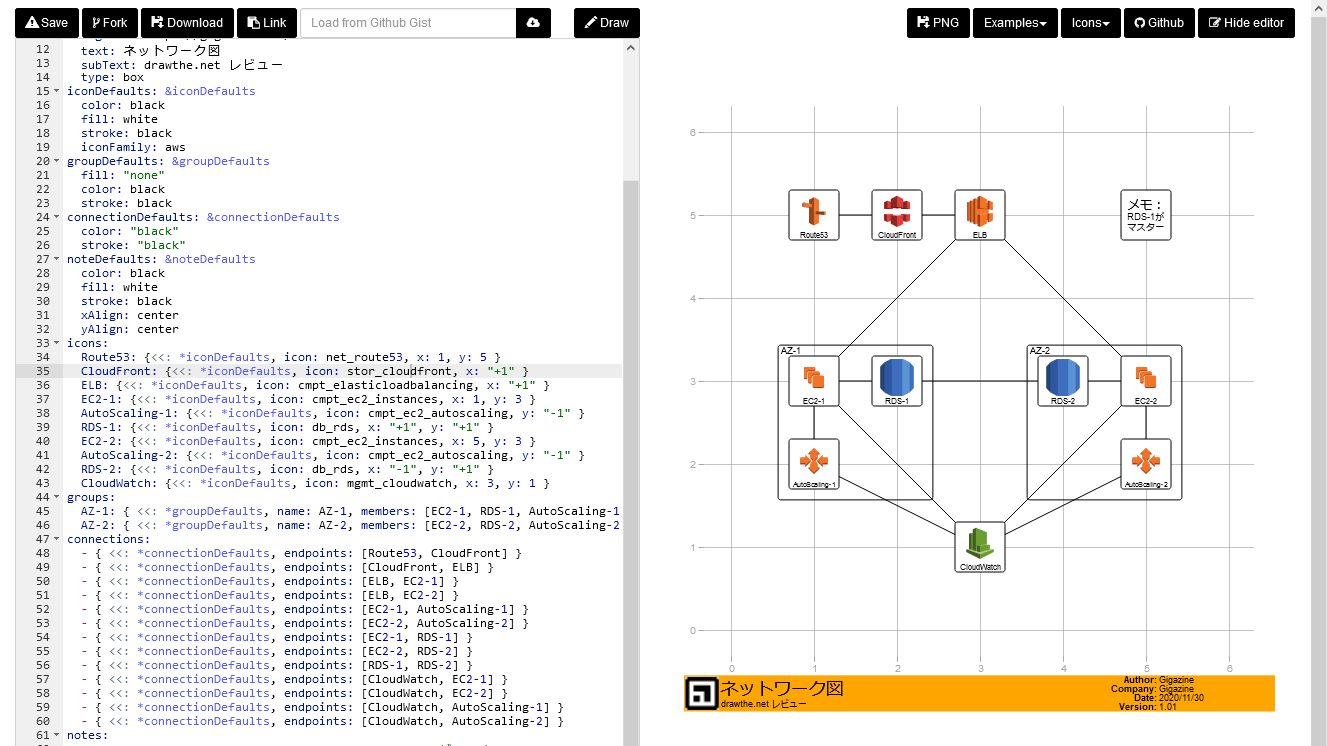
If you connect all the icons you want to connect to, the network configuration diagram is completed.
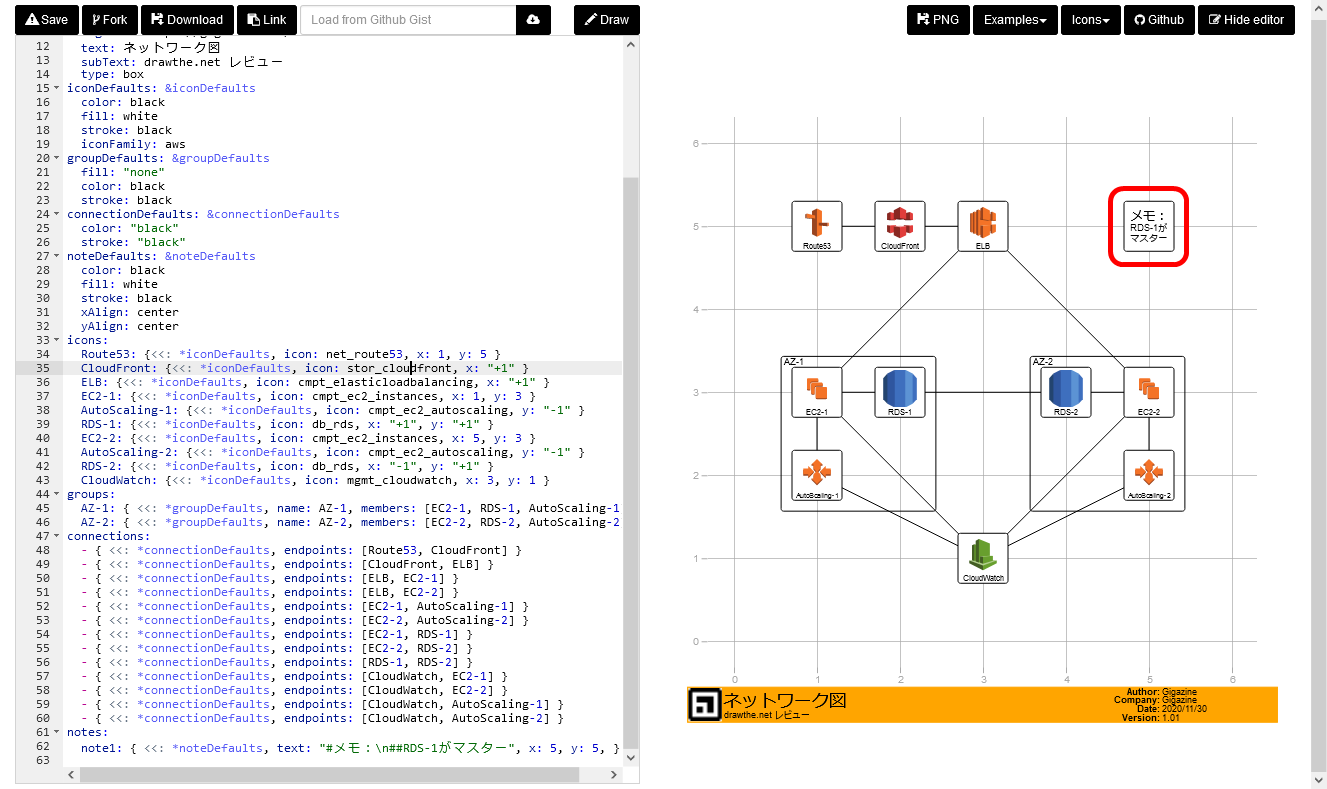
If you want to keep a little note, use 'notes'. Describe the contents of the memo in 'text' and specify the coordinates in the same way as the icon.

Like this, the memo was placed at the specified coordinates.
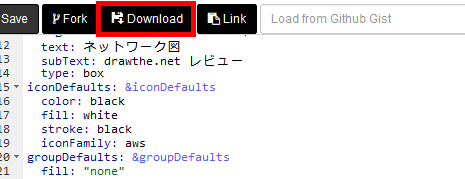
To download the written YAML, click the 'Download' button at the top.
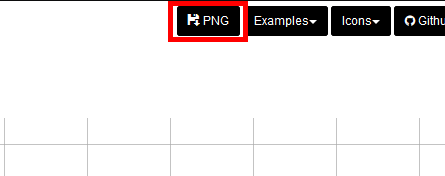
You can download the network configuration diagram itself by clicking the 'PNG' button.
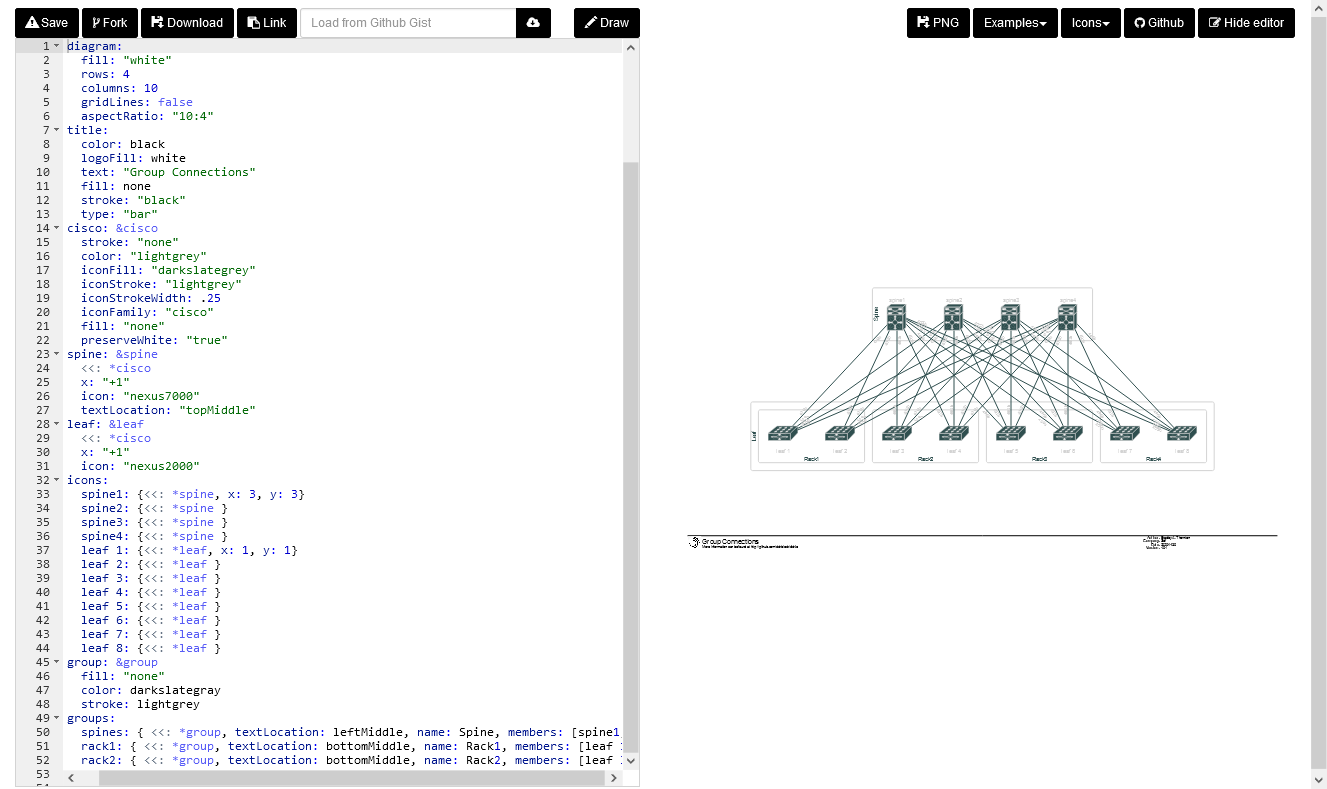
Click the 'Example' button to see a sample that can be used as a reference when drawing a network configuration diagram. If you try clicking 'Group connections' ...
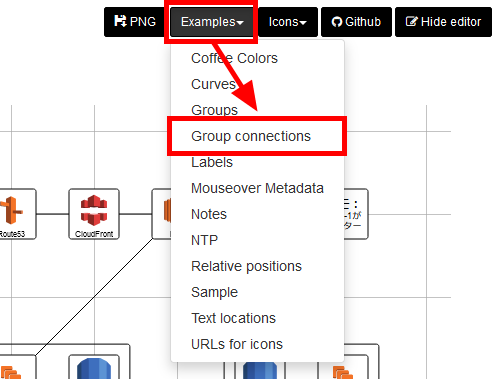
A sample showing how to connect the icons is displayed.
drawthe.net can use icons from the cloud to on-premises ones, and you can easily draw a network configuration diagram. Since you can only write YAML on the browser, you may forget to save it, but it seems to be useful when you want to quickly create a configuration diagram as a presentation material.
Related Posts:

in Software, Review, Web Application, Posted by darkhorse_log