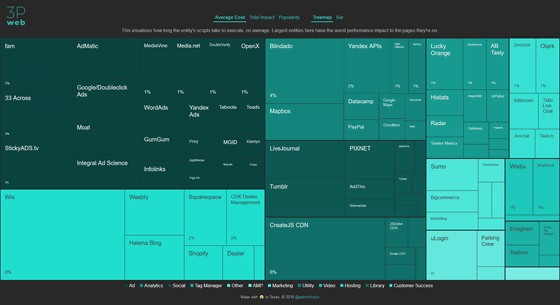
'Third-Party Web' which visualizes the execution time of the third party script etc.

Engineer Patrick Hulce visualizes how long a third-party script takes on the web and how many executions there are in the site ' Third-Party Web ' You are
Data | Third-Party Web
GitHub-patrickhulce / third-party-web: Data on third party entities and their impact on the web.
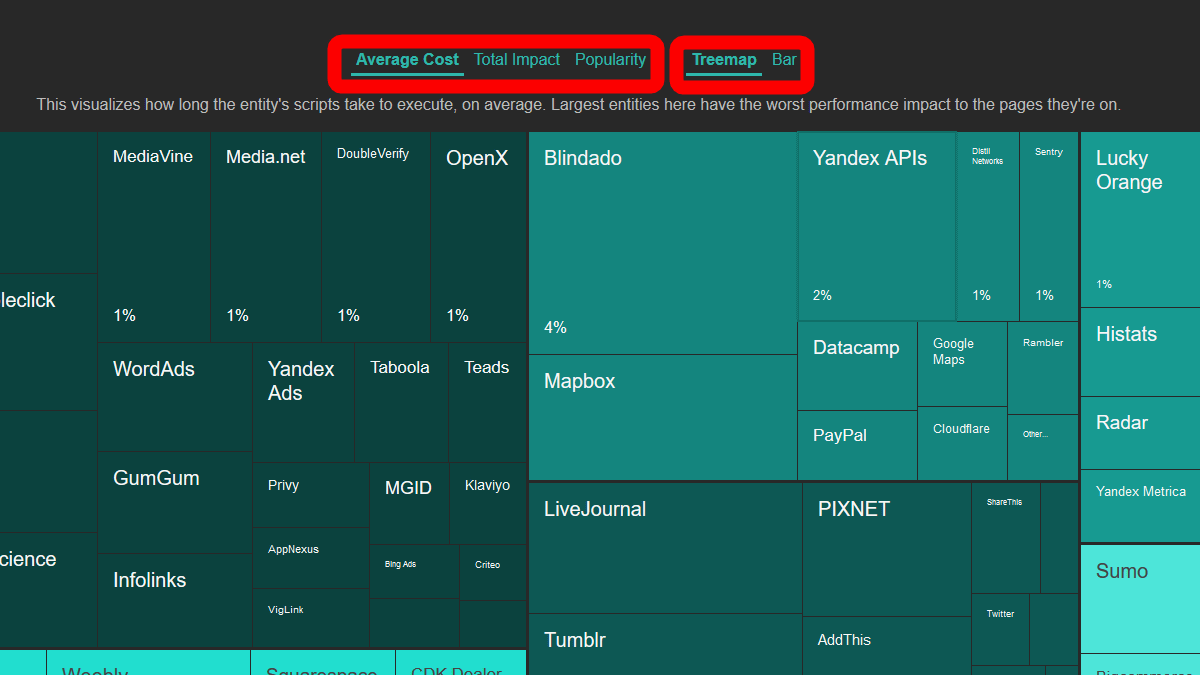
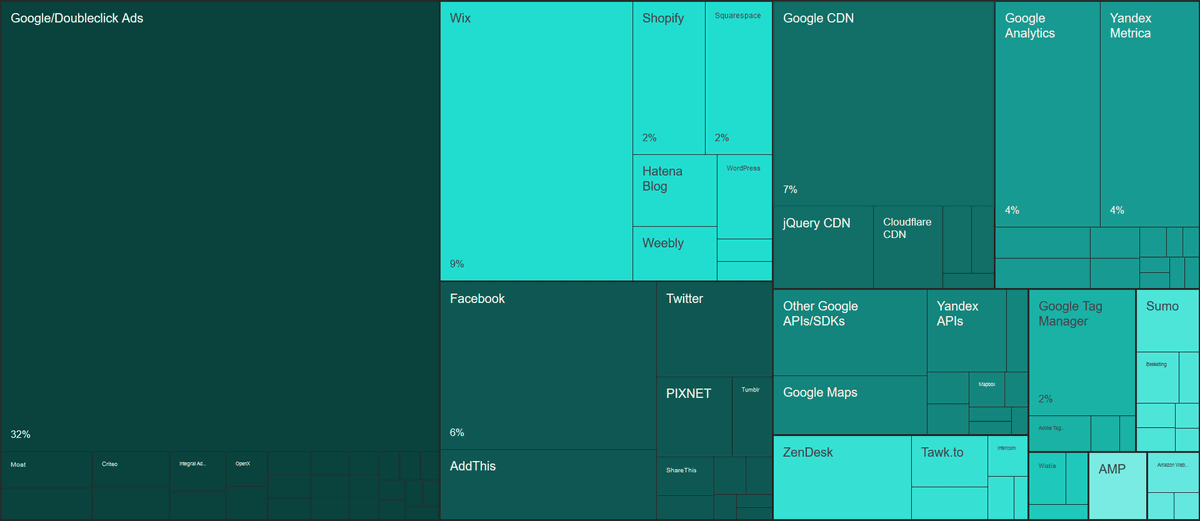
'Average Cost' 'Total Impact' 'Popularity' at the top of the site, 'average execution time of script' 'total execution time of script executed on all the web' 'script included in how many pages' Is displayed. You can also choose to show the treemap or bar graph on the right side 'Treemap' 'Bar'.
Data in 12 categories of 'Advertisement', 'Hosting', 'Analytics', 'Social', 'Complex / Other', '
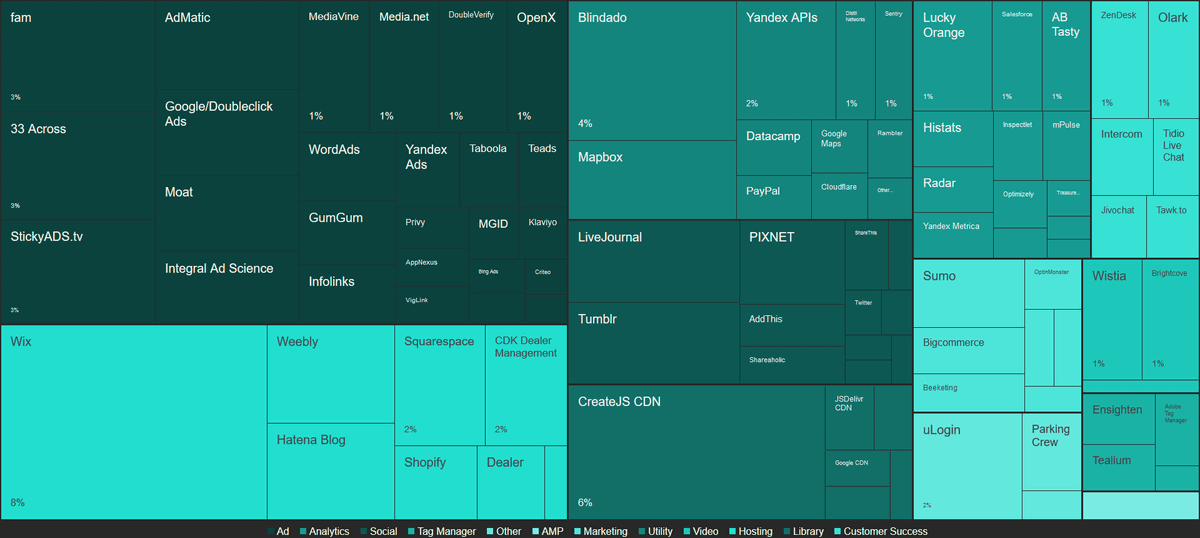
It looks like this shows Average Cost (average execution time of script) in the tree map. The category total with long execution time comes to the upper left, and further sorting is performed in the execution time for each service within that category. Note that the larger the area, the longer the execution time, indicating that page loading is delayed.
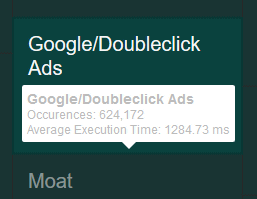
A mouse over will show the number of scripts used and the average execution time.
The same thing is displayed as a bar graph.

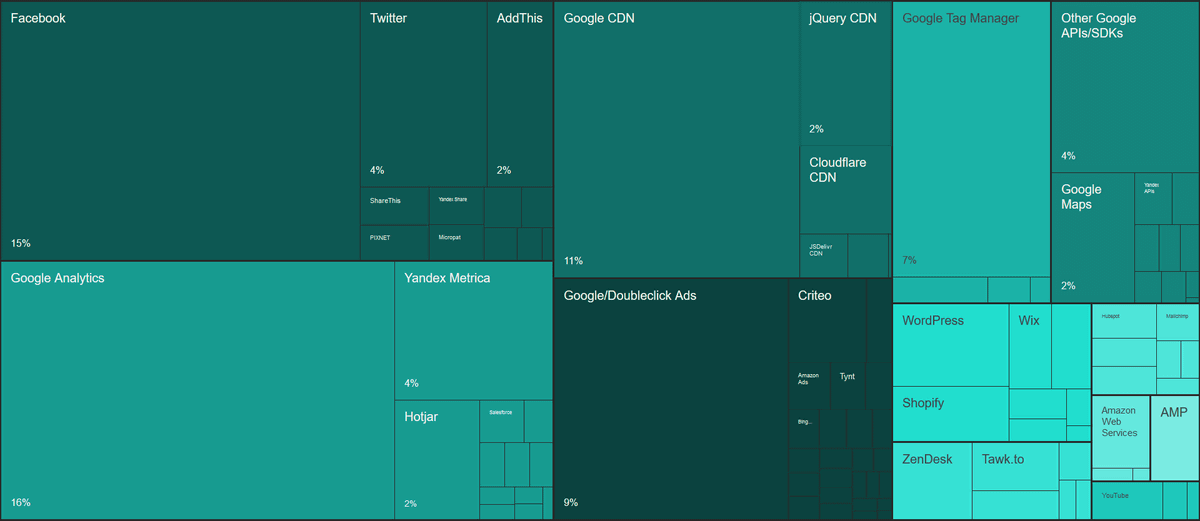
Since 'Total Impact' is the total execution time, even if the execution time per one is short, if the number is large, it will be in the top. Therefore, the 'Ads' category that includes 'Google / Doubleclick Ads' is overwhelming.
In the category total, there are more in the social category, the most of them is 1,025,971 of Facebook. If it is alone, the number of Google / Doubleclick Ads is 1,124,001.
Related Posts:


in Web Service, Review, Posted by logc_nt