'Unlighthouse' tool that can collectively measure the performance of various pages on the site
'
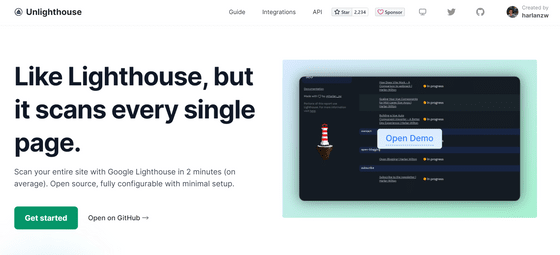
Unlighthouse - Site-wide Google Lighthouse Unlighthouse
https://unlighthouse.dev/
Node.js must be installed to use Unlighthouse. From the URL below, select the installation method that matches your environment.
Installing Node.js using a package manager | Node.js
https://nodejs.org/en/download/package-manager
In order to use Ubuntu this time, I installed Node.js with the following code.
[code]curl -fsSL https://deb.nodesource.com/setup_lts.x | sudo -E bash - &&\
sudo apt-get install -y nodejs[/code]
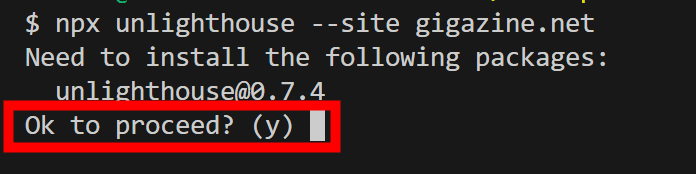
Unlighthouse can be started with one code below.
[code]npx unlighthouse --site [site you want to scan][/code]
You will be asked if you want to install the Unlighthouse package, so press enter to install it.
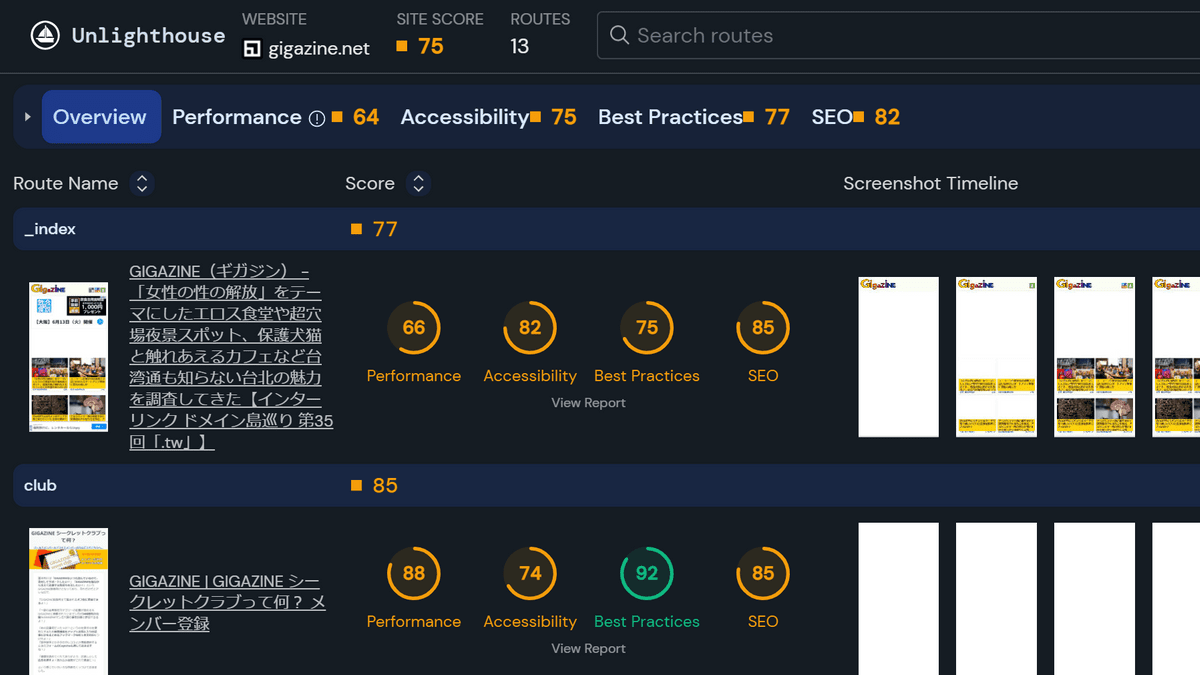
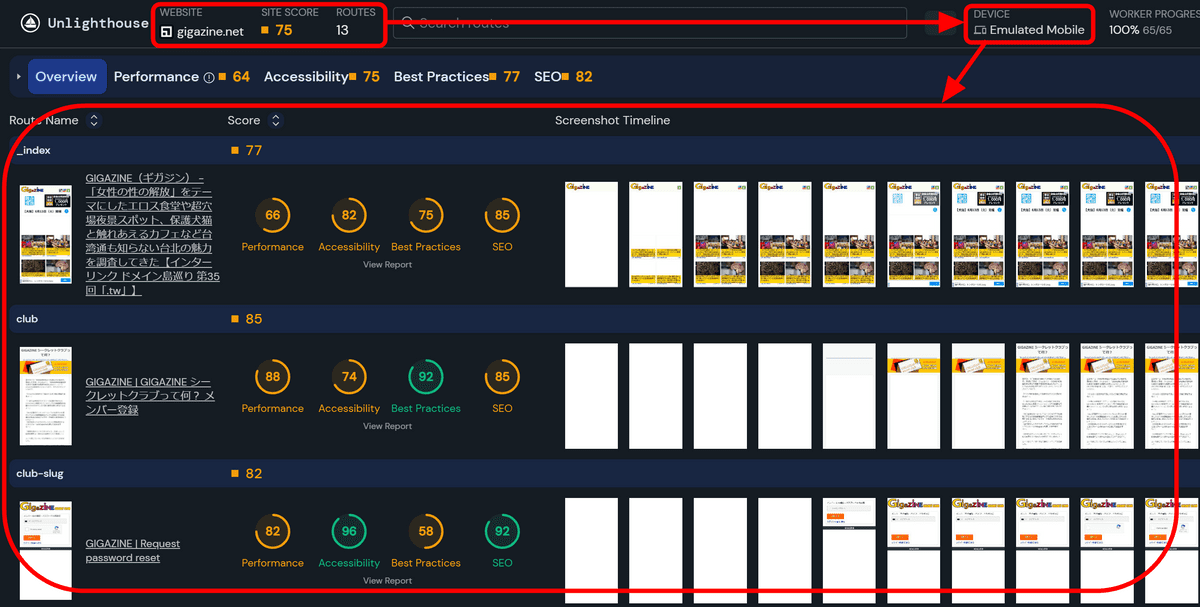
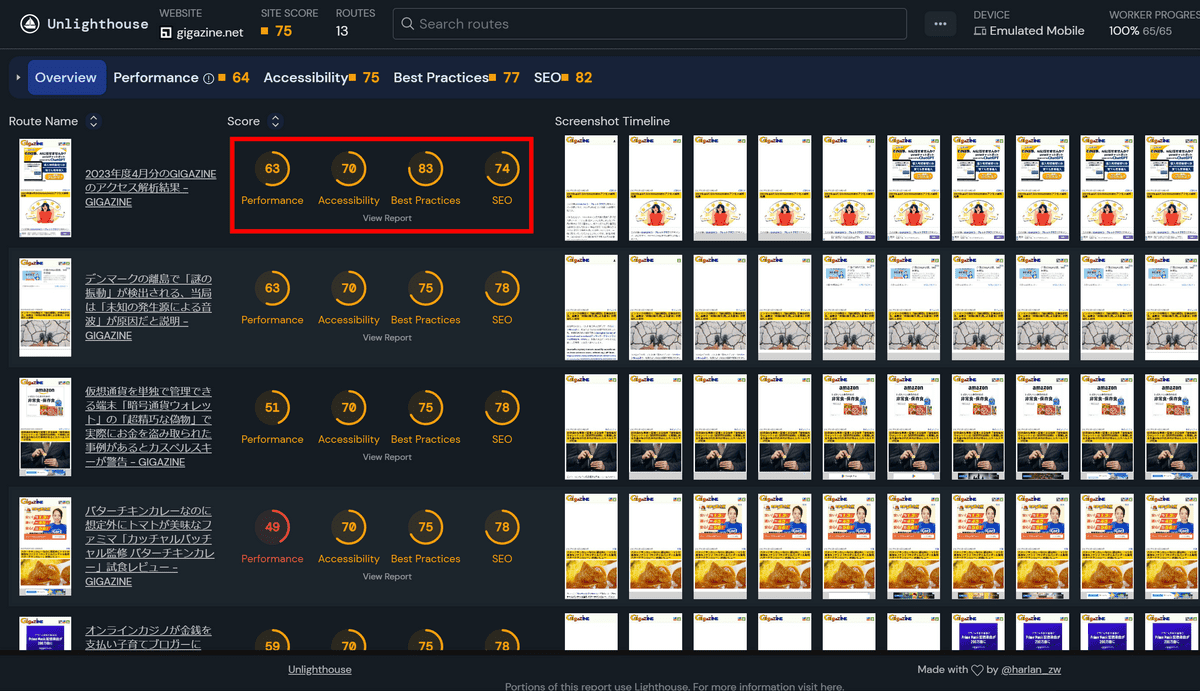
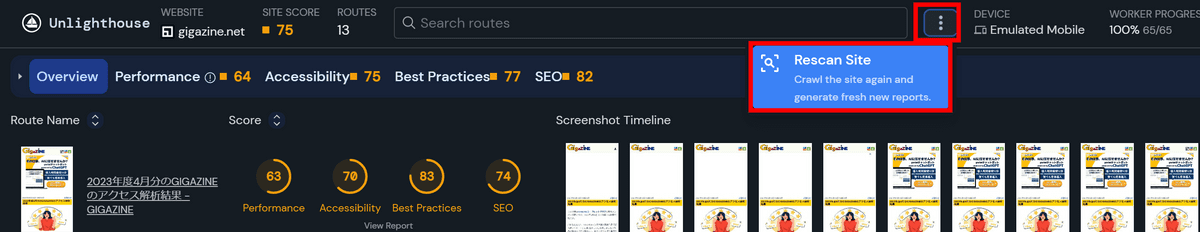
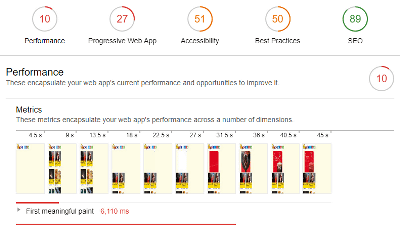
The Unlighthouse screen will be displayed in your browser and scanning will begin. It is said to scan all pages on the site, but similar pages are sampled, and the scan was completed in about 2 minutes even with the number of GIGAZINE level contents. The scanned site, the overall score, and the number of pages scanned are displayed in the upper left, and the scanned mode is displayed in the upper right. And the scanned page and the result are lined up below. The scan mode was fixed at 'Emulated Mobile' and no other modes existed.
Click on the 'Score' column in the results.
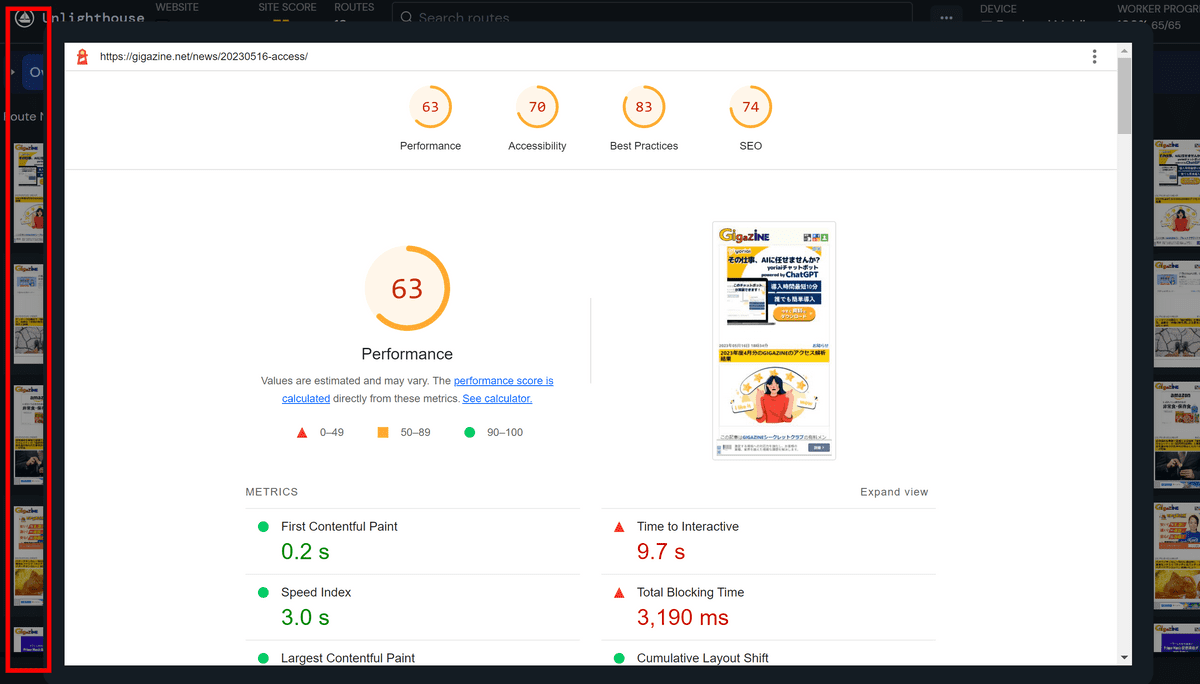
Then the result screen of the original Lighthouse was displayed. If you want to see the results of one page carefully, you should look at this screen. It doesn't have a close button, but you can close it by clicking outside the screen.
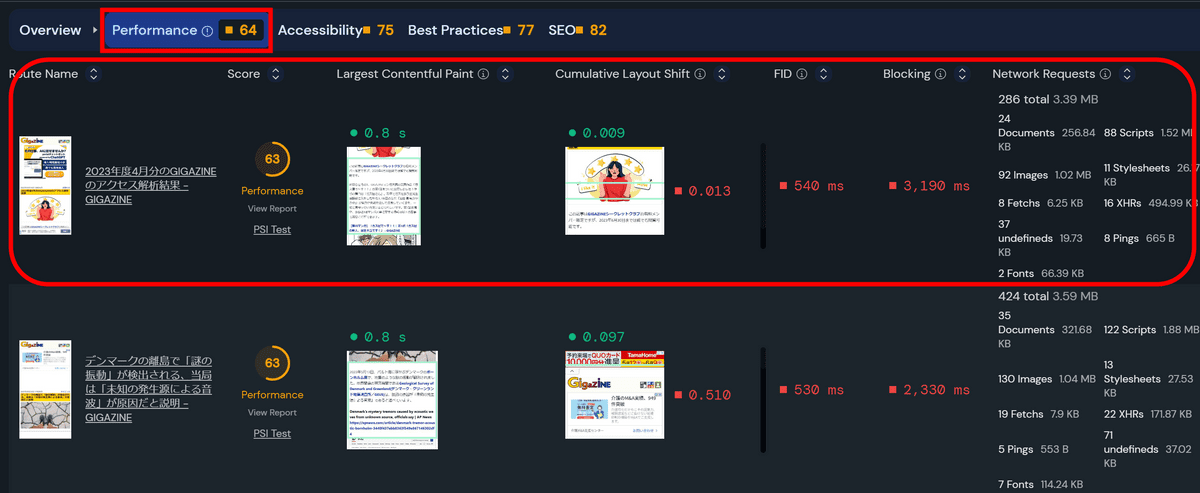
You can also switch tabs at the top of the result list screen. When I clicked 'Performance', it became a screen where performance indicators such as '
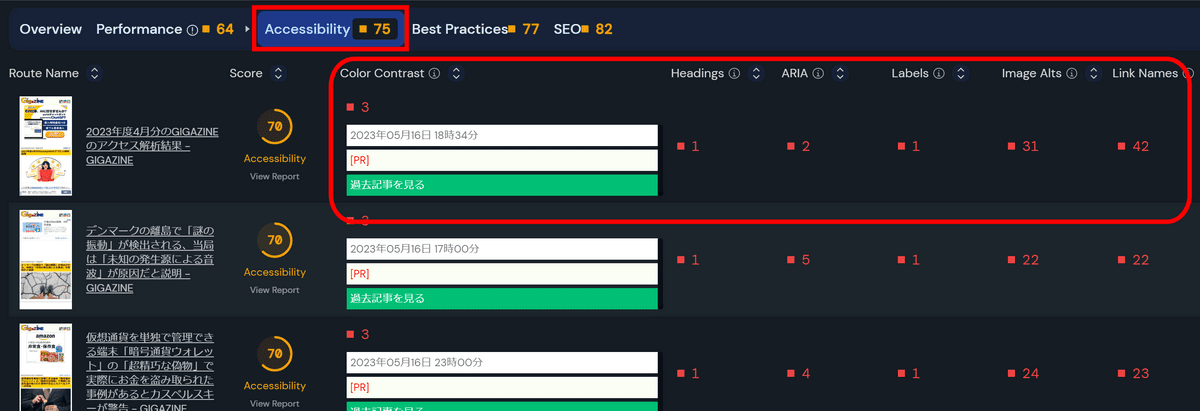
Similarly, on the 'Accessibility' tab, you can check 'content list with insufficient contrast', 'whether H tags are arranged in order', 'whether
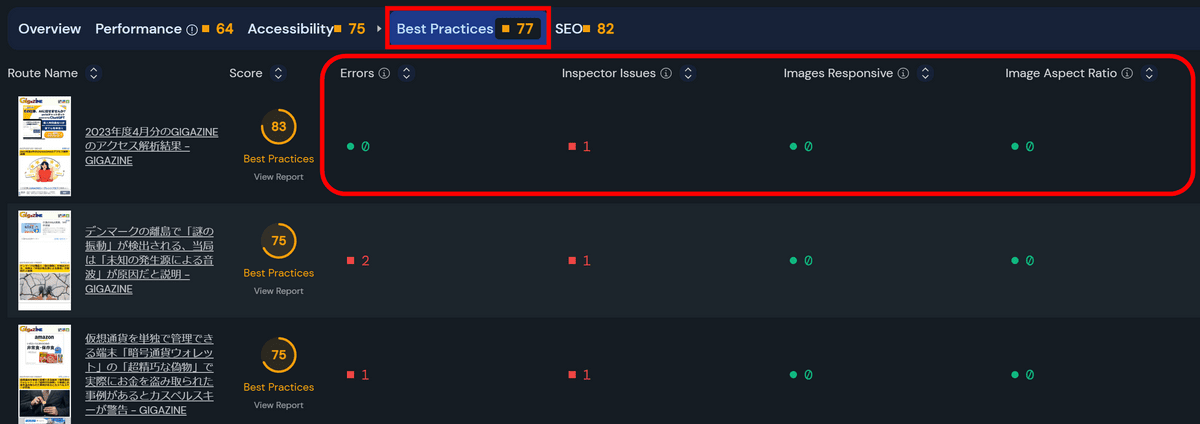
On the 'Best Practices' tab, you can list the number of console errors and
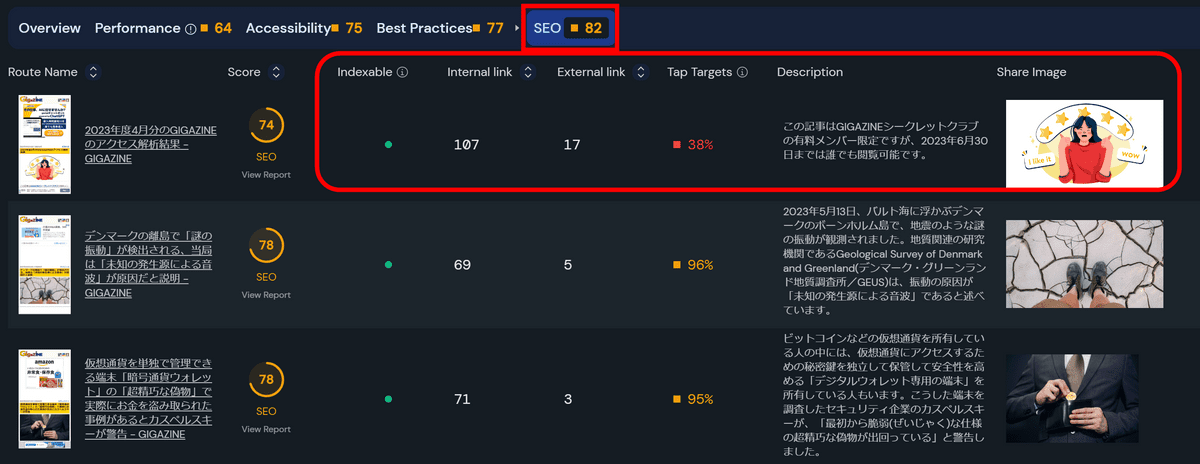
On the 'SEO' tab, you can check whether the page is indexable, the number of internal and external links, the percentage of objects large enough to tap, etc.
Also, it was possible to rescan the entire site by clicking 'Rescan Site' from the three-point mark in the upper right.
Related Posts:


in Software, Review, Web Application, Posted by log1d_ts