Cloudflare report reveals various information such as 'Twitter is popular in Japan' and 'Global internet traffic will increase by 17.2% by 2024'

Cloudflare has released a report titled ' Cloudflare 2024 Year in Review ,' which reveals the internet trends observed throughout the year. Information on what the most popular services are in the world, which is dominant, iOS or Android, etc. is published.
Cloudflare Radar 2024 Year in Review for Japan
Cloudflare 2024 Year in Review
https://blog.cloudflare.com/radar-2024-year-in-review/
According to Cloudflare, the company's network spans more than 330 cities in more than 120 countries or regions, and handles an average of more than 42 million DNS requests and more than 63 million HTTP(S) requests per second. Based on this vast amount of data, the company has identified patterns related to security, traffic, and usage, and compiled information from January 1 to December 1, 2024 in the 'Cloudflare 2024 Year in Review.' Cloudflare publishes data in several categories, including 'traffic trends.'
◆Traffic Trends
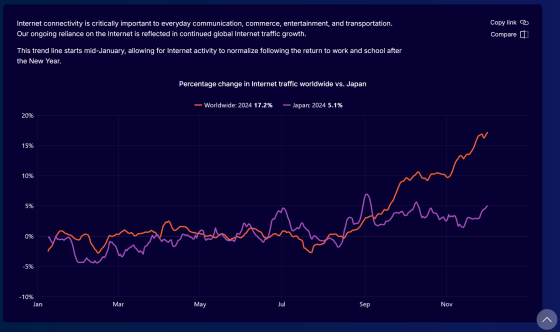
In the graph below, the orange line shows the world's traffic, and the purple line shows Japan's traffic. After the holiday at the beginning of the year, the week of January 8th to 15th was used as a baseline to measure the increase or decrease, and it was found that annual traffic worldwide increased by 17.2% in 2024. Until mid-August, the increase or decrease from the baseline was only 1-2%, but it continued to increase until the end of November. In this way, the trend of increasing traffic in the second half of the year was also seen in 2022 and 2023. On the other hand, in Japan, it has remained almost flat since reaching a peak around September 2nd. The largest amount of traffic was apparently accounted for by Google's web crawler 'Googlebot,' which creates search indexes.
◆ Most popular services
In 2024, the most popular service was Google, followed by Facebook and Apple in second and third place.
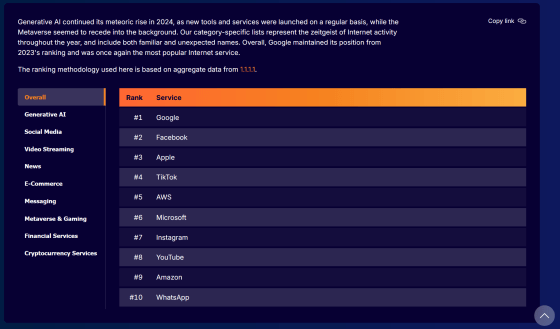
In
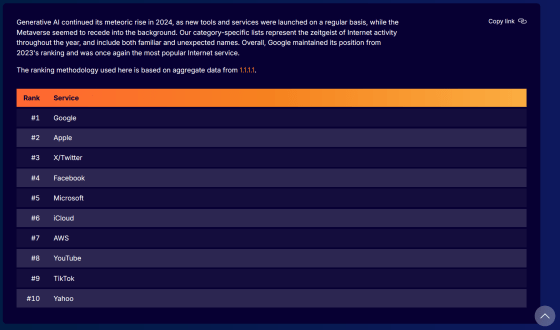
Looking only at generative AI, the most popular in the world was OpenAI's
| No.1 | No.2 | No.3 | |
| Social Media | TikTok | ||
| Video Streaming | YouTube | Netflix | Twitch |
| news | Globo | BBC | NY Times |
| E-commerce | Amazon | Taobao | AliExpress |
| Messaging | Telegram | ||
| Metaverse and Games | Roblox | Xbox/Xbox Live | Epic Games/Fortnite |
| Financial Services | Stripe | TradingView | Alipay |
| Cryptocurrency Services | Binance | Coinbase | OKX |
◆Starlink traffic
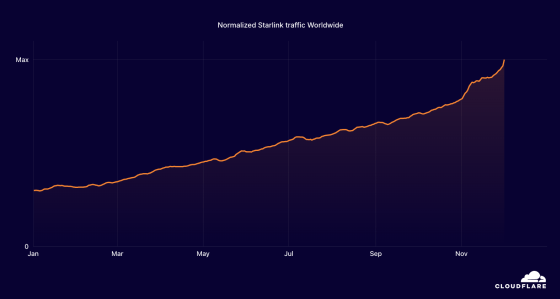
Traffic for Starlink , a service that provides a network to suburban areas using more than 20,000 satellites, increased 3.3 times from the baseline throughout the year. The increase was particularly large in areas where Starlink has begun to operate, with traffic increasing 38 times in Malawi, more than 100 times in Georgia, and more than 900 times in Paraguay.
AI Bot and Crawler Traffic
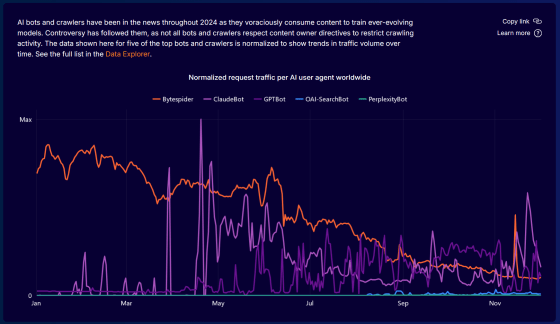
AI companies continue to scrape information from across the internet to train their ever-evolving AI models. These “crawling” trends can be seen below, including a gradual decline in traffic from ByteDance’s AI crawler, Bytespider, towards the end of the year, and Anthropic’s AI crawler, ClaudeBot, which began showing signs of continued crawling activity in April, declining after an initial peak in May and June.
iOS vs. Android
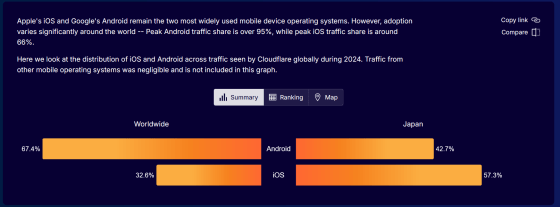
Globally, 67.4% of traffic was from Android and 32.6% was from iOS. In contrast, in Japan, iOS was more prevalent, with 57.3% for iOS and 42.7% for Android. There are other operating systems for mobile devices besides Android and iOS, but Cloudflare says, 'traffic from these operating systems was very small, so they are not included in this chart.'
◆ Most popular technologies on top websites
The results show what technologies are popular in areas such as advertising and analytics tools, compiled from the top 5,000 domains in terms of traffic. We've picked out the top three technologies below.
| No.1 | No.2 | No.3 | |
| advertisement | Microsoft Advertising | Twitter Ads | Linkedin Ads |
| analysis | Google Analytics | Facebook Pixel | Linkedin Insight Tag |
| A/B testing | VWO | Optimizely | Google Optimize |
| CMS | WordPress | Adobe Experience Manager | Contentful |
| Cookie Compliance | OneTrust | TrustArc | Cookiebot |
| JavaScript Frameworks | React | Vue.js | Next.js |
| JavaScript Libraries | jQuery | jQuery Migrate | Slick |
| Marketing Automation | HubSpot | Marketo | MailChimp |
| PaaS | Amazon Web Services | WP Engine | Vercel |
| Programming Techniques | PHP | Node.js | Java |
| Tag Manager | Google Tag Manager | Tealium | Commanders Act TagCommander |
| Web Frameworks | Next.js | Express | Nuxt.js |
◆ Browser share
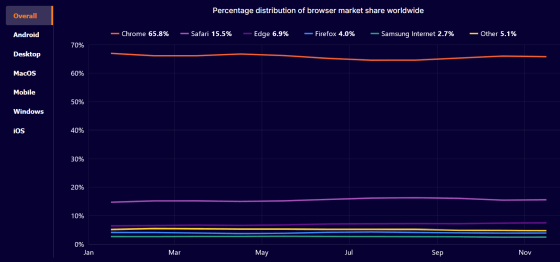
In terms of browser market share, Chrome has an overwhelming 65.8% of the total.
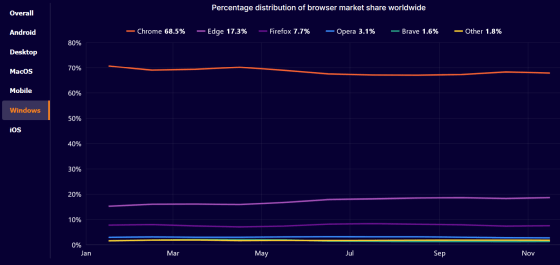
When limited to Windows, Microsoft Edge's share increased from 6.9% to 17.3%, but Chrome still led the pack.
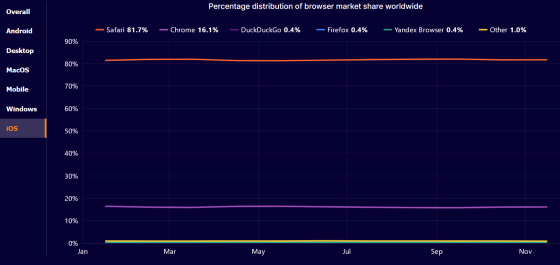
On iOS, Safari dominates at an overwhelming 81.7%.
◆Internet shutdown
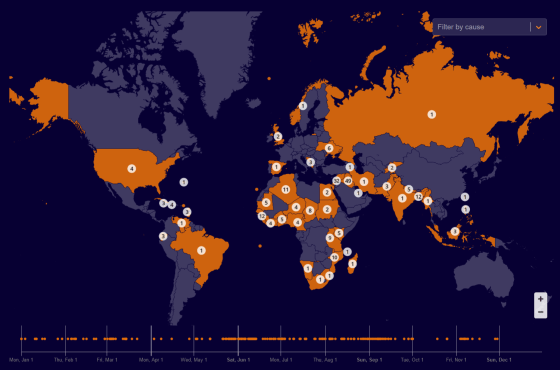
There are many areas where the Internet is cut off due to disasters or government intentions. The areas where large-scale shutdowns have been confirmed and the number of times they have occurred are summarized by country, as shown below. Of particular note is the fact that the Internet has been cut off 32 times in Syria and 49 times in Iraq.
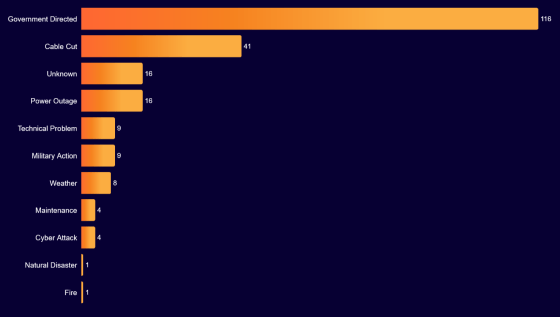
The most common cause was government orders, followed by cable cuts. In Syria, 25 out of 32 out of 49 out of 49 out of 50 out of 50 were government orders.
◆Network quality
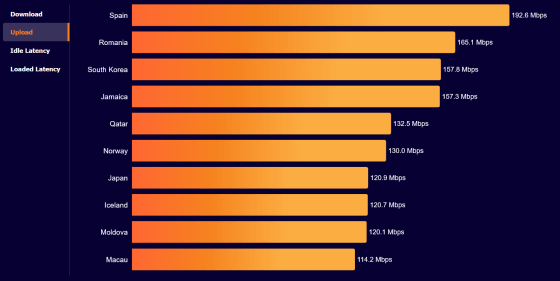
The average download and upload speeds are summarized below. The fastest download speed was in Spain, with an average of 292.6 Mbps.
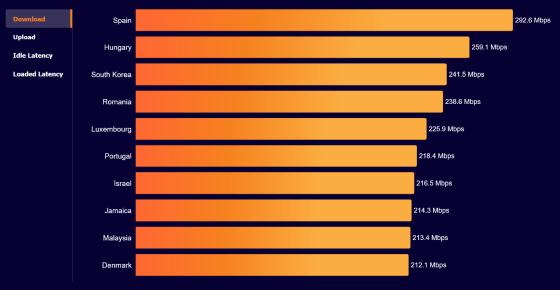
Spain also had the fastest upload speed at 192.6Mbps, while Japan rounded out the top 10 with 120.9Mbps.
Mobile vs. Desktop
Globally, 58.7% of traffic was from desktops, and 41.3% was from mobile devices. In Japan, mobile devices accounted for 47.8%, close to the desktop.

◆ Traffic reduction
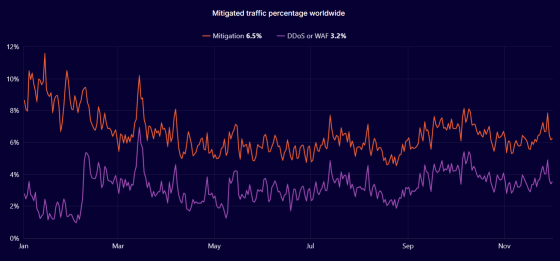
6.5% of global traffic was mitigated by Cloudflare's systems due to 'potentially malicious' or 'customer-defined' reasons, while 3.2% was mitigated by DDoS mitigation and WAF management tools.
◆Bot activity areas
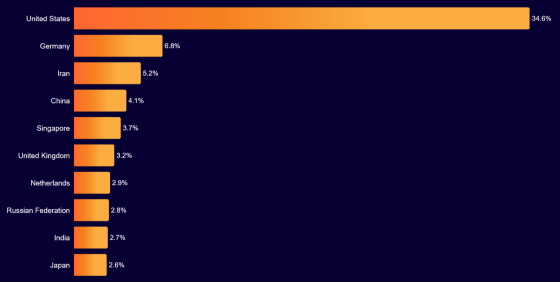
The United States had the most bot traffic, accounting for 34.6% of the total, followed by Japan at 2.6%.
The most attacked industries
Below is a graph showing the percentage of traffic mitigation by industry, calculating the 'most attacked industries.' Gambling/gaming and finance tied for first place with 6.6% each, but other industries were not far behind. Cloudflare said, 'While we can't predict which industries are most likely to be targeted, we know that all industries will be attacked. Regardless of industry, the best thing to do is stay vigilant.'

Related Posts:
in Posted by log1p_kr


