15 graphs showing how much the world has improved by 2018

by NASA
Christmas is over and in a few days it will be over in 2018. In 2018 when various kinds of news which caused public circulation were reported, it seems that there are many good events for people who live on the earth, so what kind of good event happened on the earth together, Quartz shows with 15 graphs.
Ways the world improved in 2018, in charts - Quartz
https://qz.com/1506764/ways-the-world-improved-in-2018-in-charts/
◆ Environmental aspects
According to a report released by the Intergovernmental Panel on Climate Change (IPCC) in October 2018, carbon emissions were estimated to increase more than in the previous year in 2018. In order to avoid climate change that will cause huge damage to humanity, each country is under pressure to reduce greenhouse gas emissions sharply.
Discussion that 'reports on climate change announced by UN agencies are too optimistic' - GIGAZINE

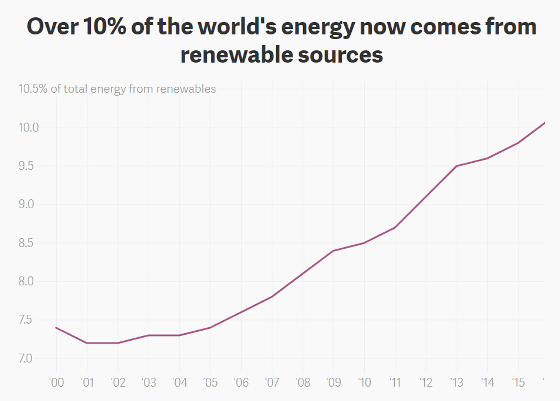
However, the International Energy Agency has announced that renewable energy exceeding 10% of the global energy share for the first time in 2016 has grown to about 25% of the total in 2017. The International Energy Agency forecasts that renewable energy will cover about 30% of the total energy by 2023.
The graph below shows the share of renewable energy in the energy used in the world from 2000 to 2016. It has exceeded 10% for the first time in 2016 and to 23.9% at a stroke in 2017.
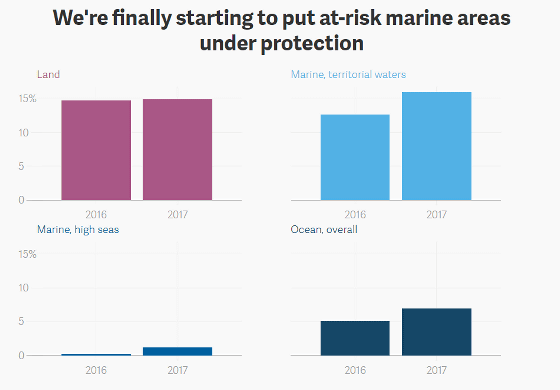
Environmental "good news for the earth" is not just the expansion of the use of renewable energy. From 2016 to 2017, the ocean with a total area of about 6.7 million square kilometers in the world has been added to the subject of environmental protection. It is a proof that marine conservation projects are proceeding in many countries because most are territorial waters of a specific country.
The graph below shows the proportion of land (pink) and sea (others) that are subject to environmental protection. Approximately 15% of the total of "Land" is subject to environmental protection, which does not change significantly from 2016 to 2017. However, it is obvious from the graph on the right that "Marine, territorial waters" that is the subject of environmental protection has increased considerably in one year. The lower left shows the proportion of "Marine, high seas (high seas)" subject to environmental protection, and the lower right shows the proportion of "Ocean, overall (territorial sea + public sea)" subject to environmental protection I will.
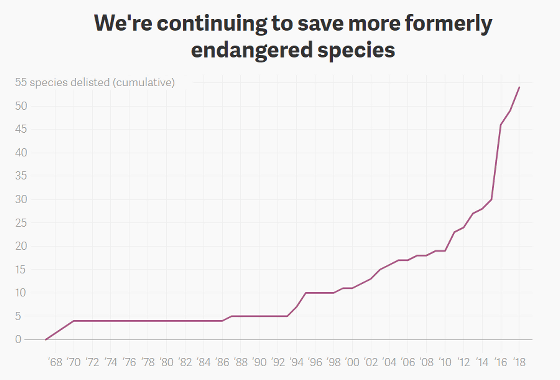
The graph below shows the number of animals removed from the endangered species list by human protection activities so far. Up to around 2000, only 10 species could not be removed from the list, but since 2015 the number of species that are rapidly falling out of the list of threatened species is increasing. Since various factors are involved in the activities of endangerous species preservation by humans, comparing past and present numbers alone does not have much meaning. However, Quartz wrote, "The fact that we can exclude so many species from the list is promising," he says.
◆ Poverty income
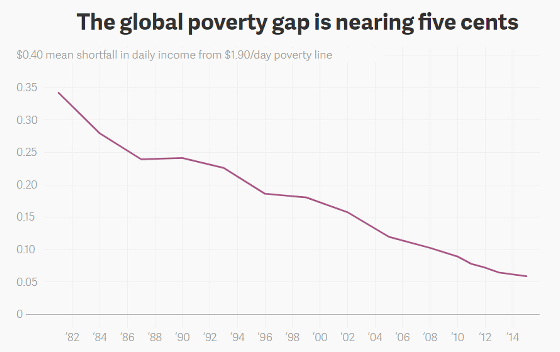
Poverty is one of the big problems that mankind must solve, as it is clear that the poor are going to die earlier by nearly 10 years than the rich . It is very difficult to accurately figure out the world's poverty rate. However, by comparing the difference between the poverty line set by the World Bank, people living on less than 1.90 dollars (about 210 yen) per day, and the amount the average person earns per day, "poverty" It is possible to know whether or not there is a degree.
The graph below shows the amount of shortage by subtracting the average person's earnings per day from the poverty line set by the World Bank of 1.90 dollars. In the 1980s, the average earnings per day is insufficient from the poverty line by about 0.25 to $ 0.35 per day (about 28 to 39 yen) and 91.25 to 127.75 dollars (about 10,000 to 14,000 yen) per year In modern times, however, it is only about 0.05 dollars a day (about 6 yen), about 18.25 dollars a year (about 2000 yen) a year. This clearly shows that poverty is decreasing worldwide.
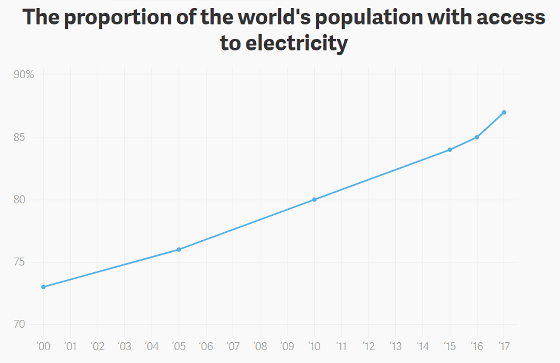
And another point to consider when thinking about poverty is the quality of life. Electricity is indispensable for health, education and satisfaction, but according to new data announced in 2018, the percentage of people who could use electricity in 2017 was 87% how much.
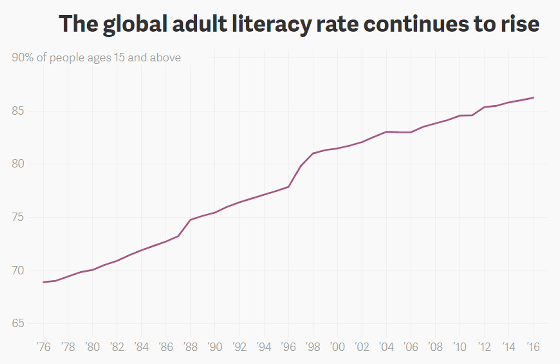
◆ Education - Elements used to calculate the level of "education" that is a major component of happiness and used as an indicator of economic development and quality of life One is literacy rate. The following graph shows the literacy rate over 15 years old. The population of the world over 15 years old is about 5.5 billion people and the literacy rate increase from 2015 to 2016 was 0.23%. This means that from 2015 to 2016, the population over the age of 15 that can read letters rose by about 12 million people.
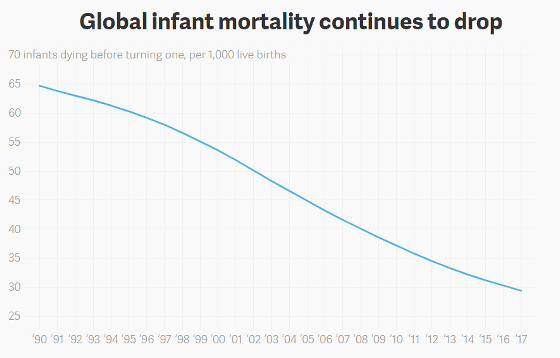
◆ Public Health - Among the improvements that are occurring all over the world, it is something related to public health that is hard to see. Infant mortality rate, maternal mortality rate, childhood developmental disability, teenage pregnancy rate, etc. are important indicators for examining the worldwide public health level. Because all these figures are figures that live people get out by accessing health care professionals, facilities and medicine.
The following graph shows how many infants die when 1000 newborns are born. The mortality rate has continued to decline since 1990, and it reached 30 people in 2017.
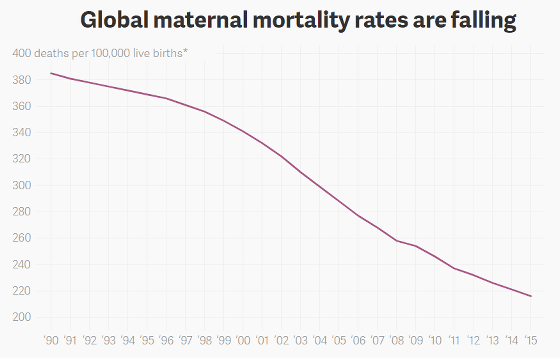
The following graph shows the number of maternal deaths when 100,000 newborn babies were born. From 1990 to 1998, maternal mortality rate slowly declined at a constant pace, but after that the pace was largely paced up, and in 2015 the number of pregnant women who died even if 100,000 newborn babies were born Is less than 220 people.
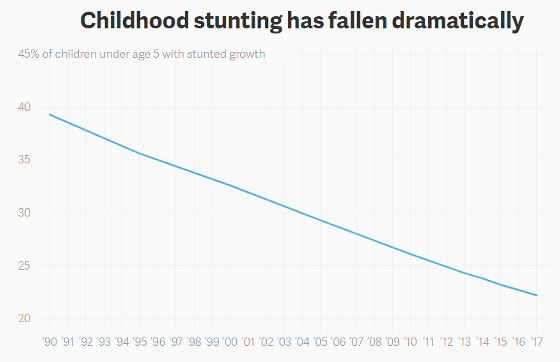
The graph below shows the percentage of children diagnosed with developmental disorder in childhood (5 years and under). The incidence rate declined at about the same pace from the number of about 40% in 1990, and it decreased to 23% or less in 2017.
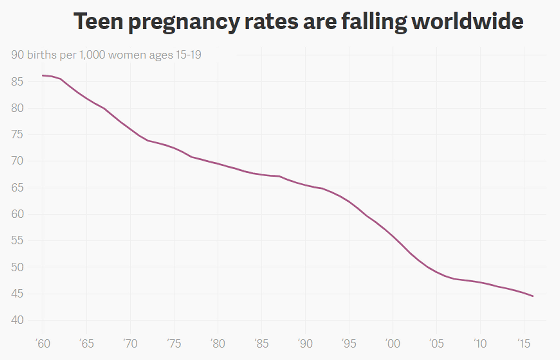
The following graph examined the proportion of girls aged 15 to 19 (teenagers) pregnant. Of the 1,000 teenage girls, the vertical axis shows the number of girls with pregnancy experience. As of 1965, more than 80 girls in 1,000 responded that they had a pregnancy experience, but in 2015 the number has decreased to about 45 people.
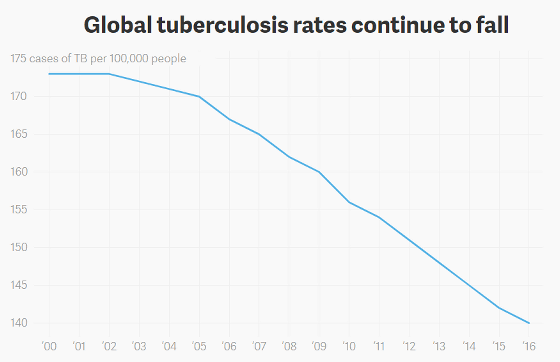
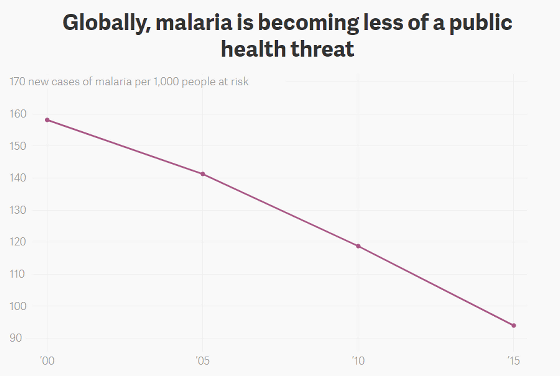
One of the data that can be used as an indicator in public health is data on infectious rate of treatable infectious diseases such as tuberculosis and malaria. Infectious diseases such as tuberculosis and malaria are still a problem in poor areas, but infection rates are still decreasing.
The following graph shows infection rate of tuberculosis. The vertical axis shows how many people were infected with tuberculosis in 100,000 people, the number has remained flat from 2000 to 2002, while by 2016 the number has decreased by more than 30 people.
The following graph shows infection rate of malaria. The vertical axis shows how many people in 1,000 are at risk of infecting malaria and you can see that the risk is decreasing steadily.
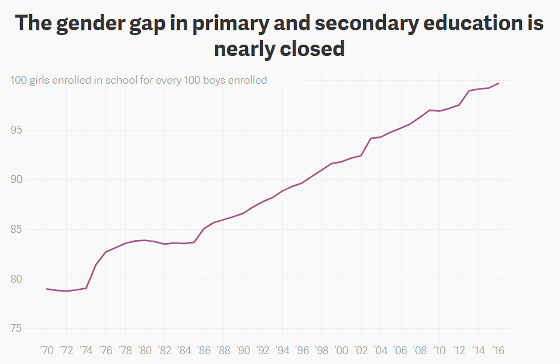
◆ Gender equality and rights to LGBTQ <br> In gender- rich countries in particular, gender disparities in education continue to shrink truly. According to new data announced in 2018, the enrollment rate of men and women at elementary and junior high schools is almost equal in 2016. As of 1986, the number of girls who went to school for 100 boys attending elementary and junior high school was 85.1. Although these indicators seem to improve the numbers little by little every year, it seems that it is a very big change when considering the world population size.
The following graph shows how many girls were enrolled when there were 100 boys enrolled in elementary and junior high school. The number of girls for 100 boys was improved from 99.1 in 2016 to 85.1 in 1986. I can understand well that boys and girls have come to elementary and junior high school with almost the same ratio.
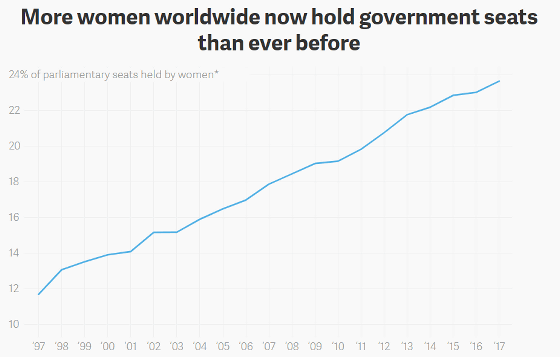
By 2018 American election, at least 121 women will be working as members from 2019. This is equivalent to 23% of all seats, but the percentage of women in seats already exceeds 23% in 2016 in terms of worldwide trends.
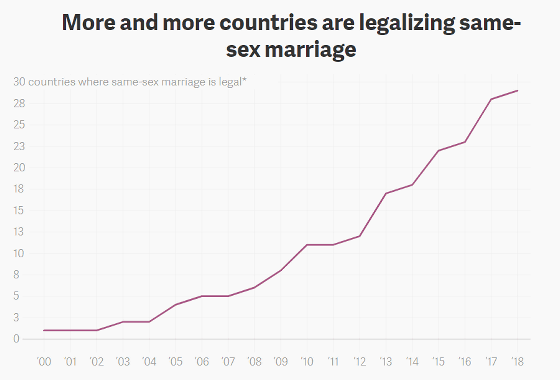
Movement seeking rights not only for gender equality but also for LGBTQ has become active in recent years. Legislation of homosexual marriage is progressing in various countries around the world to boost this, legalization of gay marriage is proceeding in 2018, Costa Rica's Supreme Court ruled that the law prohibiting same-sex marriage is unconstitutional, about 30 gay marriages Accepted.
The graph below shows the number of countries that allow law for gay marriage. It has increased to 27 countries in 2018, which was zero until 2002.
Related Posts:
in Note, Posted by logu_ii


