It is confirmed that it was "the warmest year" in 2015, and the record of 2014 is greatly updated
The average temperature of the whole earth rises Global warming exists as a no-doubt trend, and in November 2015It was discovered that it was worldwide "the warmest November in the past"doing. Meanwhile, NASA and NOAA in the United States, which is advancing research on global warmingAmerican Oceanic and Atmospheric Administration) Officially announced that 2015 was "the warmest past year in the past" and at the same time reveals that the rise from the previous year was so large as to be unprecedented in the past.
It's official: 2015 'smashed' 2014's global temperature record. It was not even close - The Washington Post
https://www.washingtonpost.com/news/energy-environment/wp/2016/01/20/its-official-2015-smashed-2014s-global-temperature-record-it-wasnt-even-close/
2015 Was Hottest Year in Historical Record, Scientists Say - The New York Times
http://www.nytimes.com/2016/01/21/science/earth/2015-hottest-year-global-warming.html?_r=2
2015 was officially the hottest year on record | Ars Technica
http://arstechnica.com/science/2016/01/2015-was-official-the-hottest-year-on-record/
The following movie that NASA created, which expresses the state of accelerating global warming with a movie. It has become possible to confirm the change of the average temperature after 1880 without fail.
Earth's Long-Term Warming Trend, 1880-2015 - YouTube
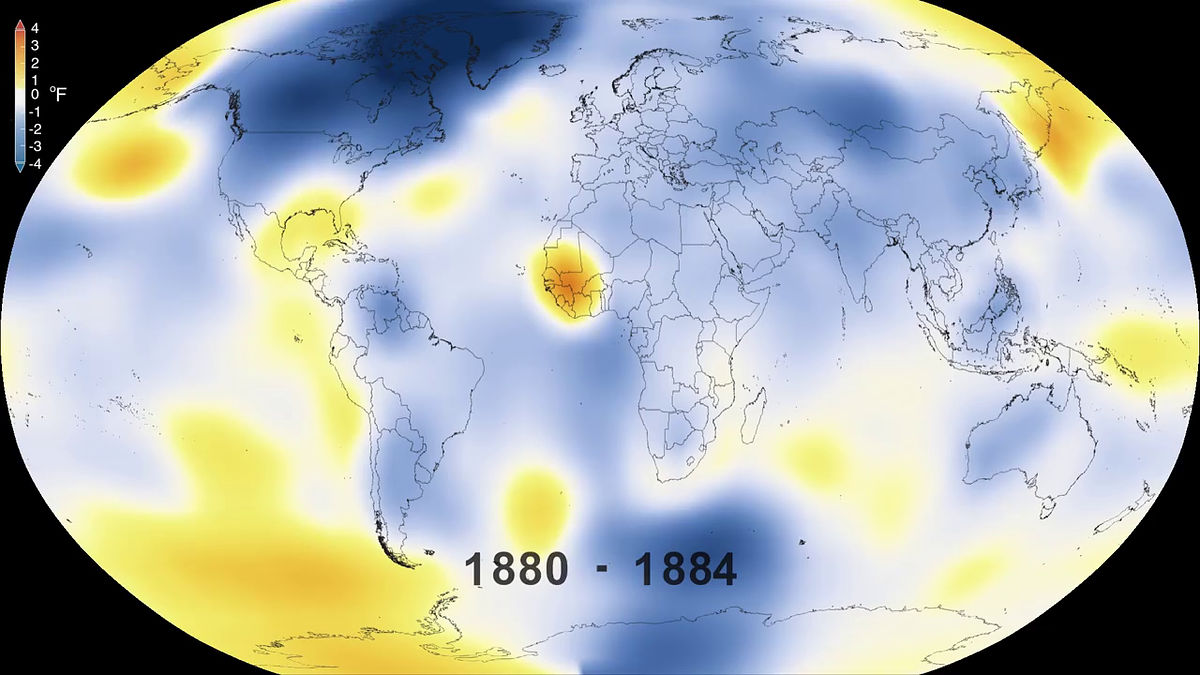
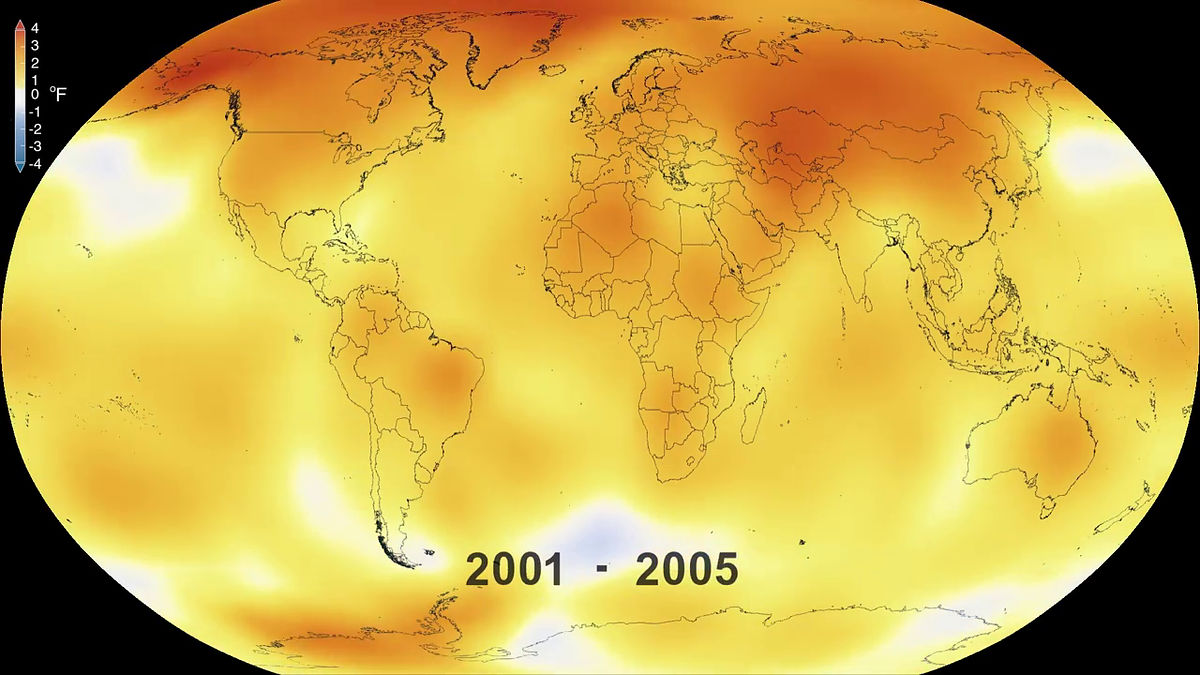
It is like this when representing the average temperature in the five years from 1880 to 1884. Based on the average temperature from 1951 to 1980, the portion with higher temperature is shown in orange color, the portion with lower temperature is shown in blue color, and the temperature around 1880 is lower than the mid-20th century I understand. In addition, the darkest blue part is lower than standard by 4 degrees (about 2.2 degrees celsius).
Immediately after entering the 1900s, the colors on the orange side are lessened, and you can see how the average temperature was falling once.

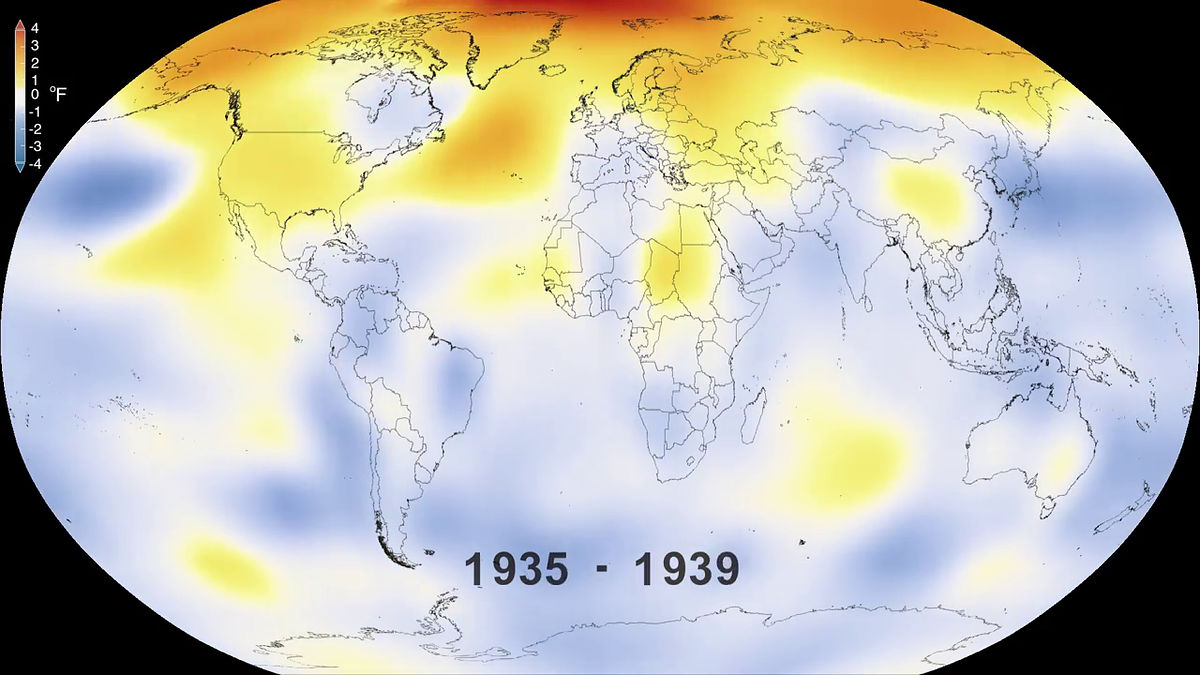
In the 1930s, the temperature in the extreme North turned to rise.
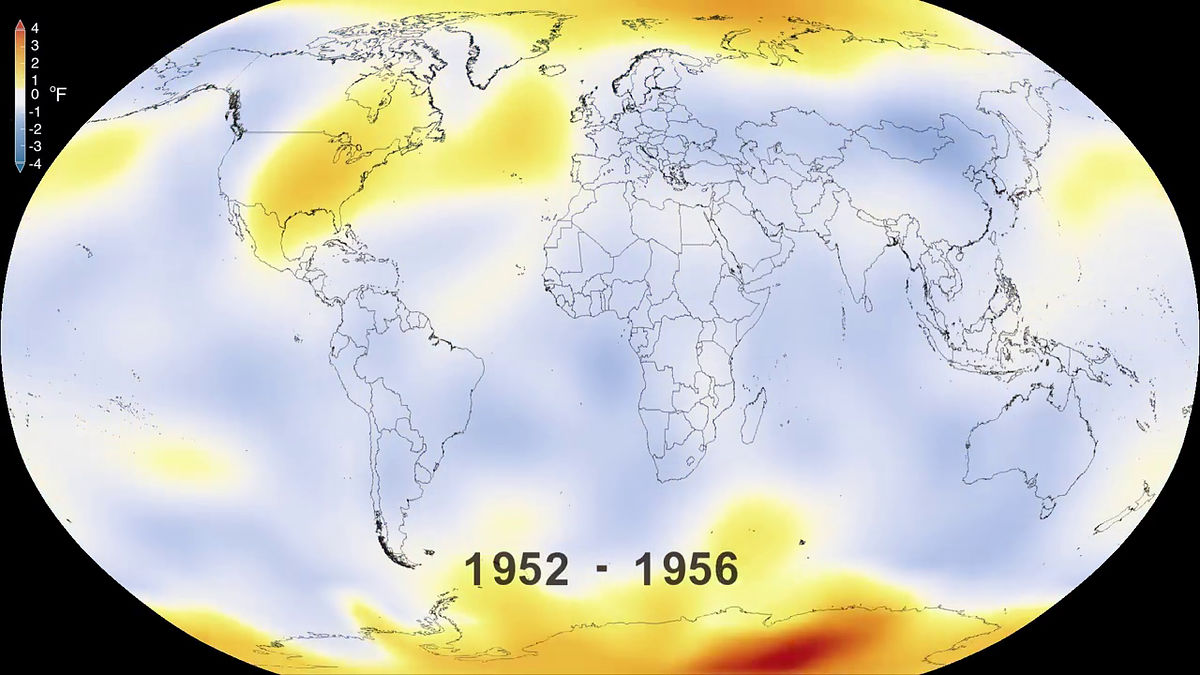
Although the temperature rise has a feeling of showing calmness in the 1950 age group, this should have influenced the fact that it entered the standard period of comparison.
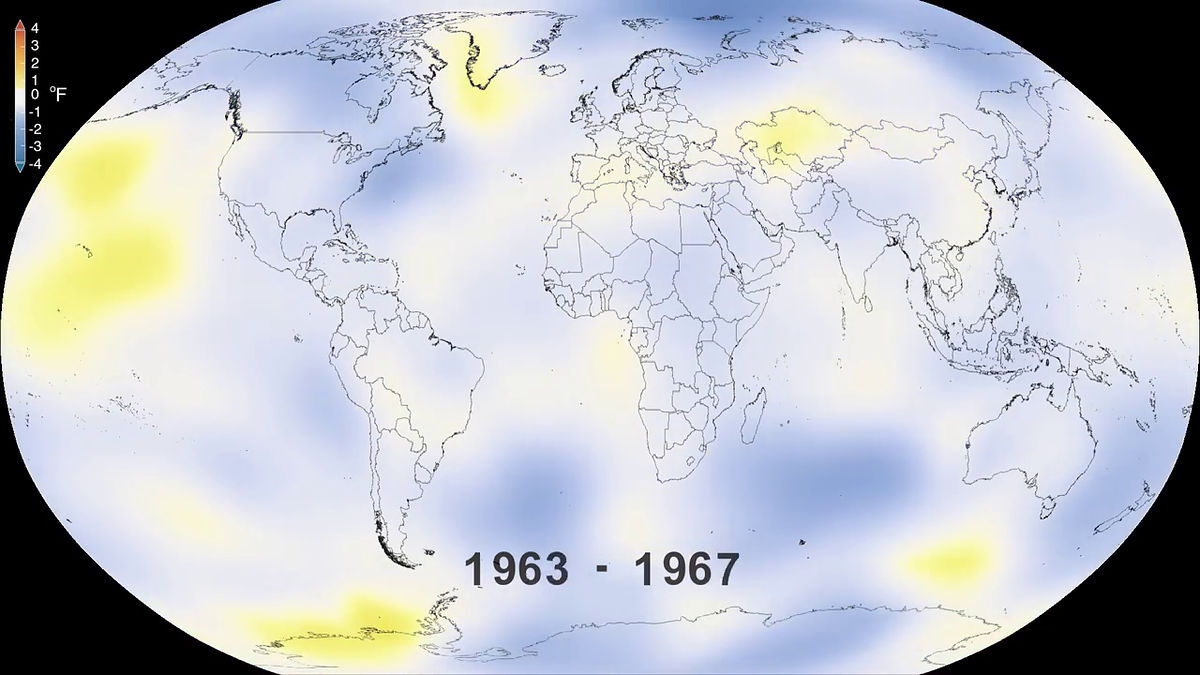
The 1960 age group is also basically "Normal yearA place like ".
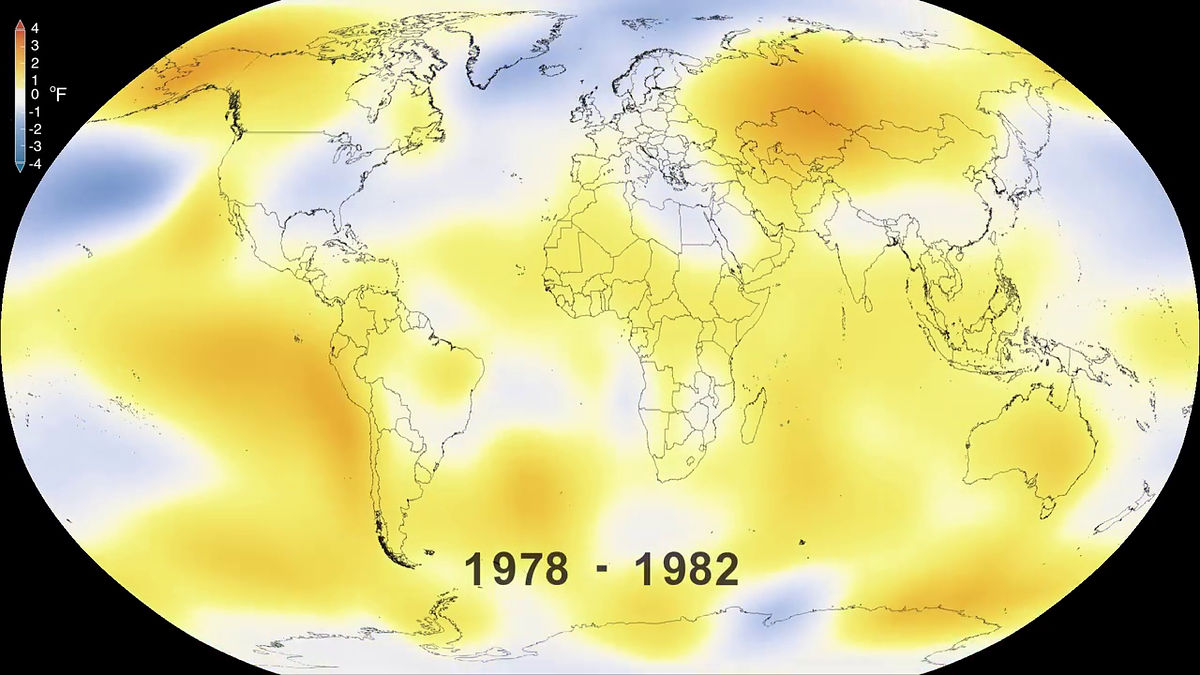
As time passed from 1970 to 1980, the orange color gradually increased ......
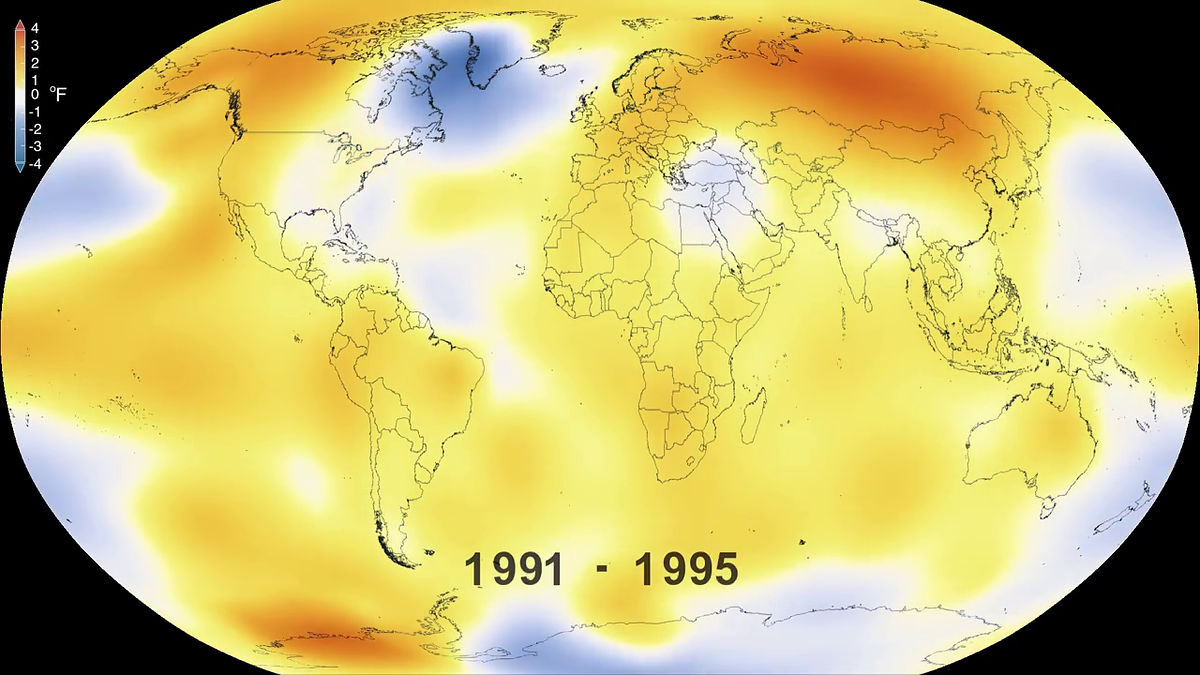
In the 1990 model, most of the land is orange, that is, the region where the average temperature has risen. Note that this statistic is made based on data of observation equipment such as marine buoy in addition to the weather data of each place.
From around the time of the 2000's, orange-colored areas are acceleratingly increasing at a stroke.
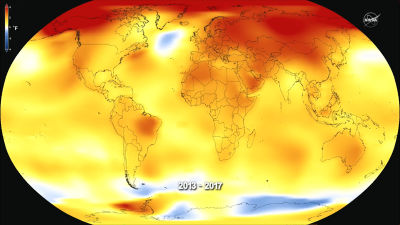
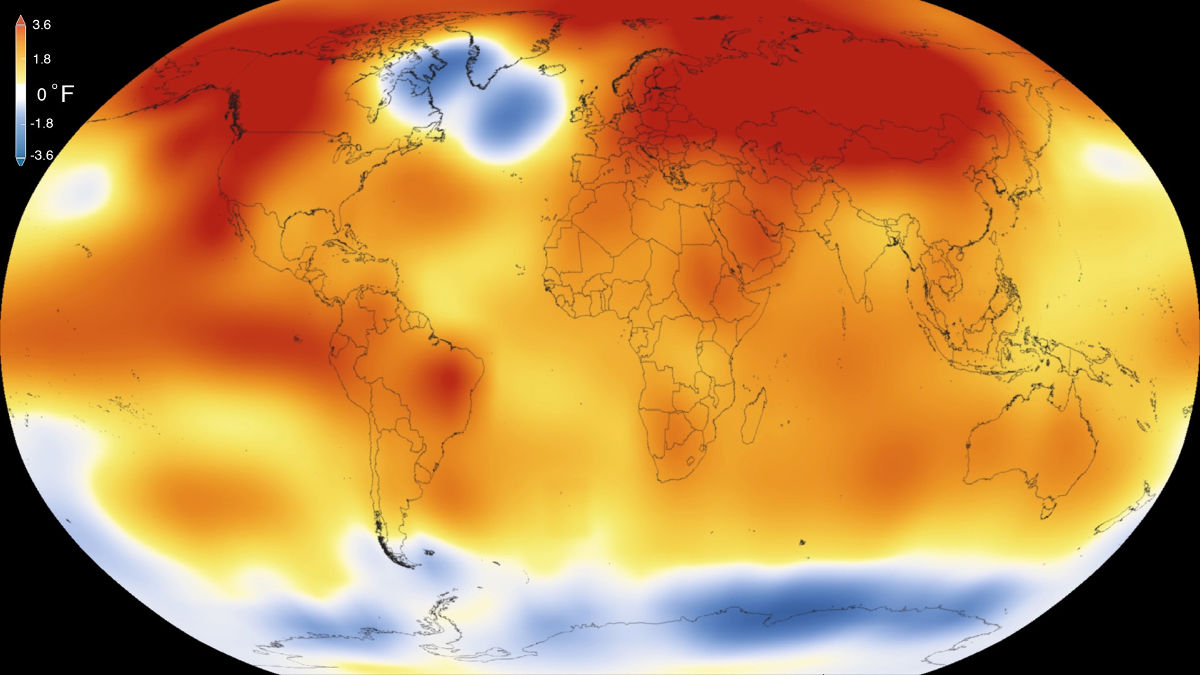
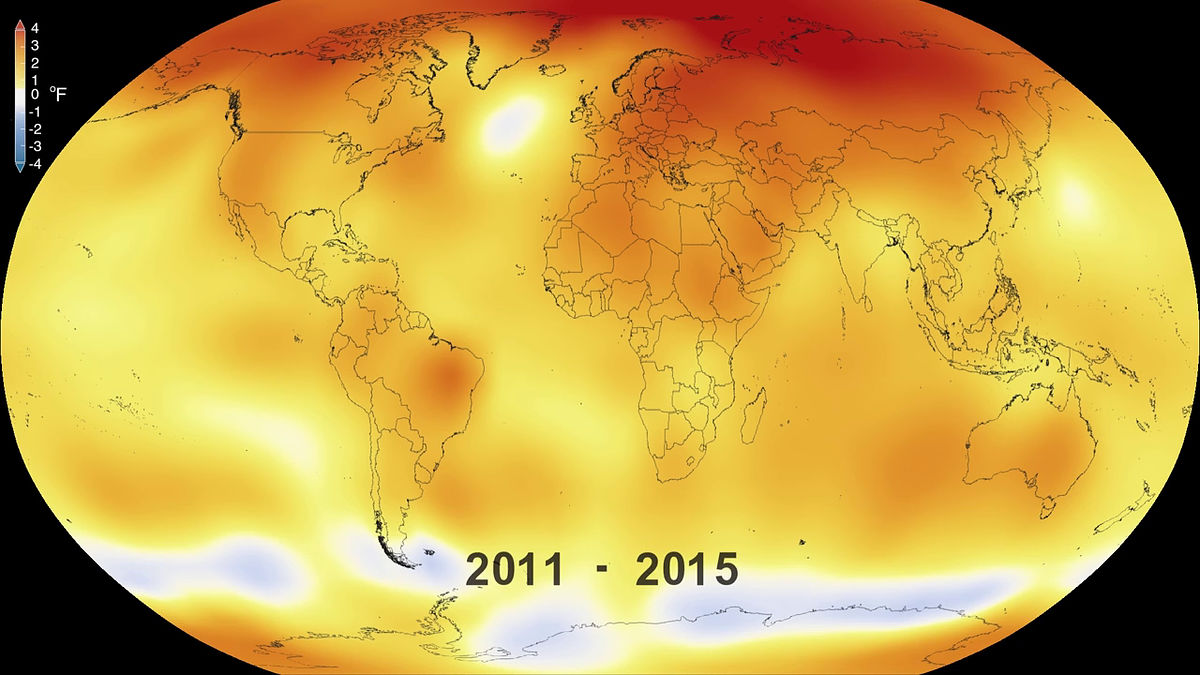
And from the most recent data from 2011 to 2015, the land is almost completely warmed. It is barely a whitish part remaining around the Antarctic and a part of the Atlantic Ocean, offshore of Japan and South America, and it is in the hands that it is entering a place not "the tendency of global warming" As you can see.
This warming is a phenomenon in which the sea surface temperature rises and falls compared to the normal year in a wide sea area over the coast of Peru in South America "El Niño / La Niña phenomenonIt is also well known that there is a close relationship with. The graph below plots La Niña (blue) with low seawater temperature and El Niño (red) with high sea temperature every time, but the seawater temperature apparently rises in units of 10 years from the 1980 level You can see that it is. Moreover, it is also worth noting that the growth of graphs is getting bigger since 2012.

The graph below shows that the rapid growth is well understood. It is a graph of data taken by NOAA and NASA, but as you can see from the up part on the right side, the point written as "2015" is exceptionally bigger than "2014" I understand. The growth rate has reached NASA's data of 0.23 degrees Celsius (0.13 degrees Celsius), and NOAA data reached 0.29 degrees Celsius (0.16 degrees Celsius).
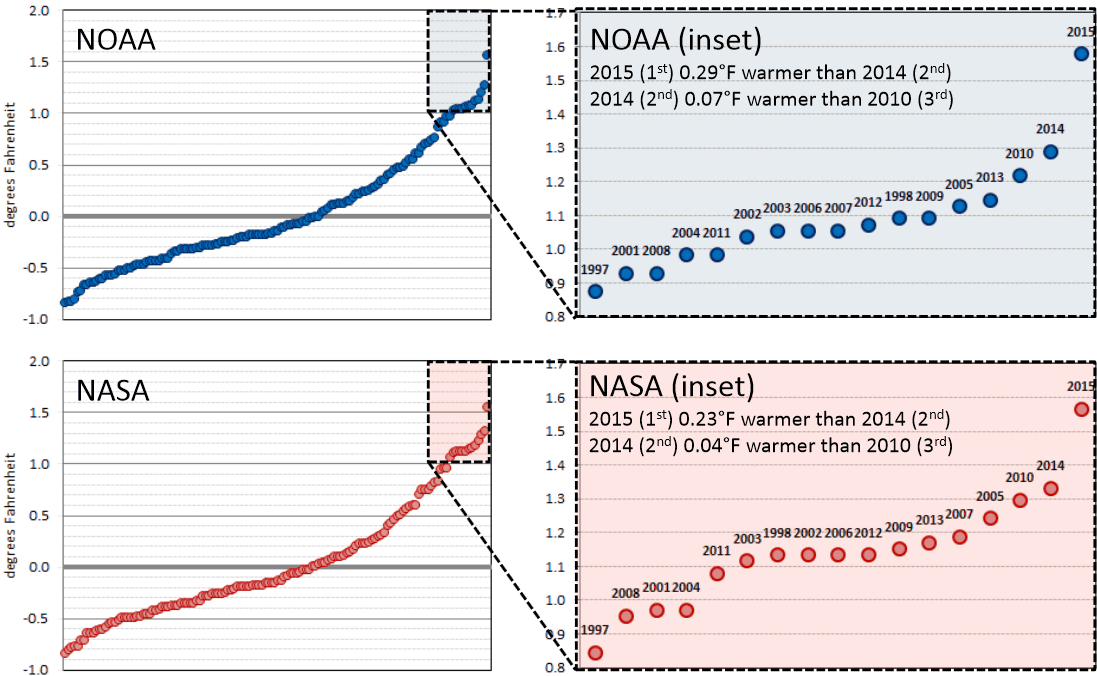
Since the upward and downward movements of about one-hundredth of a degree are common in this year's growth range, you can see whether the degree of increase seen in 2015 was the big one below.
From the statistics, the average global temperature in 2015 compared with the average in the 20th century,Mr. Ka rose 1.62 degrees (0.9 degrees C)It is clear that it is. Also, when compared with the data remaining in the 1800 years, the average temperature isIt rose more than 1 degreeIt is also clear that it is clear.
It is said that various factors are involved in the global warming of the earth, specifying the cause and taking effective countermeasures at the level of several years to decades, the time of 100 years if poor It is also considered to take. It can be said that it is difficult to judge whether this is due to the emission of carbon dioxide or the activation of economic activity, but the average temperature of the earth has continued to rise through the latter half of the 20th century, and It seems to be said that the fact that the rise advanced at a stretch in 2015 should be remembered.
Related Posts: