What is 'three graphs to remember to understand the world' Bill Gates talks about?

Mr. Bill Gates, who is known as the founder of Microsoft, found a website displaying various statistics called Our World in Data during web browsing and learned how the living conditions of the world have changed That's right. He introduces three graphs, as there are things everyone should know about in the graphs he confirmed.
Memorizing these three statistics will help you understand the world | Bill Gates
https://www.gatesnotes.com/Development/Max-Roser-three-facts-everyone-should-know
◆ 1: Since 1960, the number of deaths of children has declined from about 20 million people to about 6 million people per year <br> The graph below shows the transition of the number of deaths of children from 1960 to 2016 The red vertical axis on the left shows the number of deaths per year, the vertical axis on the right shows the number of deaths per minute, and the horizontal axis shows time (year). Looking at the graph, in 1960 more than 20 million people per year, nearly 40 people per minute died. After that, the number of dead will be on a downward trend, falling to 5.6 million people per year in 2016, the number of deaths to 11 people per minute.
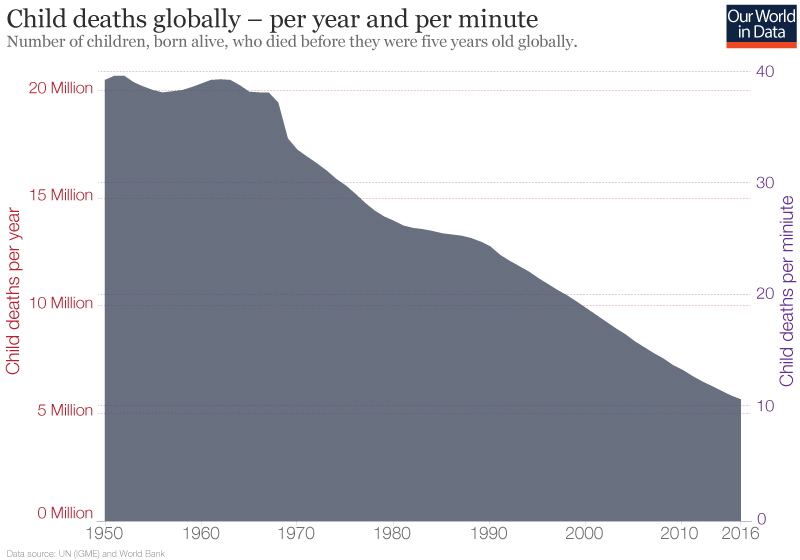
Mr. Gates said, "If you look at this graph, I think there are people who feel the world is changing positively, but if you change viewpoints, now that 11 children are still dead every minute" He points out that he should not ignore the fact that "5.6 million children a year are still dead, although the present is clearly superior to the past."
◆ 2: The birthrate has halved since 1960 <br> The graph below shows a graph showing the number of children giving birth per woman, the vertical axis shows the number of people giving birth, the horizontal axis shows time (Year). The graph shows that women until the late 1960s gave birth to an average of 5 children per person. For this reason, the pace of population growth at that time was very fast, the world population had increased at an average 2% pace. The pace slows down as people's income increases. Today, women get better education, and job opportunities increase. In addition, as a result of medical advances, it became easier to obtain contraceptive medicines, and as a result it became possible to adjust the number of children according to the needs of parents. As a result, in 50 years the number of children per woman has halved, and the population growth rate of the world has settled at just a little more than 1%.
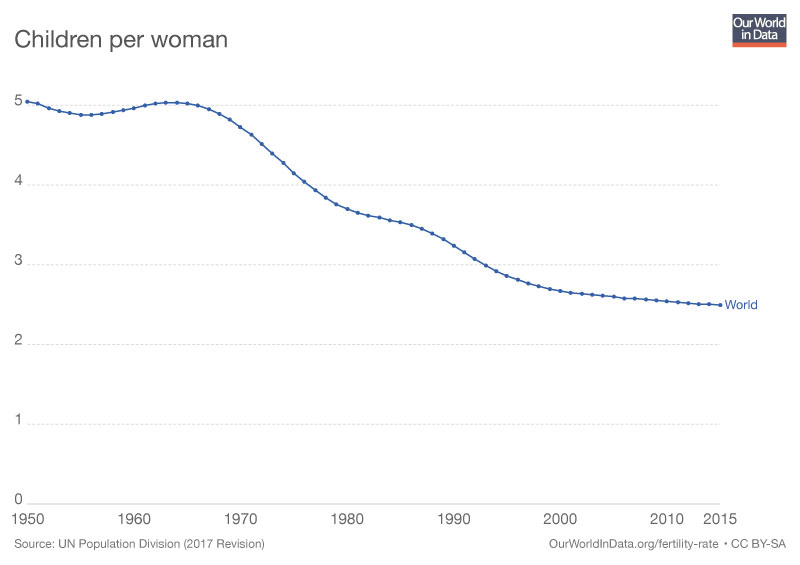
"The fact that the number of births per women has declined to less than 2.5 in 50 years indicates that rapid population growth is approaching the end of this century," said Mr. Gates.
◆ 3: Transition in 1990, 137,000 people escaped from poverty per day <br> <br> The graph below shows the percentage of the poor who earn less than 1.9 dollars (about 210 yen) per day and the population It summarizes the transition. The red part shows poor, the green part shows other than the poor, and the horizontal axis shows time (year). Looking at the graph below, 1.8 billion people were in the poor in 1990, but it decreased to 706 million in 2015 after 25 years. In the past 25 years, 1 It is calculated that 137,000 people are coming out of the poor per day.
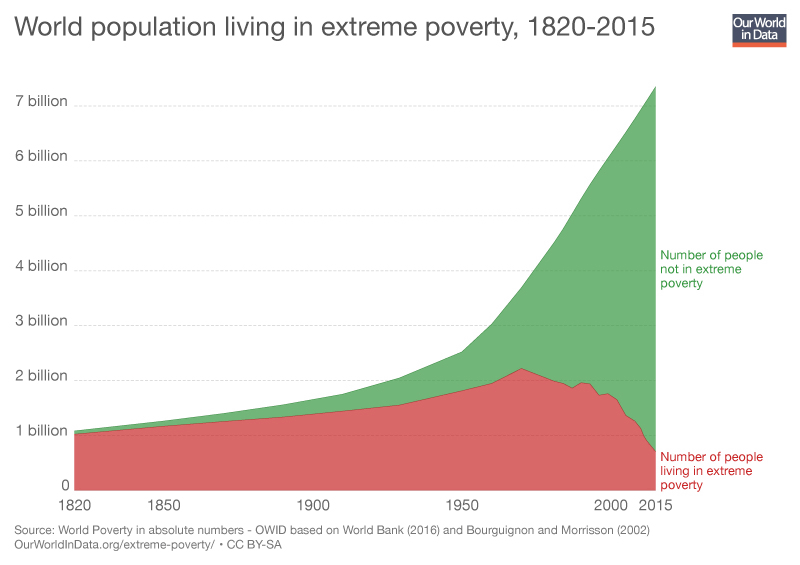
Mr. Gates says, "Although the number of 706 million people is an unacceptable number, it is a good trend that the number of people who escape from the poor is steadily growing" is a good trend, "the income per day is Explaining that the extreme poverty situation of about 210 yen is about to end.
Finally, he considers three things: "the number of deaths of children is decreasing", "population growth does not continue", "the number of people suffering from extreme poverty is decreasing" I will continue in the same direction in the future, "he said, and continuing to work for progress will continue to advance the future in a better direction.
Related Posts:


in Note, Posted by darkhorse_log