I tried using "Google data studio" which makes it easy to create a report

There are various tools to display various data in graphs and tables in an easy-to-understand manner, but one of them is "Google data studio"is. I took advantage of the service that Google made and tried cooperation with Google Analytics actually because it is easy to collaborate with the same Google products such as Google Analytics and AdWords.
Data Studio (Beta) | Data visualization and report creation | Try free version - Google
https://www.google.com/analytics/data-studio/
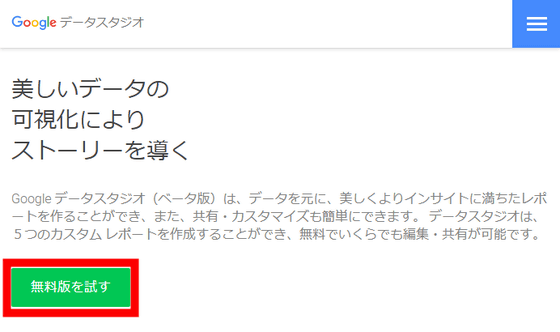
First of allGoogle data studioGo to the page of "Try the free version".
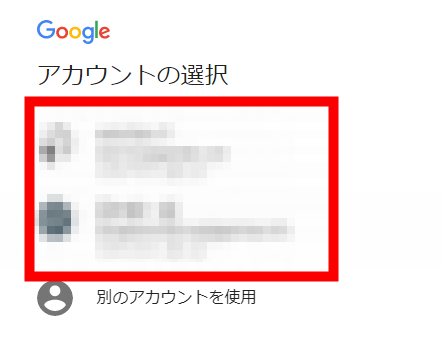
Log in to Google. Click on the account you want to login ......
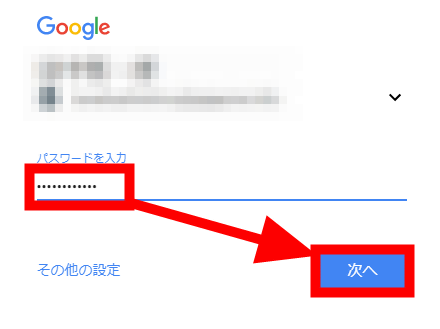
Enter the password and click "Next".
You can now use Google Data Studio. You can create a report from scratch by clicking "blank", but this time I decided to use the template. Click the template labeled "Acme Marketing".
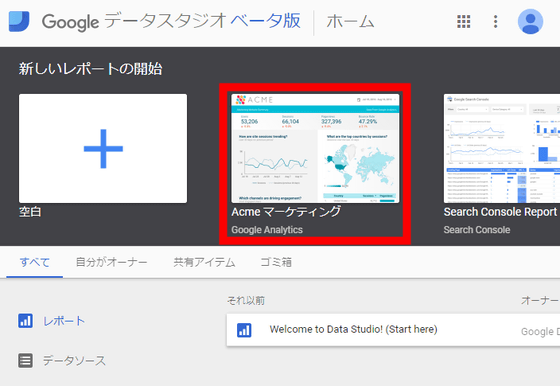
Click on the pull-down menu labeled "default data" at the top left of the template ... ...
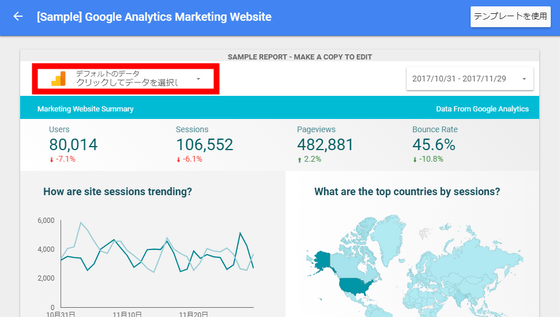
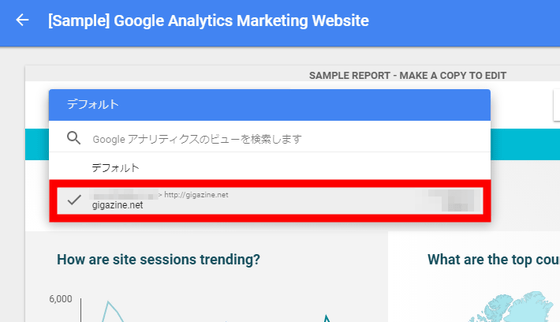
Click the data you want to use for report creation.
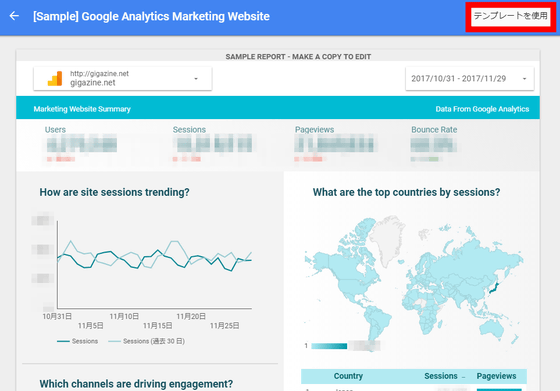
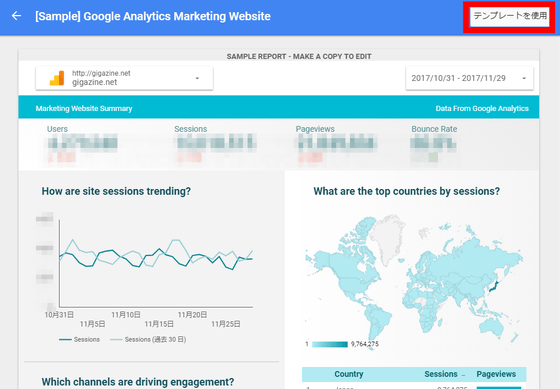
A preview using the selected data will be displayed. Since I want to use this template, click "Use template" in the upper right.
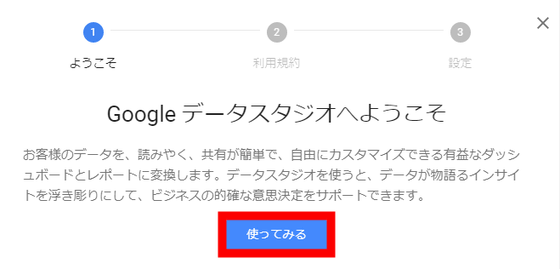
Since "Welcome to Google Data Studio" is displayed, click "Try to use".
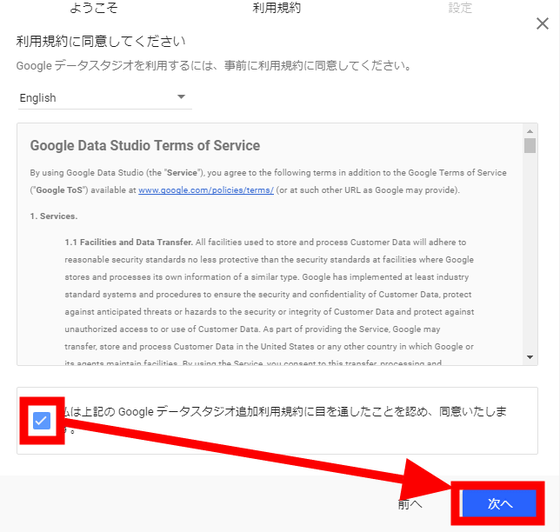
Please read the terms of service, click the checkbox below to check it and click "Next".
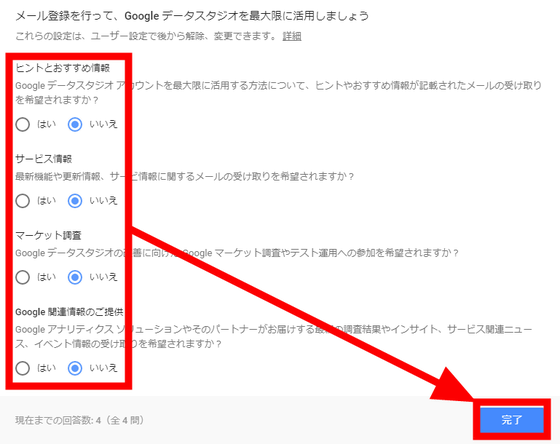
When answering some questions such as "Do you want mail delivery?" Click "Finish".
Since I came back to the original preview page, click "Use template" again.
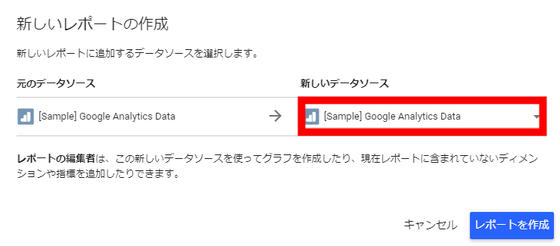
Enter the data to use for the report. Click the "New data source" pull-down menu.
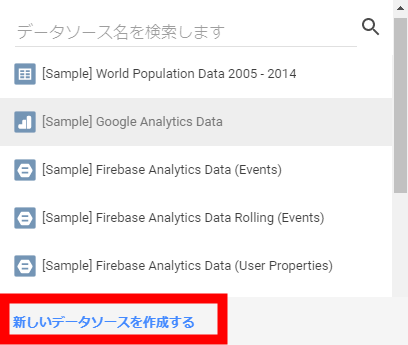
When the pull-down menu opens, click "Create a new data source" at the bottom.
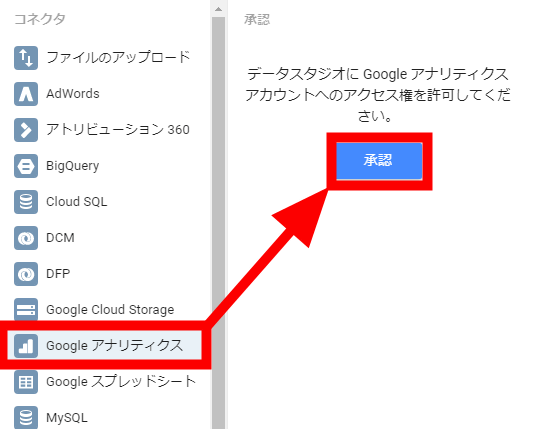
If you select "Google Analytics" from the "Connector" column on the left side, you will be prompted for access, so click "Approve" on the right.
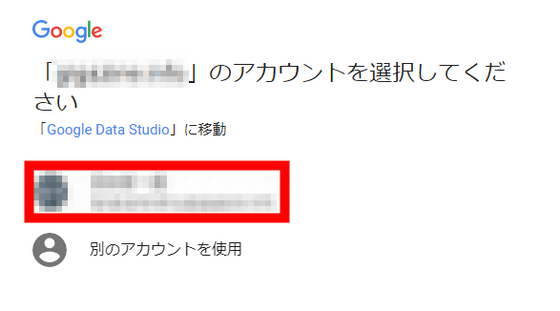
Select and click on an account that has access to 'Google Analytics' data.
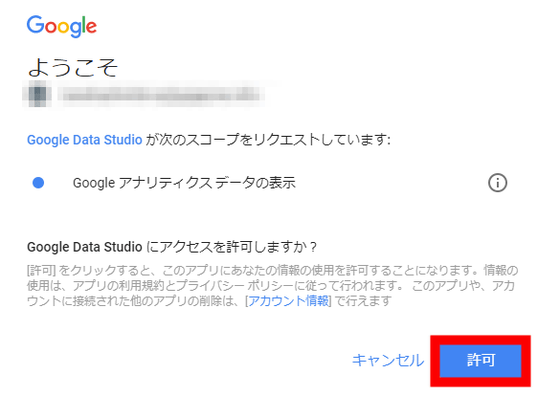
As Google Data Studio asks for access to Google Analytics, click "Allow".
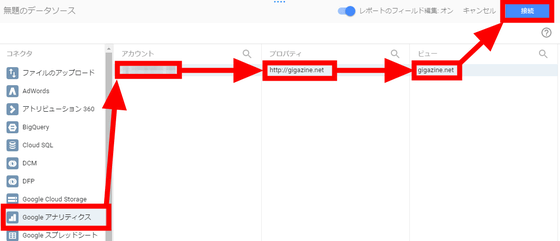
Select "Account", "Property" "View" and Google Analytics data and click the "Connect" button in the upper right.
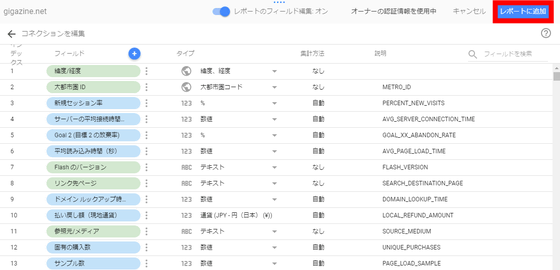
Leave the details as it is and click "Add to Report" in the upper right.
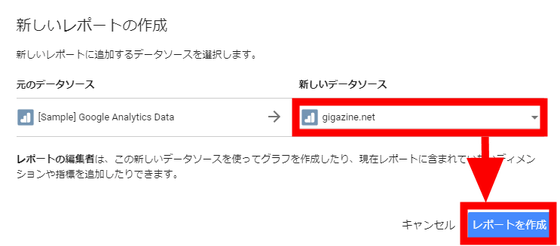
Make sure that the data of the Google Analytics you want to use for "New Data Source" is entered and click "Create Report".
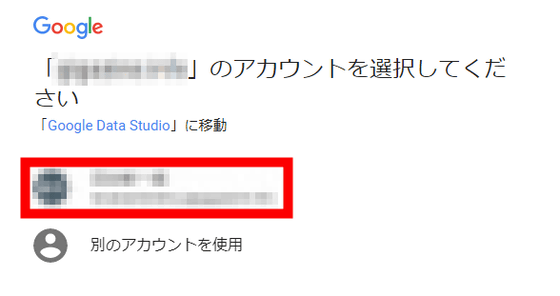
Again, a screen saying "Please select an account" has appeared. Click the account you want to use.
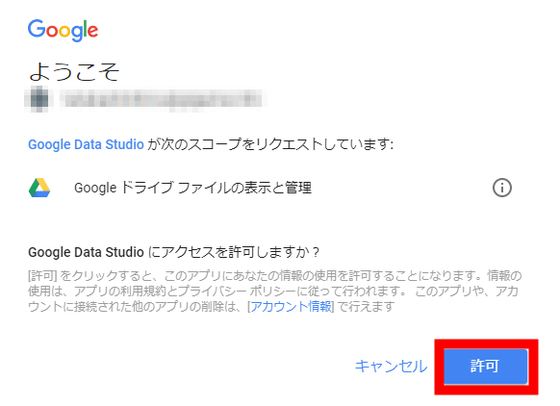
As Google Data Studio asks for access to Google Drive, click "Allow".
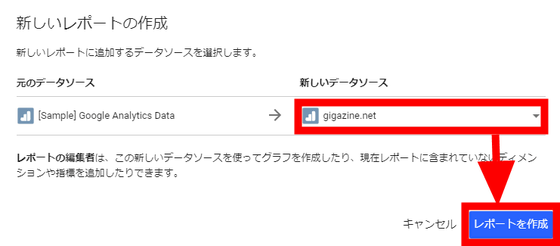
I will return to the "Create New Report" screen and click "Create Report" again.
A copy of the template has been created and can be edited freely.
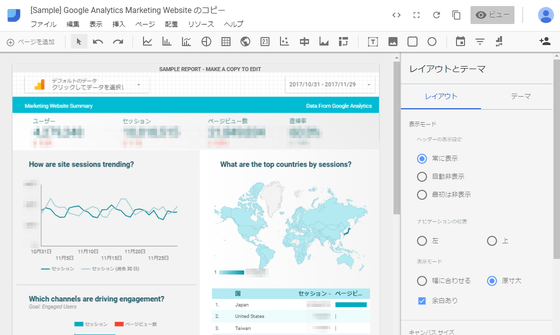
I will actually edit it. I felt that the map showing the access source in the lower right is unnecessary, so click to select it and then press the "Delete" key to delete it.
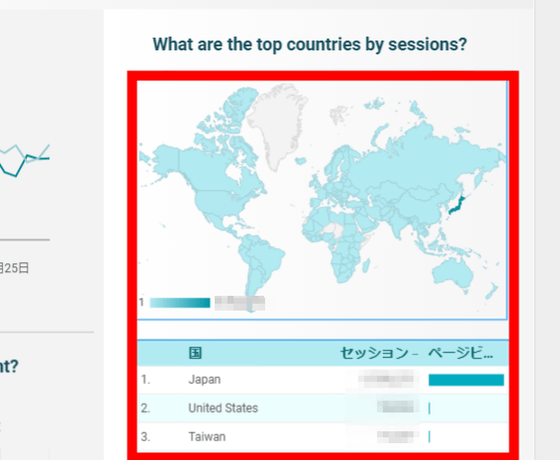
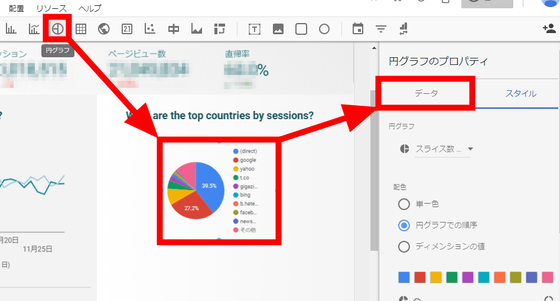
Instead of inserting a pie chart. Click "Pie Chart" from the menu above and click again at the place you want to install, a pie chart will appear. Click "Data" on the right side to select the data to display on the pie chart.
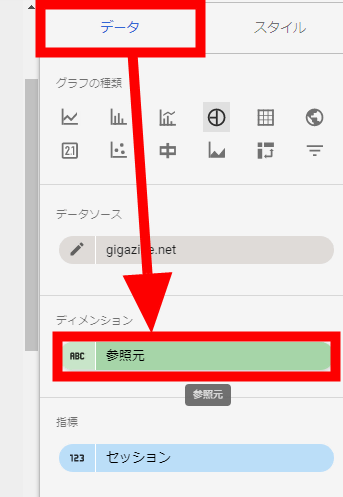
Click "Reference source" in "Dimension" column on "Data" tab.
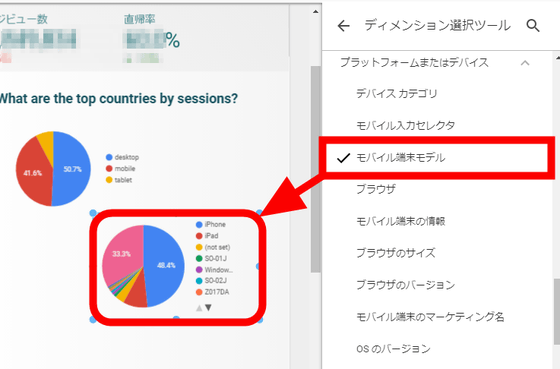
Since there are various data obtained from Google Analytics, click on the data you want to use. For example, if you select "Device category", the pie chart now shows three of "desktop" "mobile" "tablet".
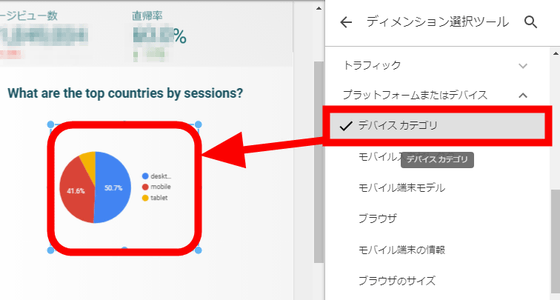
Add another pie chart and select "Mobile Terminal Model" this time, a pie chart showing what kind of devices are being accessed, such as "iPhone" and "iPad", was displayed.
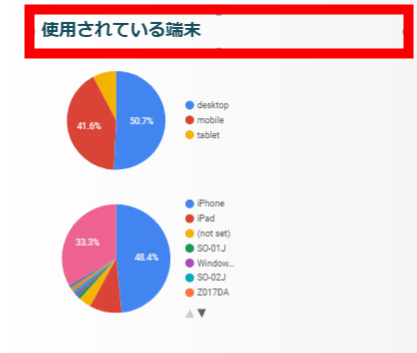
Change the heading to match the graph as "terminal being used". In this way, you can create a report soon.
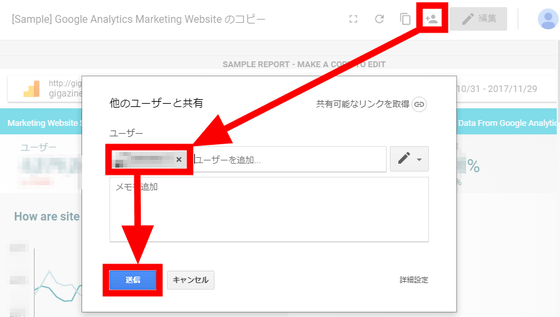
Multiple users can also edit by adding a user from the share mark.
Also, since it is always updated to the latest data of Google Analytics, it was able to keep using the report once created, and it was a tool that drastically reduces the time required for report creation. There is no export setting such as printing, the data is automatically updated The page of "Google Data Studio" is itself a report.
Related Posts:
in Review, Web Application, Posted by log1d_ts
