Service for surfing that can check the weather, wind speed, wind direction as well as the flow of seawater "Windria"
Weather forecast service for sailors and surfers is "Windria"is. We are able to visually confirm the height and flow of waves which can not be seen with the normal weather forecast service, so that we can see the data of the day as well as the data until the 4th day can be seen as an extraordinary service It is becoming.
Windria - Wind forecasts, tides & weather radar worldwide
https://windria.net/
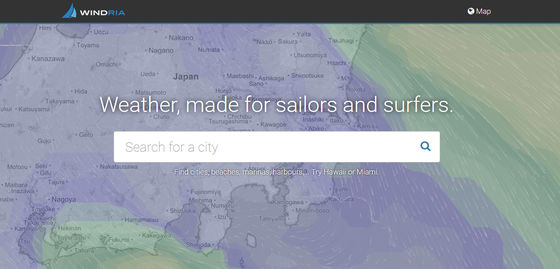
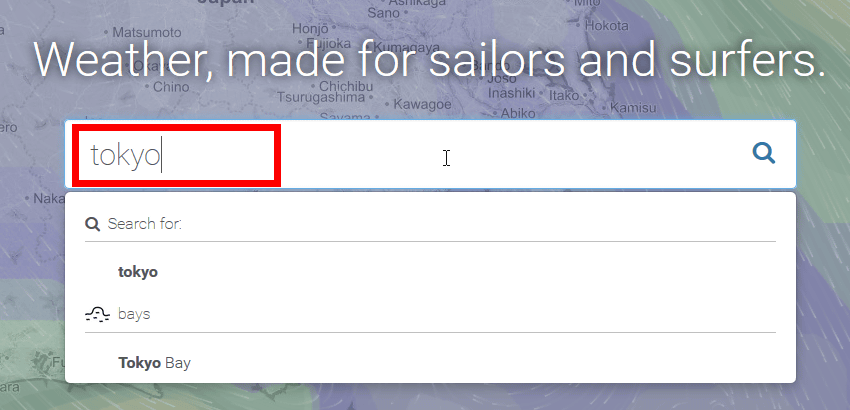
It's easy to use, simply enter the point you want to display weather information in the text box on the top page.
Graph that forecast changes in wind speed / wind direction for several days
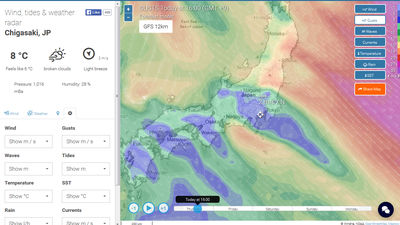
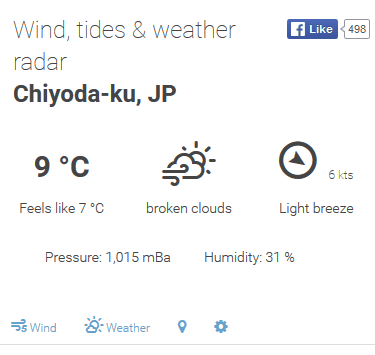
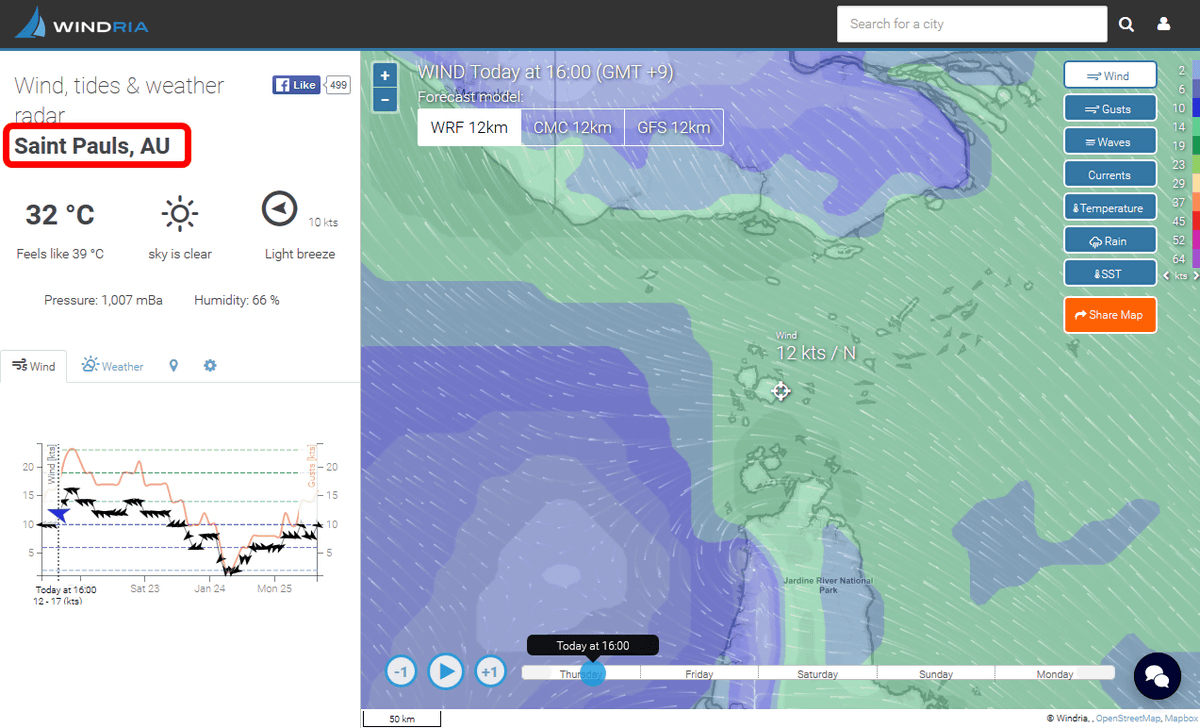
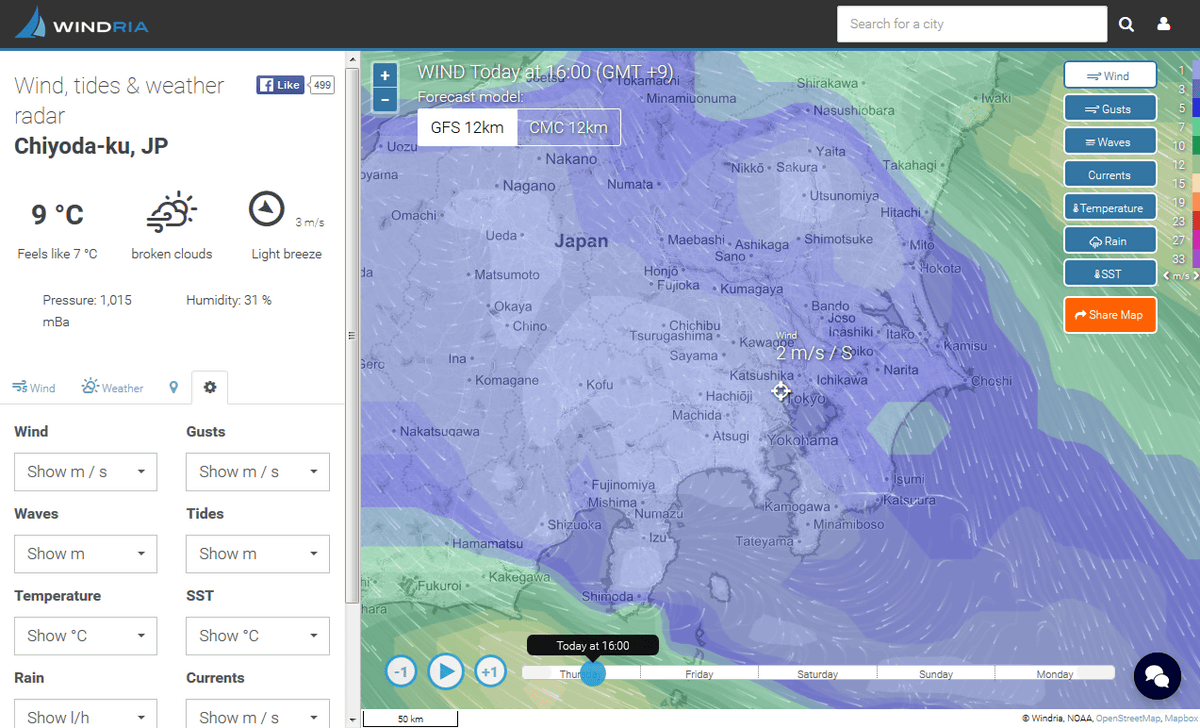
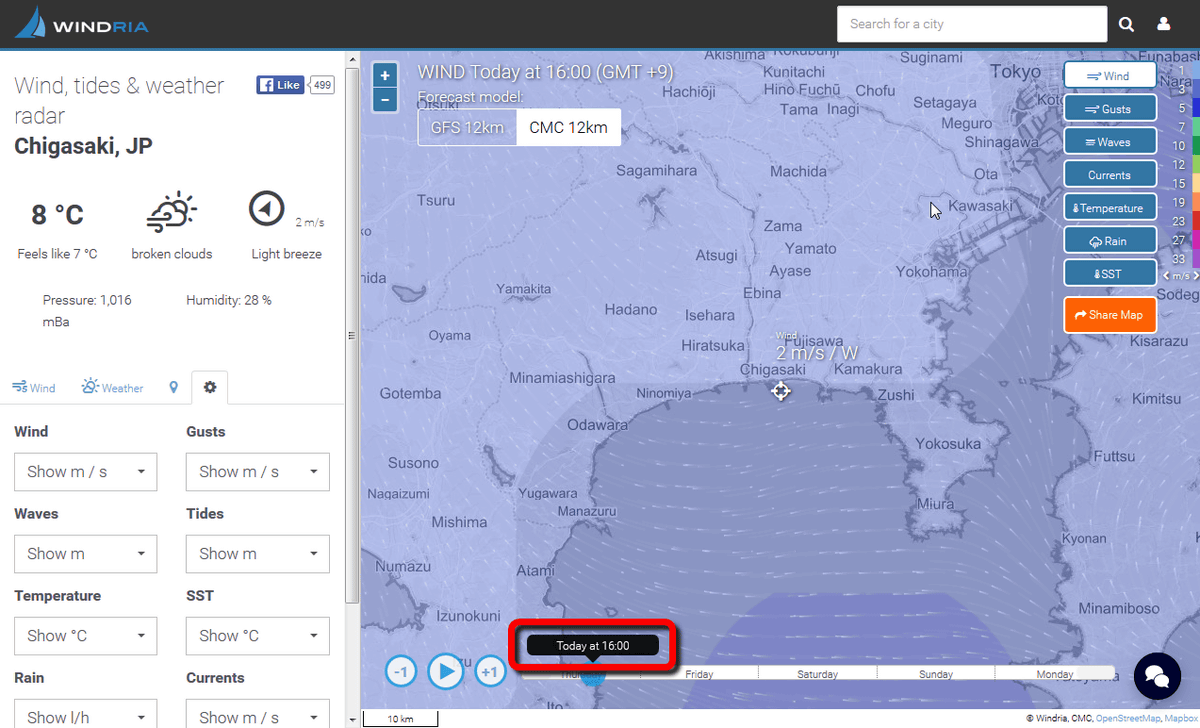
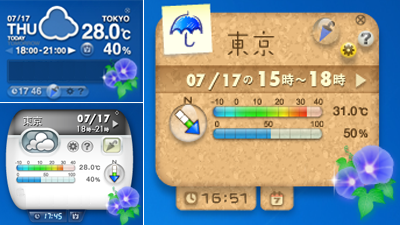
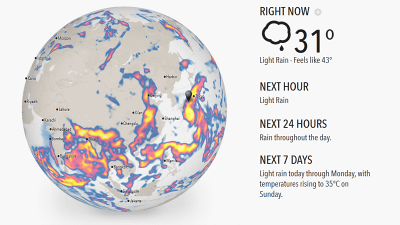
Then you will see a map on the right side of the screen like this and detailed information on the left side.
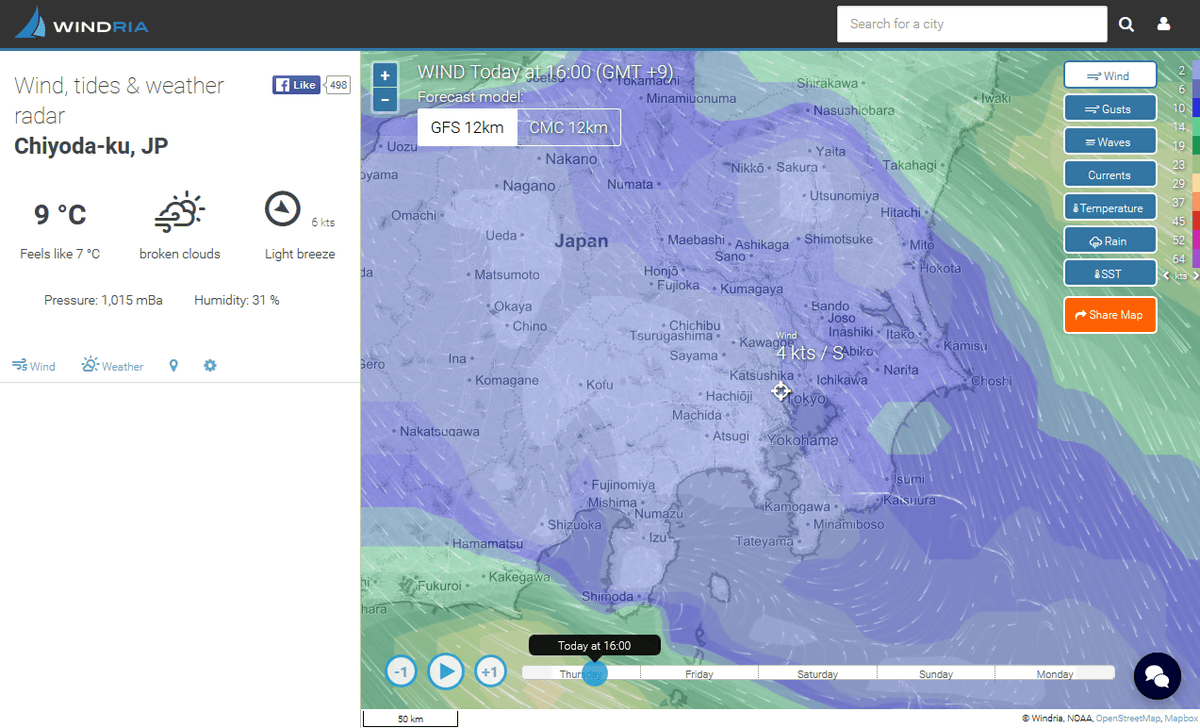
What is displayed on the left of the screen are the location name, temperature (℃), sensible temperature, weather, wind direction, wind speed (kts), atmospheric pressure (pressure), humidity (Humidity).
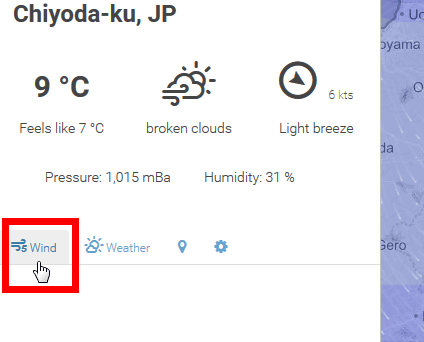
Click "Wind" below that ... ...
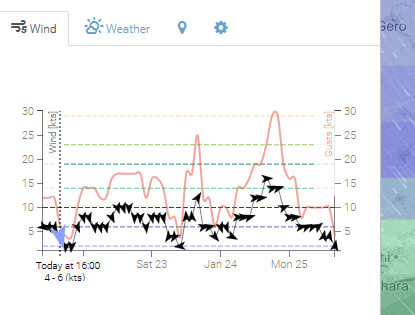
Graph showing appearance of wind speed (black line) · wind direction (direction of arrow icon) · maximum wind speed (red line) every 2 hours appears. Since the information for 4 days is displayed on the graph, the day when the wind becomes strongest at the latest is obvious at a glance.
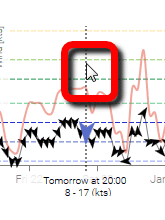
It is convenient because the time and wind speed are displayed as numbers when mouseover is done.
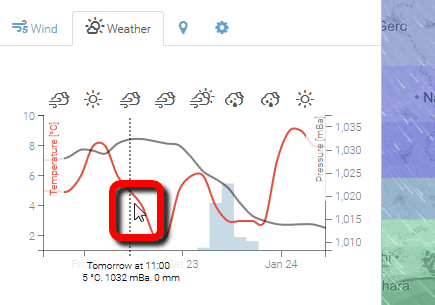
When we click "Weather", weather (icon at the top of the graph) · temperature (red line) · atmospheric pressure (black wire) information is displayed.
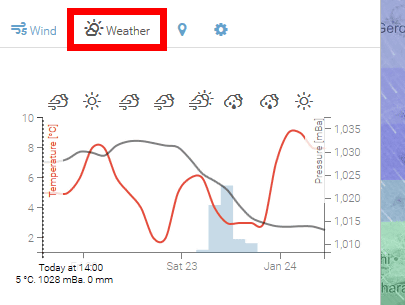
Here too you can check the numerical value per hour with the mouse over.
When clicking the red frame part icon, the place name is displayed, so click on one of them.
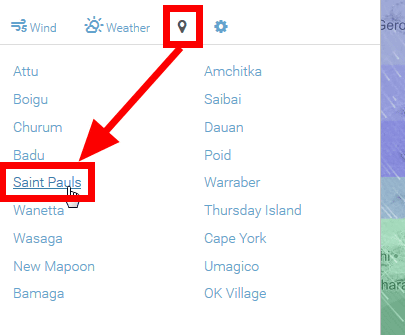
Then weather information of popular spots such as surfing can be displayed quickly.
Then click the gear icon to change the unit of various numerical values. Language setting is also possible here, but Japanese does not currently support it.
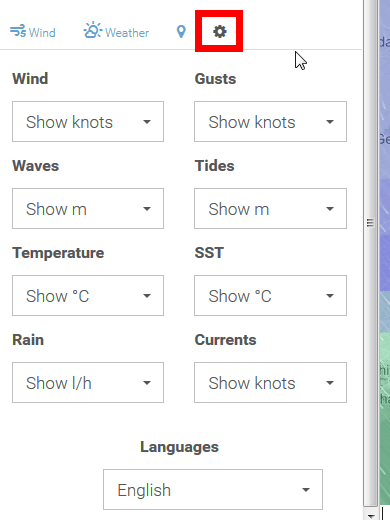
For example, if it is wind speed, it can be switched with 3 types of speed, knot and board feet.

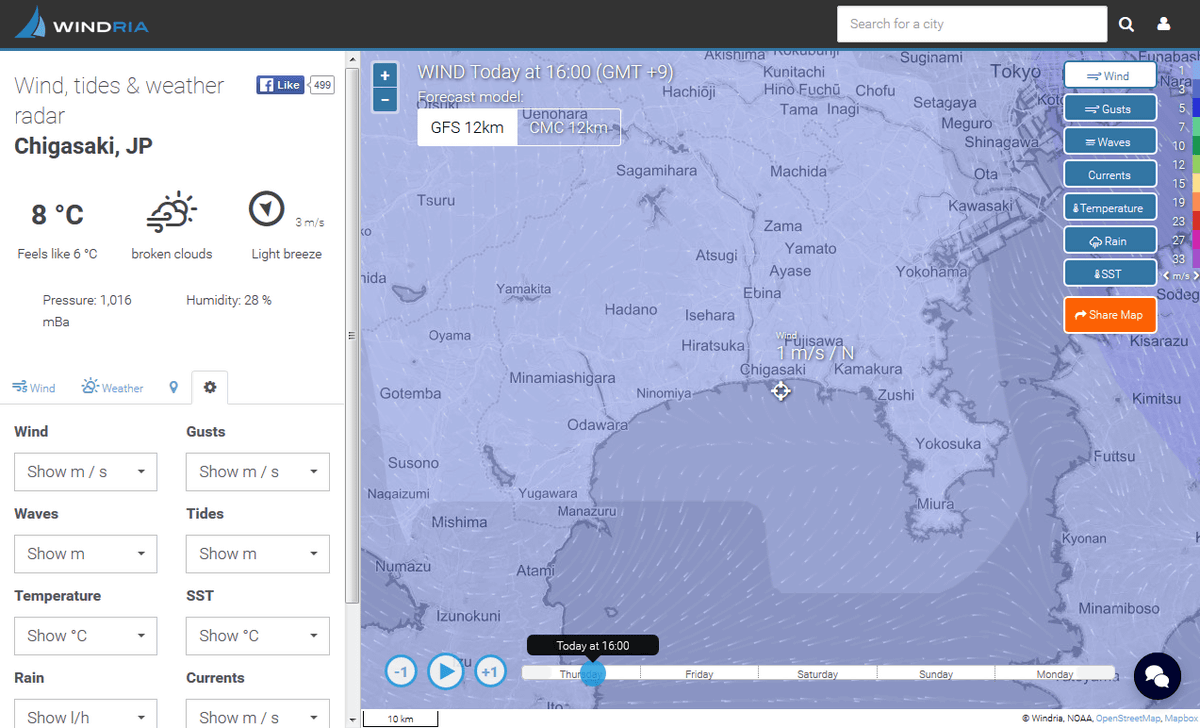
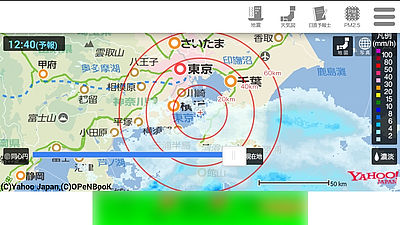
Next, I will look at the map part displayed on the right side of the screen.
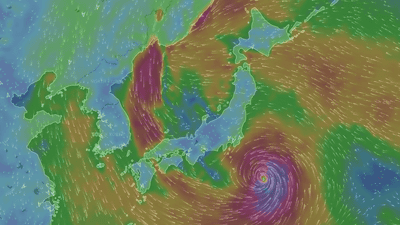
The map is moving little by little as follows and shows the flow of the wind and the tide in an easy to understand manner.

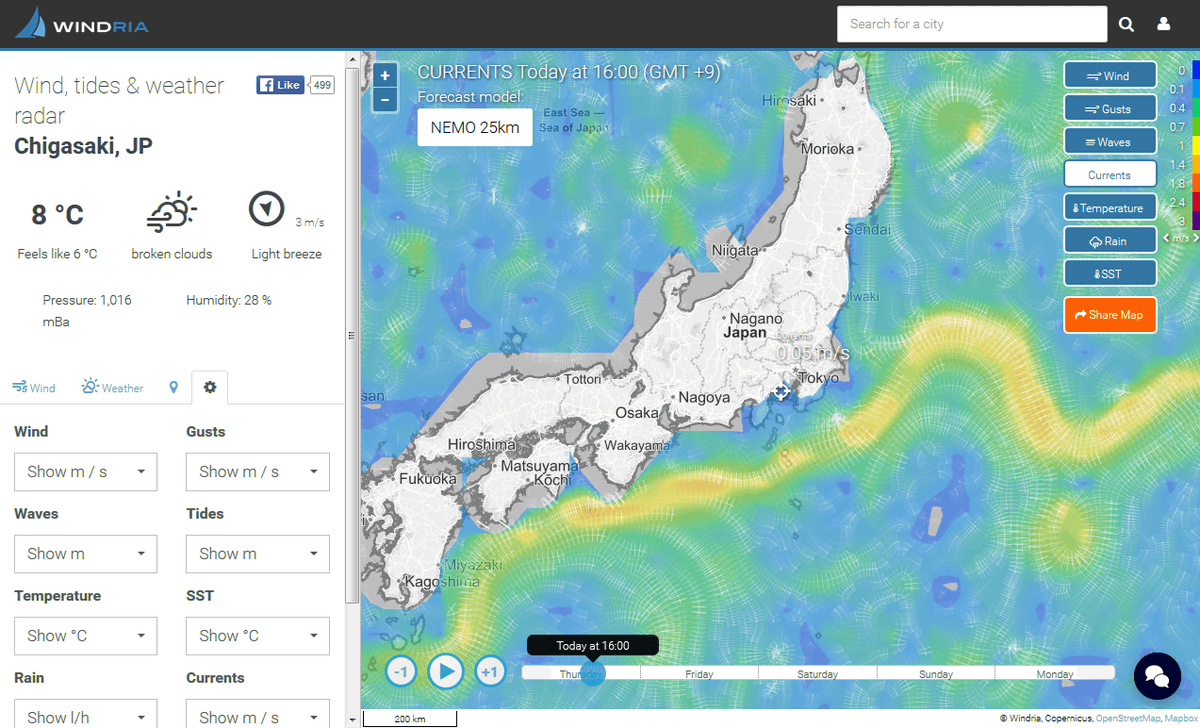
The information displayed on the map can be changed from the upper right of the map. In the initial state, "Wind (wind speed)" is selected.

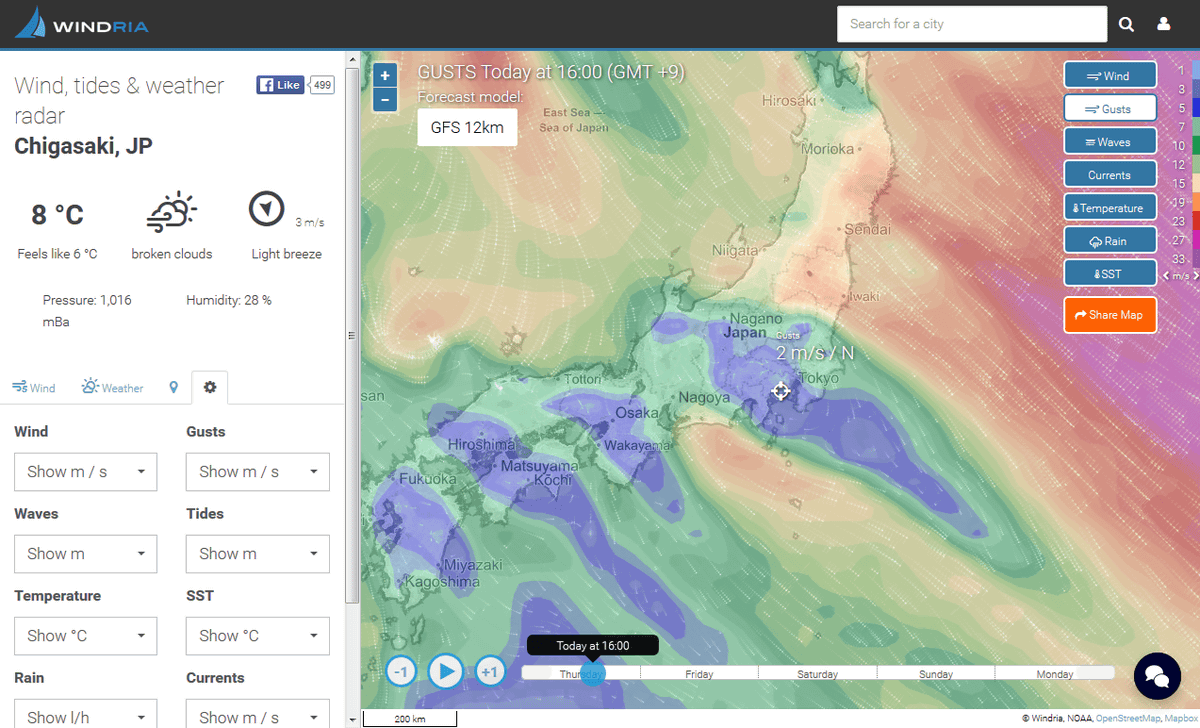
In addition to the wind speed, the following six can be displayed.
"Gusts (maximum wind speed)"
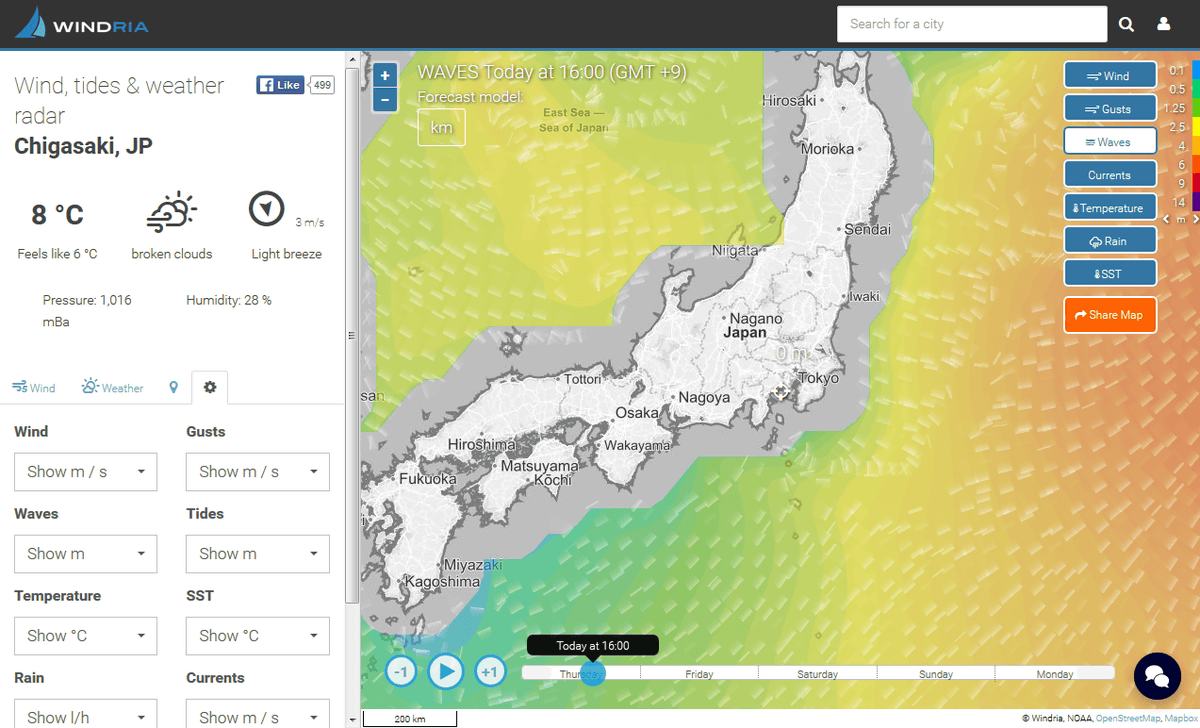
"Waves"
"Currents"
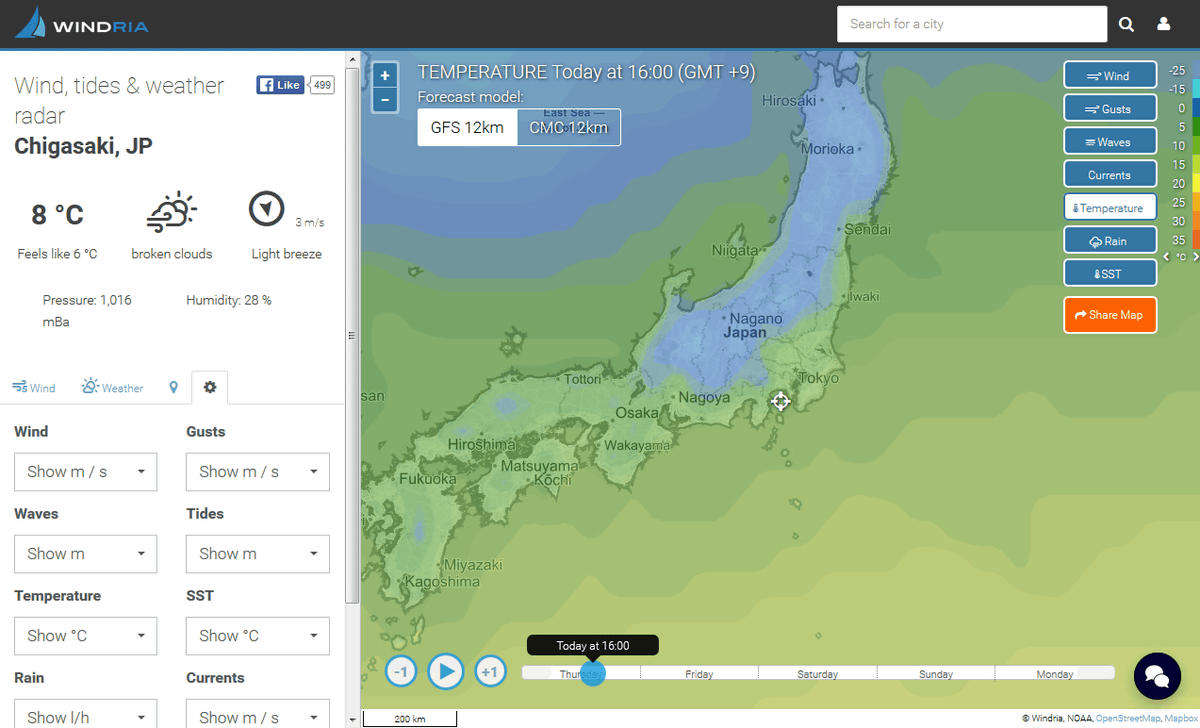
"Temperature"
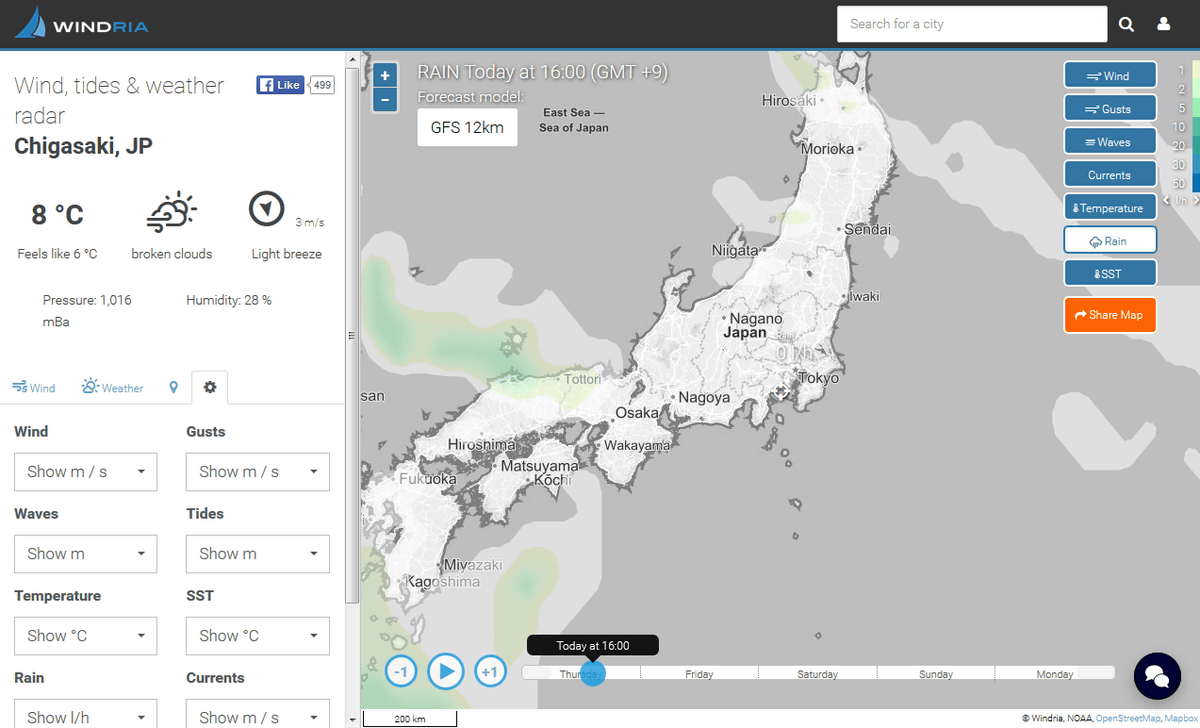
"Rain"
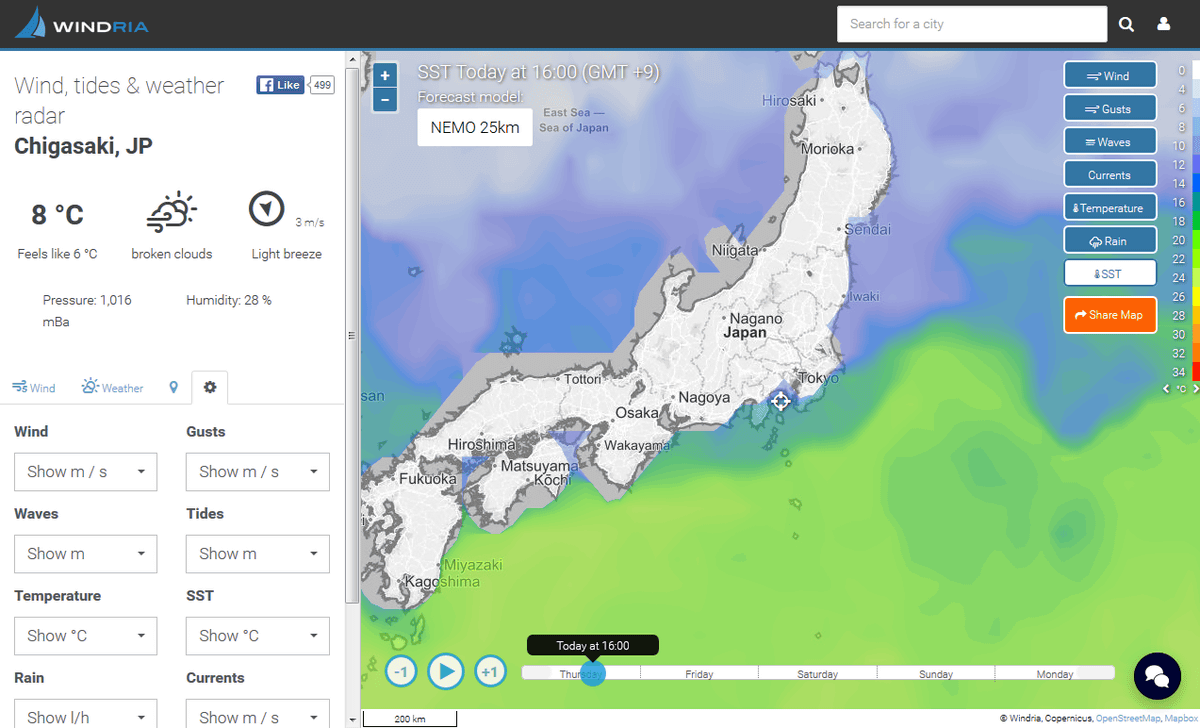
"SST (difference with reference value of sea surface temperature)"
Then click "Share Map" to share the map you are viewing on SNS ...
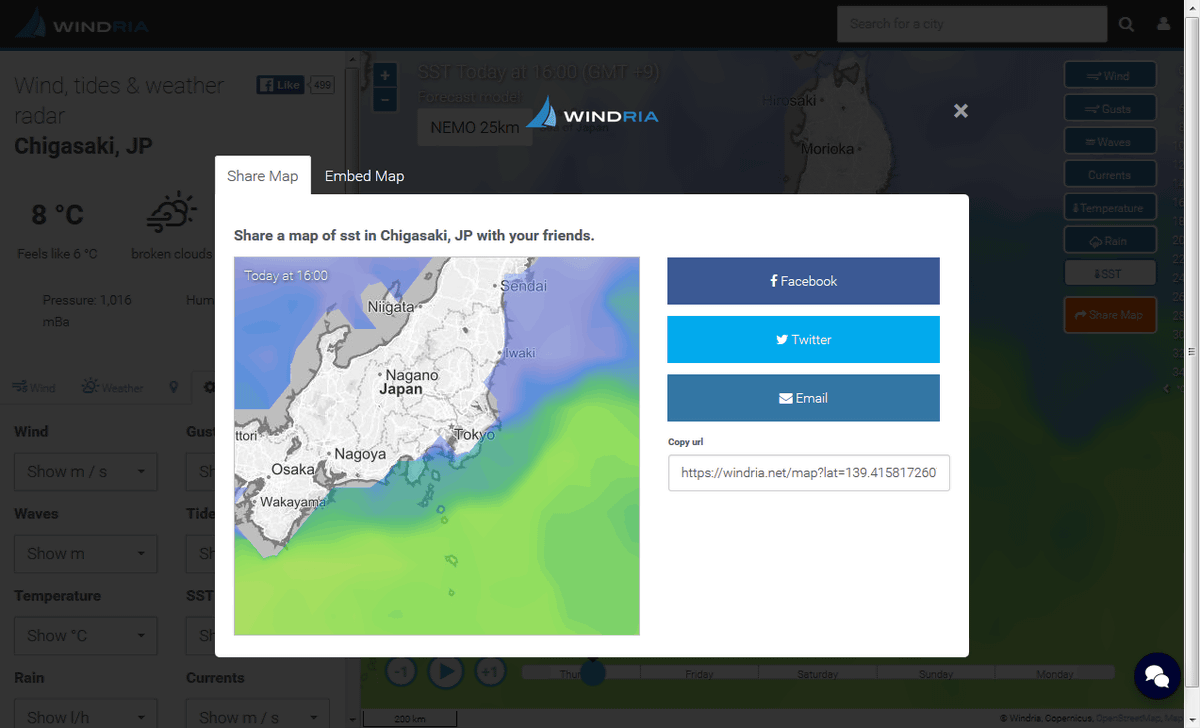
You can also embed the map inside the site by clicking "Embed Map" and copying the HTML code.

The embedded map is displayed as follows.
Furthermore, there are icons "+" and "-" on the upper left of the map ... ...
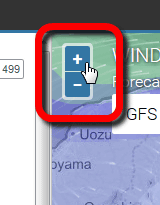
By clicking this you can scale the map.
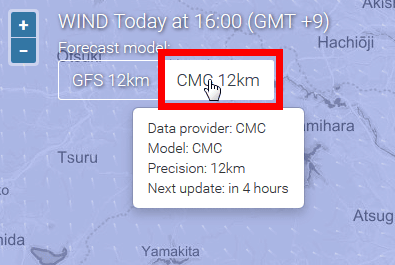
On that side there is a button labeled "GFS", you can change the data source. For example, the following "NOAA"American Oceanic and Atmospheric Administration.

More accurate information can be obtained by checking multiple reference sources.
At the bottom of the map there is a play button and a slide bar which you can adjust to adjust the data up to 4 days later every hour.
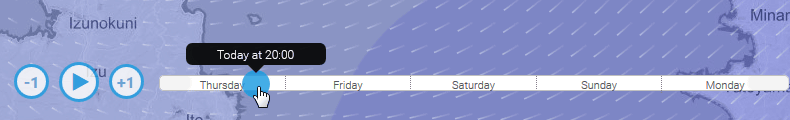
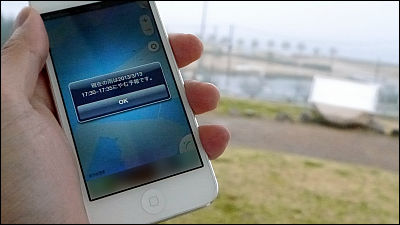
If you look at the top of the slide, you can see when the data displayed on the map is.
Related Posts:
in Review, Web Service, Posted by logu_ii