"Windyty" which can clearly see changes in wind flow, clouds, rain, atmospheric pressure, etc. due to typhoons and their predictions
Windy · temperature · cloud · rain · wave · atmospheric pressure etc. At the moment you can see information on the map at the moment, as well as the site where you can see data from the past and 14 days ahead is "Windyty". As the typhoon approaches, you can see dynamic wind movements.
Windyty, wind map & amp; forecast
https://www.windyty.com/
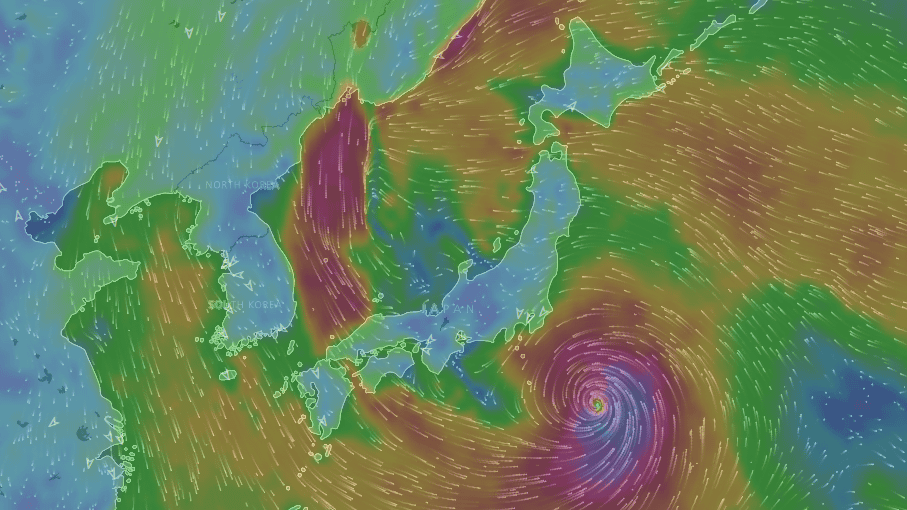
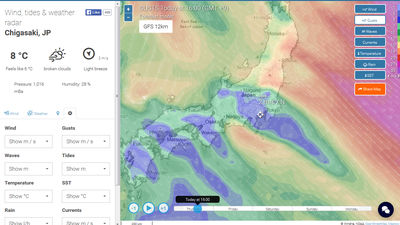
When you visit the site like this you can see the current wind situation.
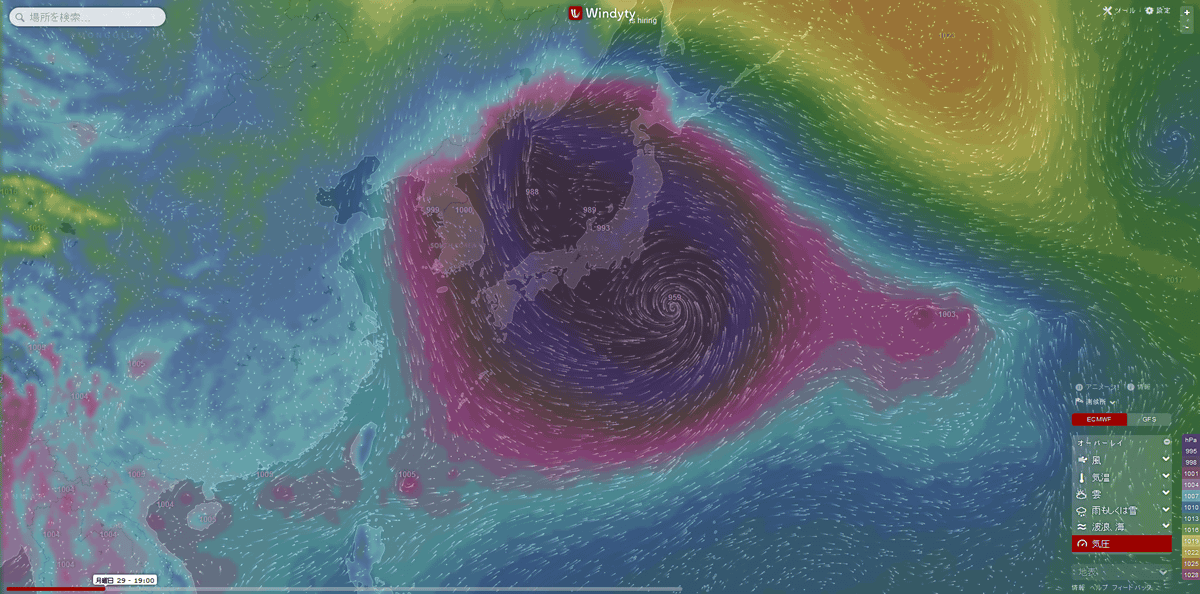
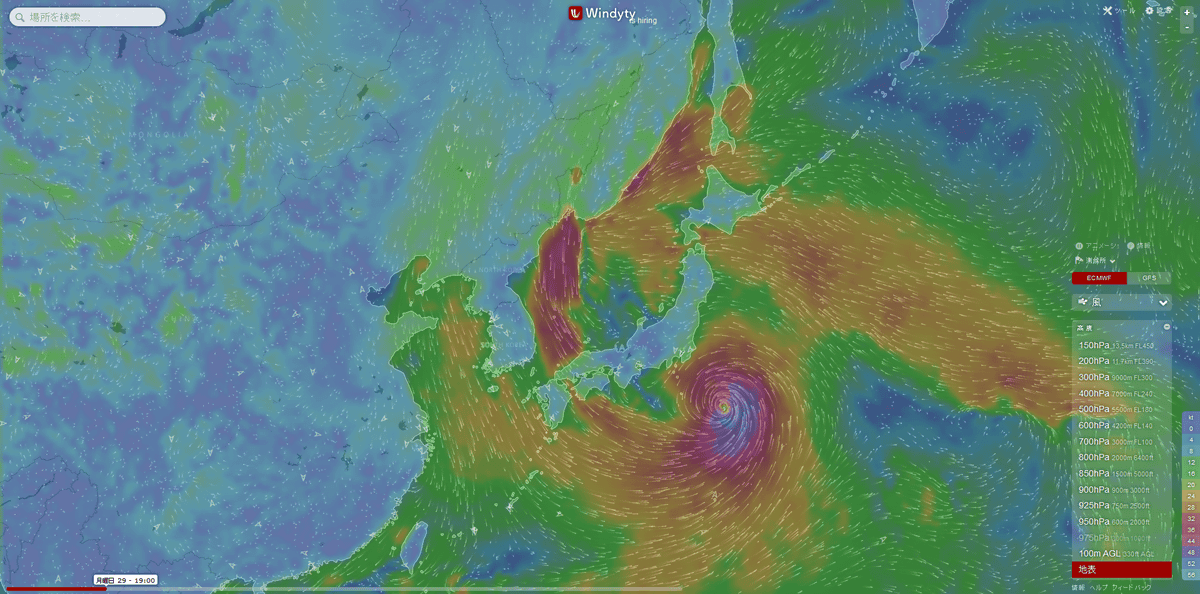
August 29, 2016 posted the article attracted attention as a typhoon that exceptionally movesTyphoon No. 10 (Lion Rock)It is a day when I am getting close to the Kanto region, I saw a state like this.
Windyty - YouTube
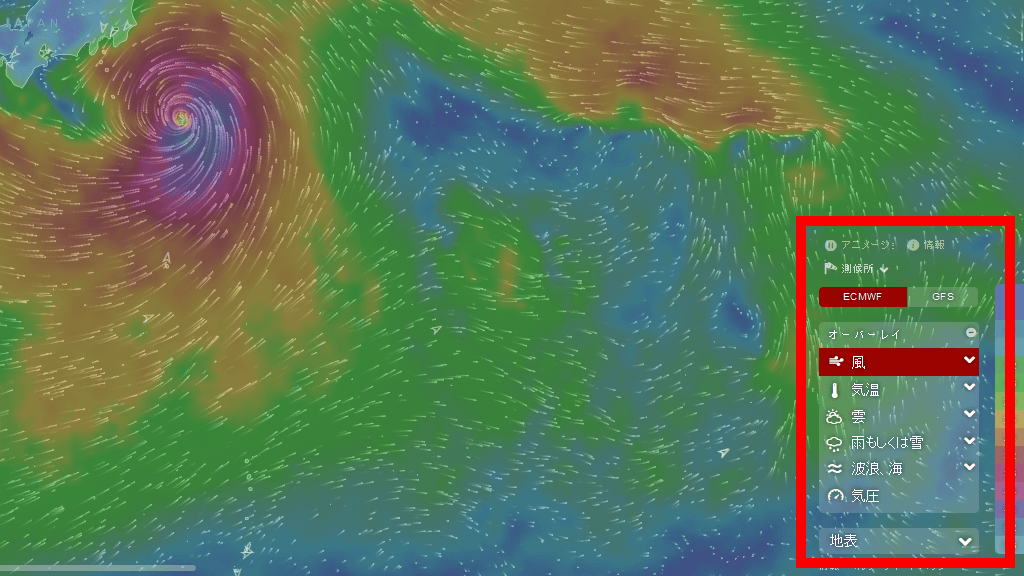
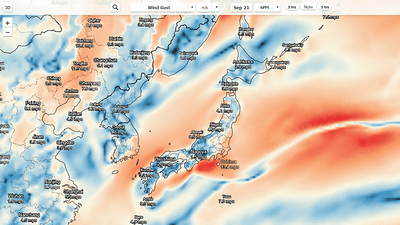
Information to be superimposed on the map can be selected from the menu in the lower right.
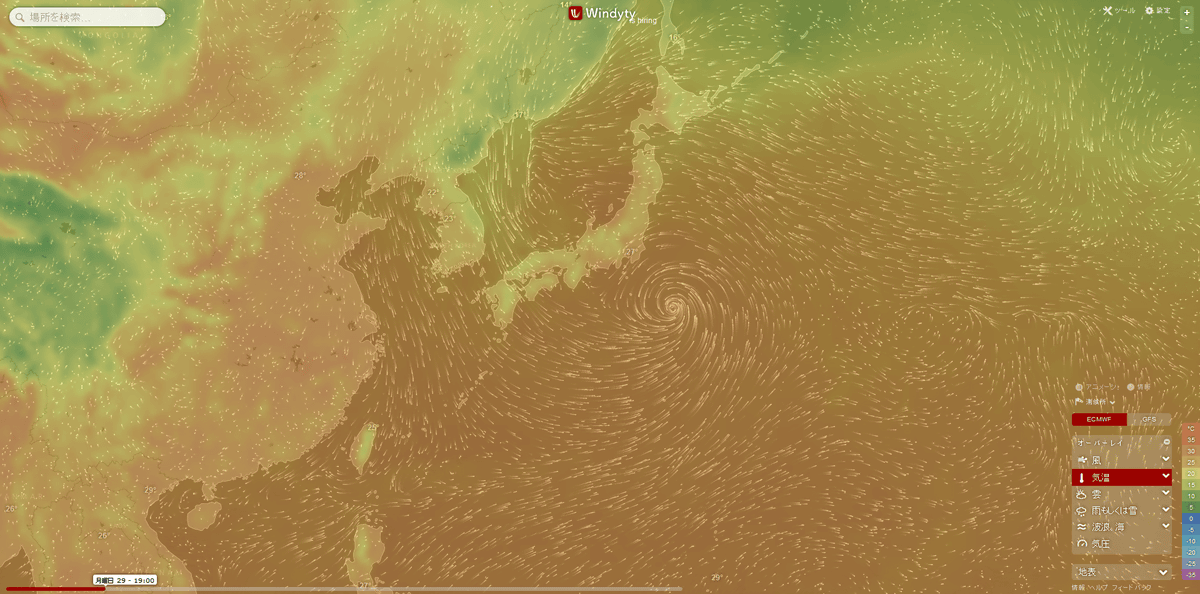
There are many things, for example, "temperature" is like this.
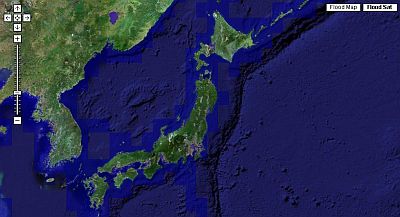
As "clouds", we can see that rain clouds are spreading from Wakasa Bay to the Kii Peninsula due to typhoons.

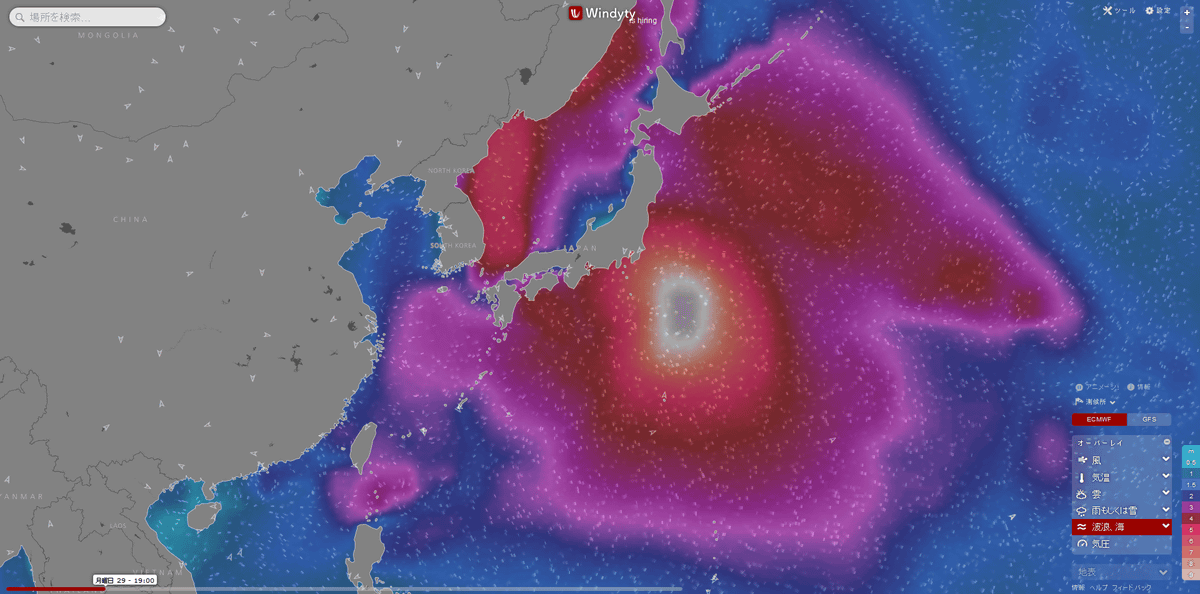
This is a "wave, sea". Large waves are occurring mainly around the typhoon. On the other hand, the Japanese archipelago is shaped like a wall, and the waves are small on the coast of the Japan Sea.
"Barometric pressure" is attached between 995 hPa and 1028 hPa in color coding, so the area around the typhoon becomes almost similar purple. However, looking at the numbers written carefully, it is 959 hPa around the center of the typhoon and 989 hPa around the Noto Peninsula, and there is a considerable pressure difference.
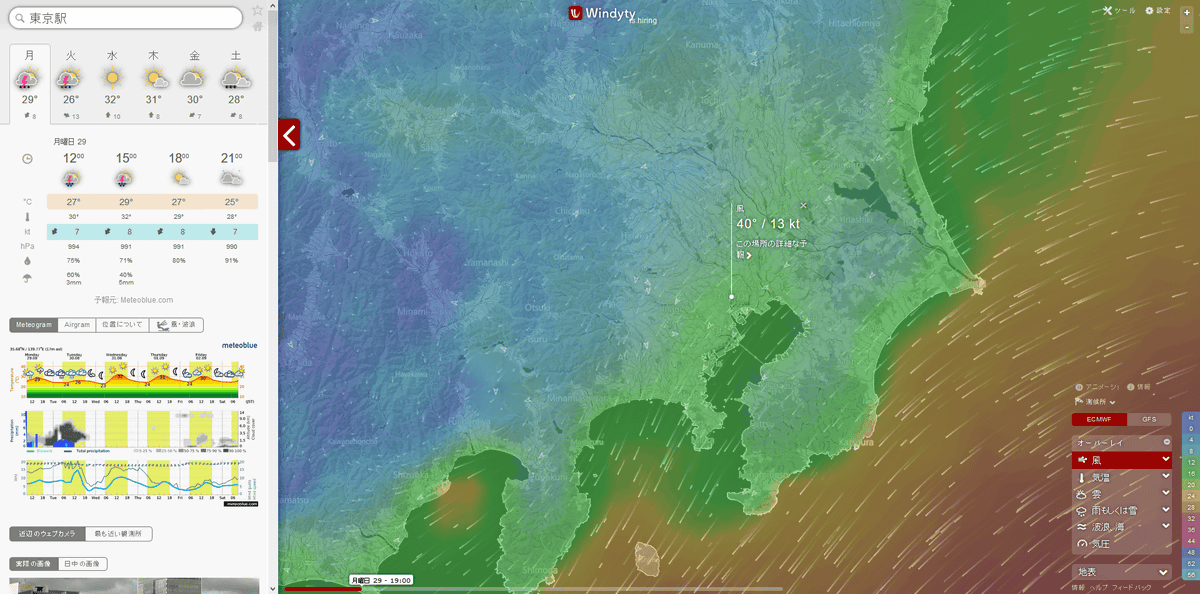
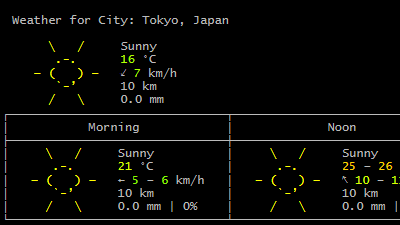
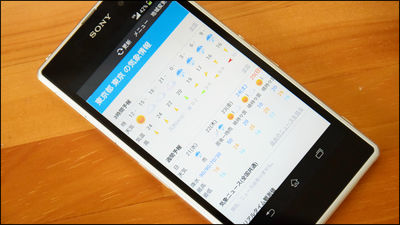
By the way, if you click on the map or search the place name by using the search form on the upper left, you can see the current temperature and wind speed for a specific place, weekly weather forecast and so on.
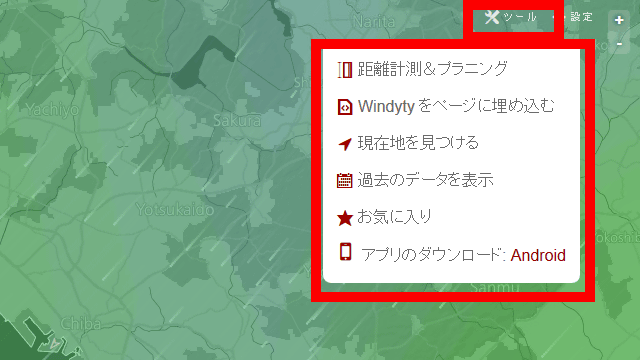
By clicking "Tool" in the upper right, you can measure the distance between two points, generate embedded tags, and more.
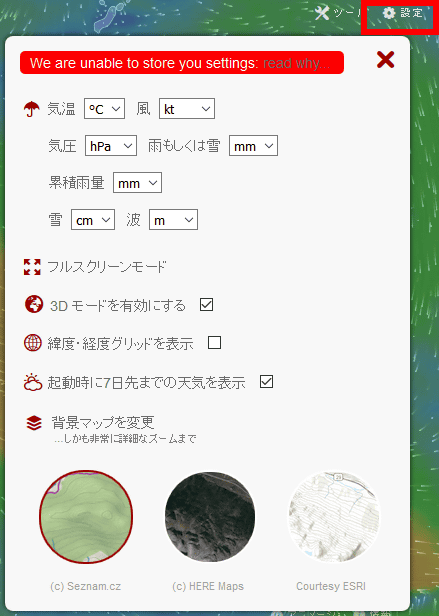
"Setting" can change unit notation such as temperature and wind speed.
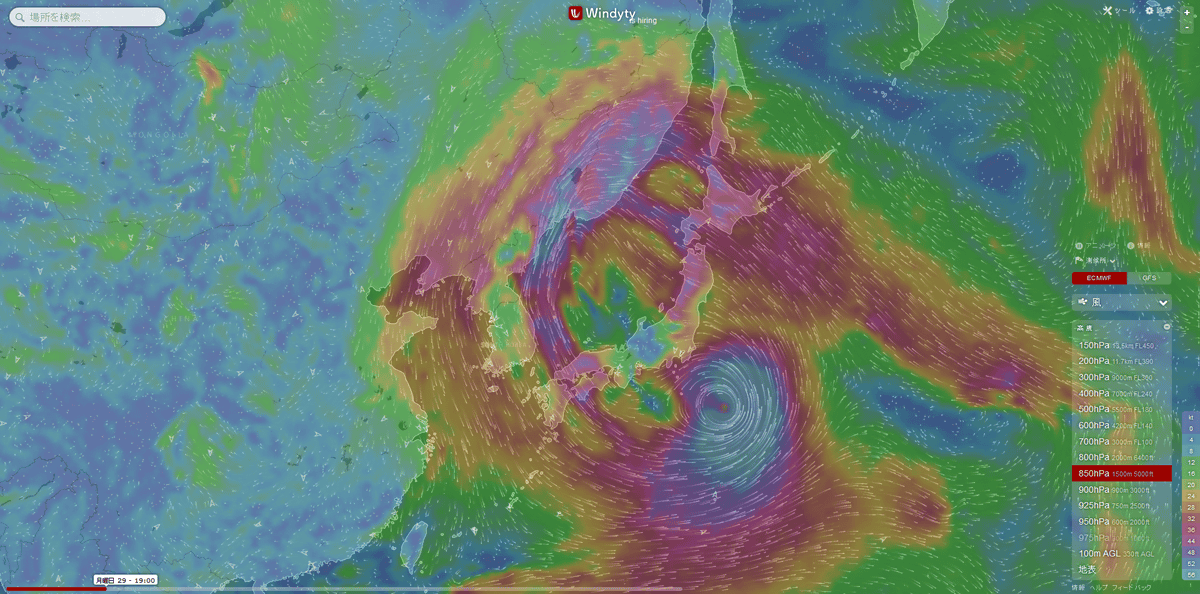
By the way, altitude can also be changed, for example "wind" and "ground" it is like this ...
From 1500 m to 5000 m altitude you can see that there is more amazing wind.
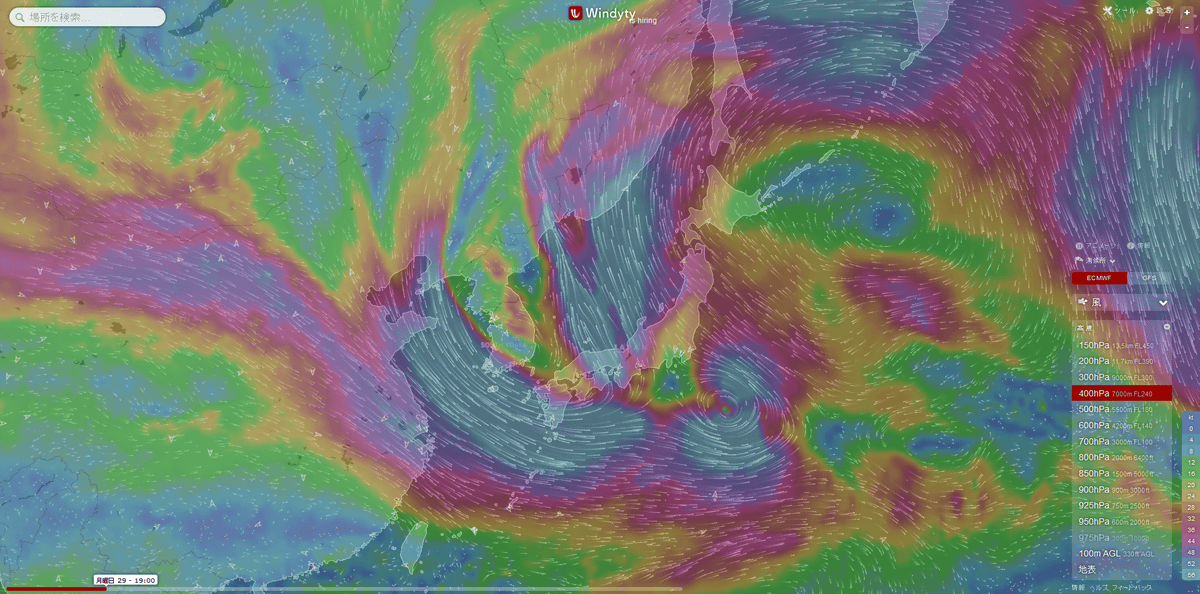
When the altitude goes up to 7000 m, the wind flow different from the typhoon is coming ... ...
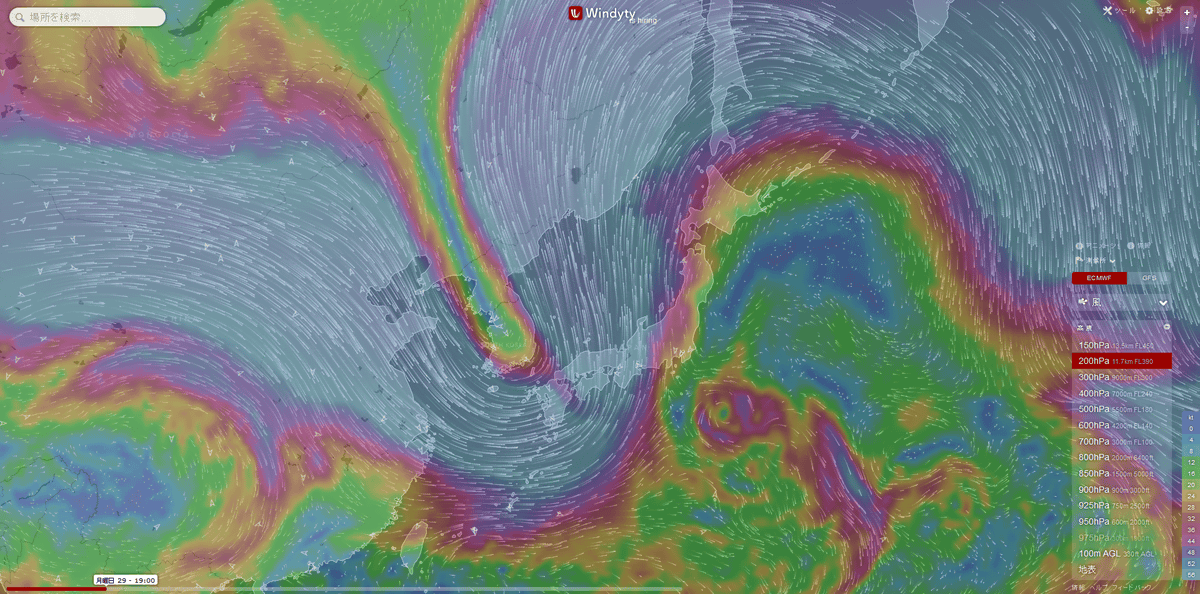
With an altitude of 11.7 km (11,700 m), the typhoon is a bit of a place to know the location, and you can clearly see the meander of the westerlies. This meandering of the westerly wind is one of the causes that typhoon 10 took an unprecedented route.
Windyty has a menu to change the date at the bottom, you can see past data and forecast data up to 14 days ahead. Looking at the path of Typhoon No. 10 using this function, it is like this.
I saw the prediction of the typhoon No. 10 in 2016 at "Windyty" - YouTube
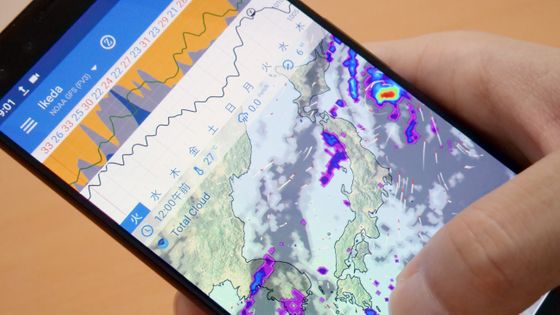
This "Windyty" also has an Android version.
Windyty - Android application on Google Play
https://play.google.com/store/apps/details?id=com.windyty.android

Related Posts:

in Video, Web Service, Review, Posted by logc_nt