`` Flowx: Weather Map Forecast '' review that you can swipe around and understand the changing weather with your eyes

“ Flowx: Weather Map Forecast ” is an Android app that allows you to overlay weather information such as rainfall and temperature on a map in layers and swipe to see changes over time. It is said that it is an application that can use abundant weather data for free and can intuitively see the change of weather etc. while swiping forward and backward of the change of time, so it is installed immediately I tried to defeat it.
Flowx-Home-Flowx
Flowx: weather map forecast-apps on google play
https://play.google.com/store/apps/details?id=com.enzuredigital.weatherbomb
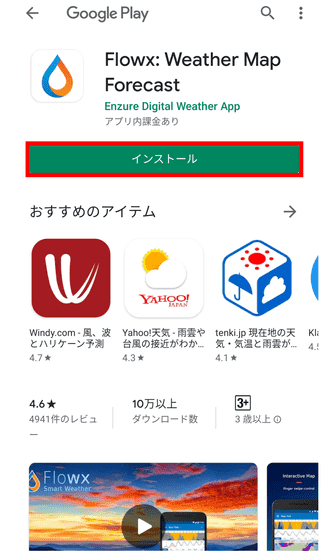
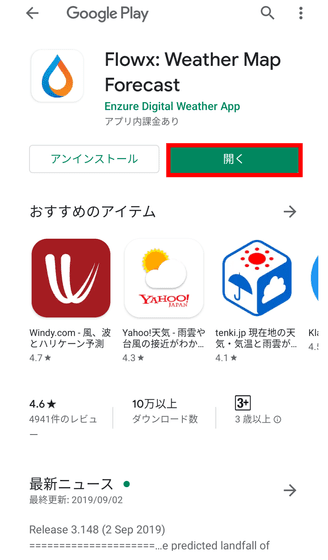
Flowx is only released for Android at the time of article creation. To install, first access the above URL, then tap “Install”.
Tap 'Open' when the installation is complete.
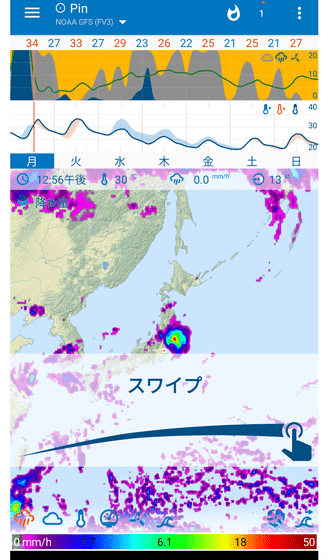
This is the Flowx home screen. A line graph showing the probability of precipitation, precipitation, and temperature is displayed on the rain cloud map color-coded for each precipitation.
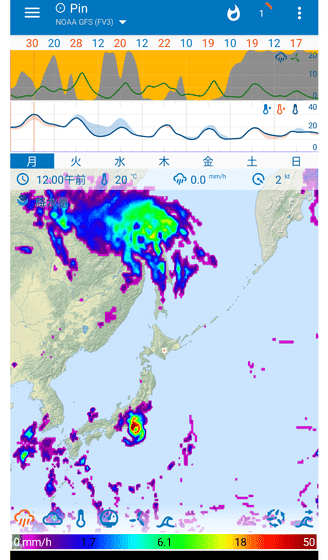
When you play the following movie, you can see how it actually moves by swiping the screen.
Swipe while tapping on two points to change the center of the map.
It is also possible to center any point. First press the upper right button ...
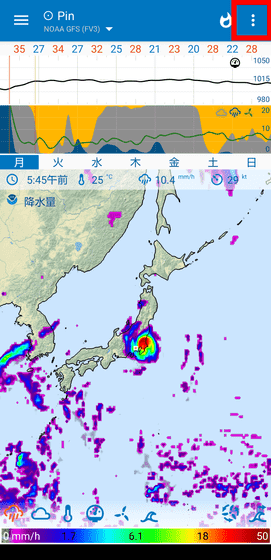
When the menu is displayed, tap “Change location”.

Enter the place name in the search field and tap the search button.

Confirm that the place you want to center is marked and tap the “SAVE” button.

Because we searched for “Tokyo”, Tokyo became the center of the map.

You can reduce the map by pinching in. When you reduce to the limit, you can view weather data from all over the world.

Conversely, you can pinch out to enlarge the map. The scale when I expanded the vicinity of Yubari in Hokkaido to a maximum is like this.

Press and hold the graph on the map to display the menu. Tap 'Compare' from the menu ...

The original data for the graph could be selected from “NOAA GFS”, “CMC FDPS” and “DWD ICON”. By default, 'NOAA GFS (American Ocean and Atmospheric Administration)' data is displayed.

In 'Select Graph' ...

You can select the type of graph. The graphs are 'Monkey wedding (rainfall)', 'Cricket Chips (temperature)', 'Sun Dogs (barometric pressure)', 'Starry Night (humidity)' and 'Sailors Delight (wind power)' from the top. As a trial, tap “Sun Dogs” in the barometric pressure data.

Then, the graph on the map changed.

Tap “Move up” ...

The graph has moved up.
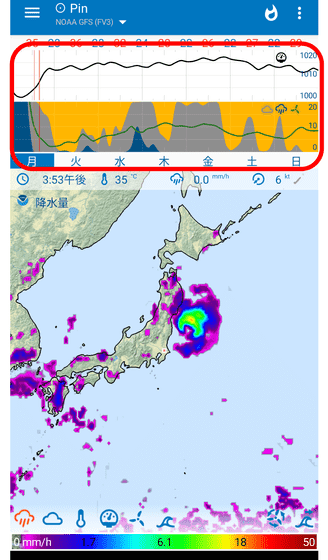
To change the numerical range of the graph, tap “Set Range” and then ...
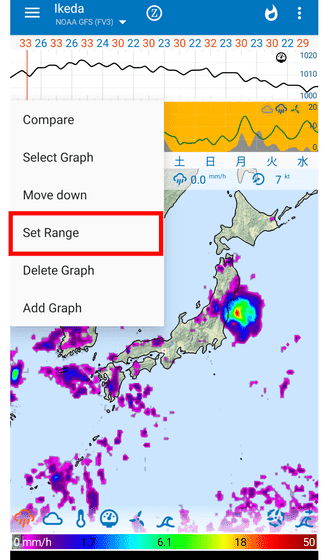
Check the “Pressure” item, enter the lower and upper limits, and tap “Set”.

Then the upper and lower limits of the graph changed.

Tap “Delete Graph” to delete the graph.

The graph on the map has been changed from two to one.
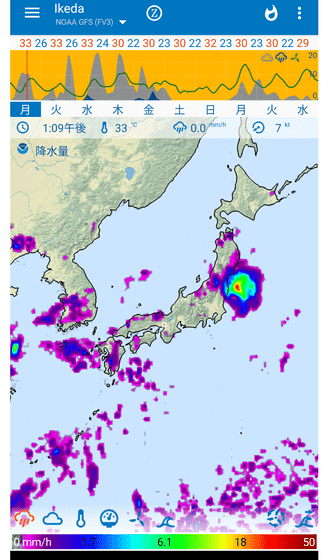
To add it in reverse, tap “Add Graph”.

Next, tap the graph you want to add.

There are now two graphs on the map.

Although the map will be smaller, it is possible to display all types of graphs.

In Flowx, you can switch the weather information layer to be overlaid on the map. By looking at the following movie, you can see how the appearance of the map changes by switching the layers actually added to the map.
Switching layers with `` Flowx '' looks like this-YouTube
The leftmost icon at the bottom of the map is the default raincloud map layer. Up to two layers can be layered, “Rain cloud map + another layer”. For example, tapping the second icon from the left will add a “Total Cloud” layer for all types of clouds, including rain clouds.

Temperature layer

The “barometric pressure” layer looks like this. Since the

`` Wind Speed '' layer

Wave height layer

The second “Wind Direction” from the right shows the movement of the wind as an animation.

If you add the rightmost “Wave Direction”, it looks like this.

This layer can be edited. To edit, tap the menu button in the upper right corner ...

Tap “Change location”.

Next, tap the button surrounded by a red frame.

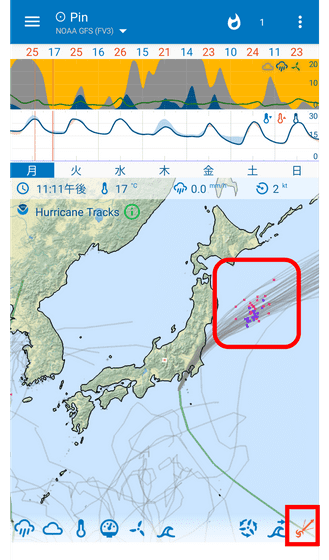
Then, a list of layers is displayed, so you can switch the buttons arranged at the bottom of the map by tapping the check box to the right of each layer. For example, if you add 'Hurricane Tracks' ...

A new icon has been added at the bottom of the map. When you tap this “Hurricane Tracks” icon, the typhoon trail will be displayed as shown in the red frame on the map.
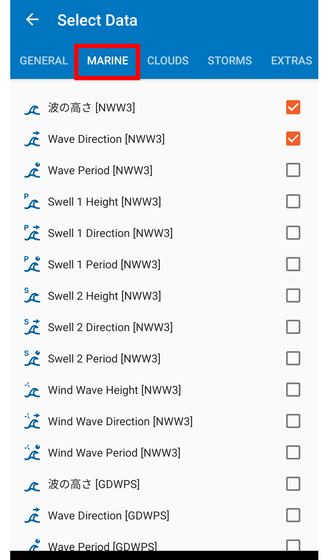
Besides, layer of wave height and direction ...
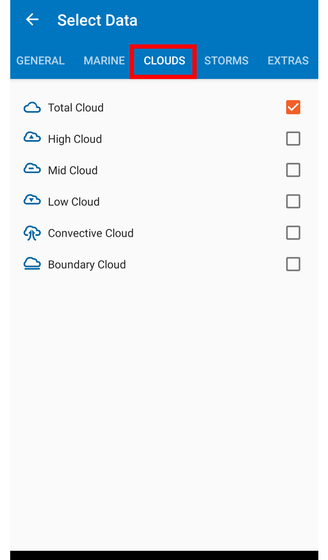
Different types of cloud layers
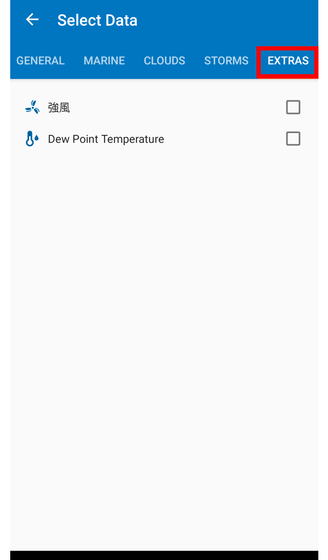
'CAPE (

There are layers of strong wind and
If you select “Settings” from the menu that appears by swiping from the left to the right of the screen ……

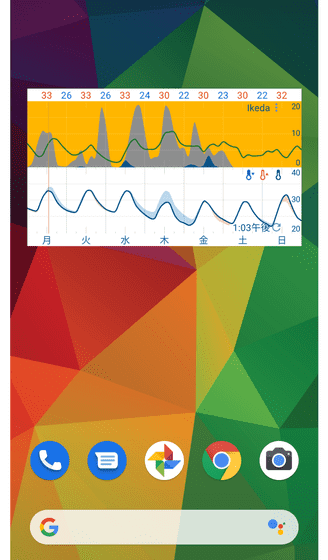
You can finely change the appearance of the widget and the units displayed on the map.

The widget looks something like this.
You can use Flowx for free, but you can also purchase a paid version with more features in the form of a subscription.

For the paid plan, the 'Bronze' plan (550 yen per year), which can be changed from 7 days to 10 days, and the 'Silver' plan (1100 yen per year) with additional sources available in addition to this ...

There is a “Gold” plan (2120 yen per year) that will release all available sources for Flowx. Since there is a free period of 2 weeks, I tried to join the 'Gold' plan for trial.

Then, 'Edit Graph' was added to the menu displayed when you press and hold the graph. Try tapping ...

The items displayed on the graph could be customized.

This makes it possible to use an original graph with all the data you want on a single graph. The period of the graph has also increased from “7 days” to “13 days”.

More layers can be added to the map. For example, if you add a “Radar Reflectivity” layer ...

A weather radar layer has been added to show the details of rain clouds.

Besides, the layer of information about waves has increased in number, so it is perfect for those who enjoy marine sports such as surfing.

If you feel that you don't need that much data, you can cancel your subscription within 14 days of joining and you won't be paid. To cancel your subscription, select “Subscription” from the Google Play app menu.

After selecting “Flowx” ……

Tap 'Cancel subscription' to complete.

Flowx allows you to intuitively understand the changing weather by swiping the map left and right, so you can see not only weather forecasting and disaster prevention, but also the trajectory of how the clouds flow and typhoons wander over the sea It is an app that can be enjoyed just by itself.
Although only the Android version has been released at the time of writing the article, the official website has also started accepting registration for the iOS version, so it seems that you can expect to be able to use it on the iPhone in the near future.

Related Posts:


