"Flooding Navi" that can grasp the risk of flooding caused by river breakdown by moving animation
During typhoon season from summer to autumn, flood damage caused by heavy rain occurs every year in Japan. "Infiltration simulation search system by point" published by the Ministry of Land, Infrastructure and Transport · Geographical Survey InstituteFlooded navigation) "Has become a system that can search the risk of flooding due to flooding of rivers etc. from the web and by designating the point to be examined on the map only" Which river flooded when flooding "" After the river breaks down , How long the flooded water will reach, "" how long, how long the flooded state will last ", and so on.
The risk of flooding in places you want to know is found on the WEB site - Dispersion simulation retrieval system by site (publicly known as flooded navigation) released - | Geographical Survey Institute
http://www.gsi.go.jp/bousaichiri/bousaichiri60021.html
Inundation simulation retrieval system by point
http://suiboumap.gsi.go.jp/ShinsuiMap/Map/
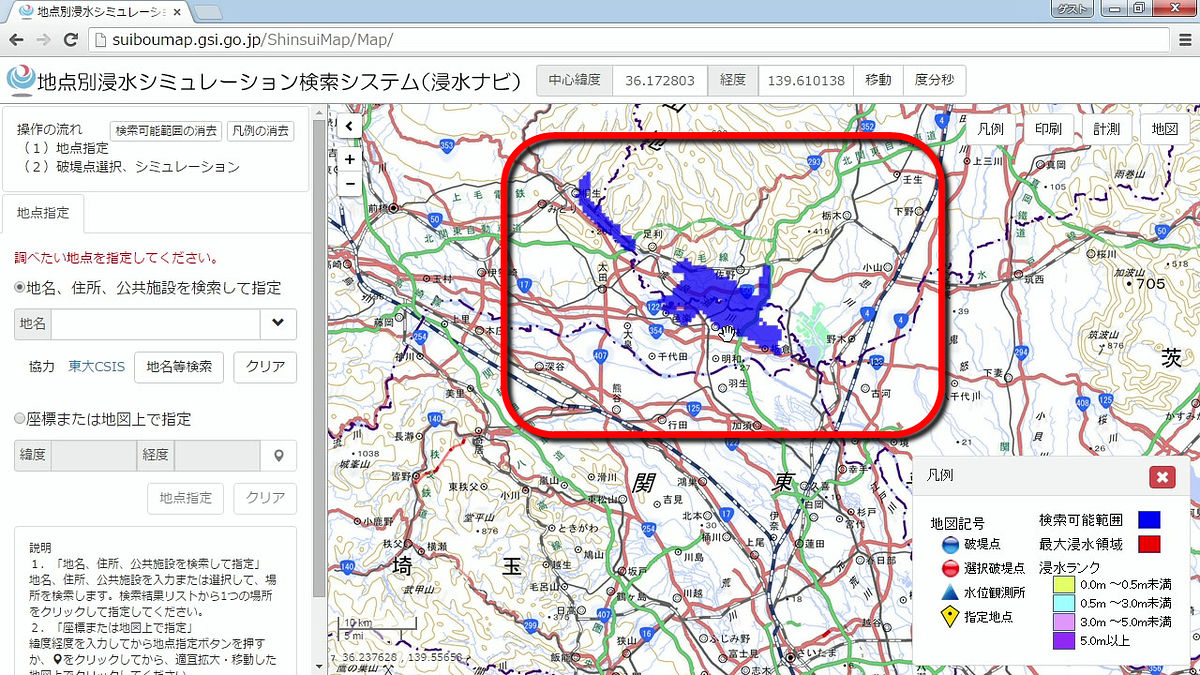
Actual use is seen from the following movie. By zooming in and zoom out the area you want to examine and specifying the point by clicking on the map etc., you can simulate the state of flooding at that point and the spreading of inundation at the time of river flooding with animation or graph. In addition, at the time of article creation, the searchable area was limited to some areas, and it was designed to be recognized in the blue area on the map.
I tried to check the state of the area where there is a risk of flooding in "flooded navigation" - YouTube
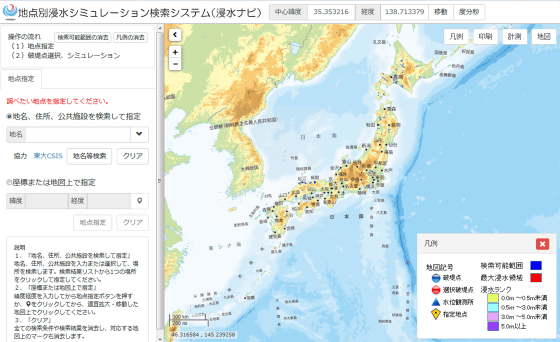
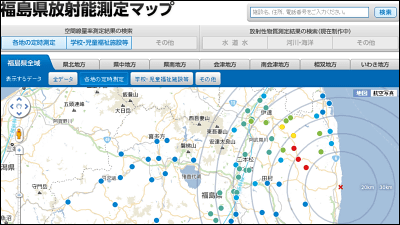
When you visit the site, the map will be displayed. As mentioned above, in flooded navigation, it is possible to search and confirm only rivers where "Flood simulation data" is posted, and the searchable points are displayed in blue on the map. The rivers that can be searched are 119 rivers nationwide at the time of article creation,This pageIt is possible to check from.
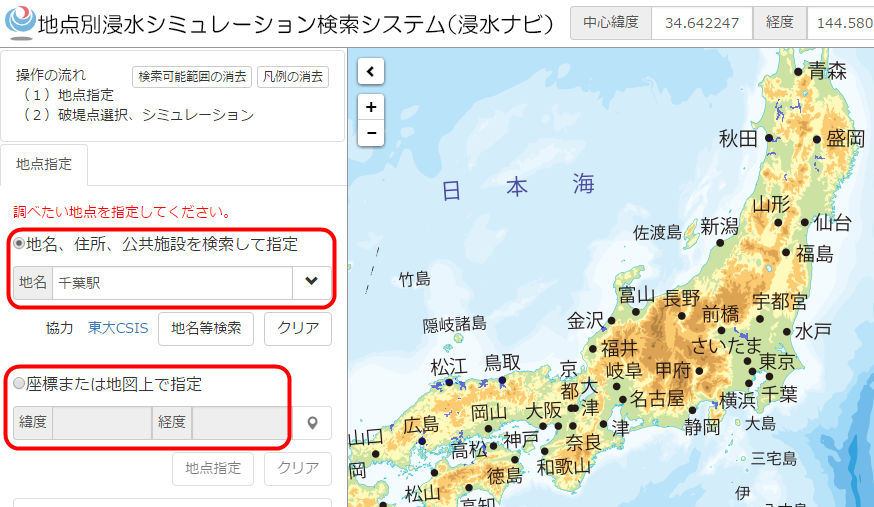
Zoom up the map, select "Designate on coordinates or map" on the left side of the screen and click on the icon, you can select the desired point on the map.
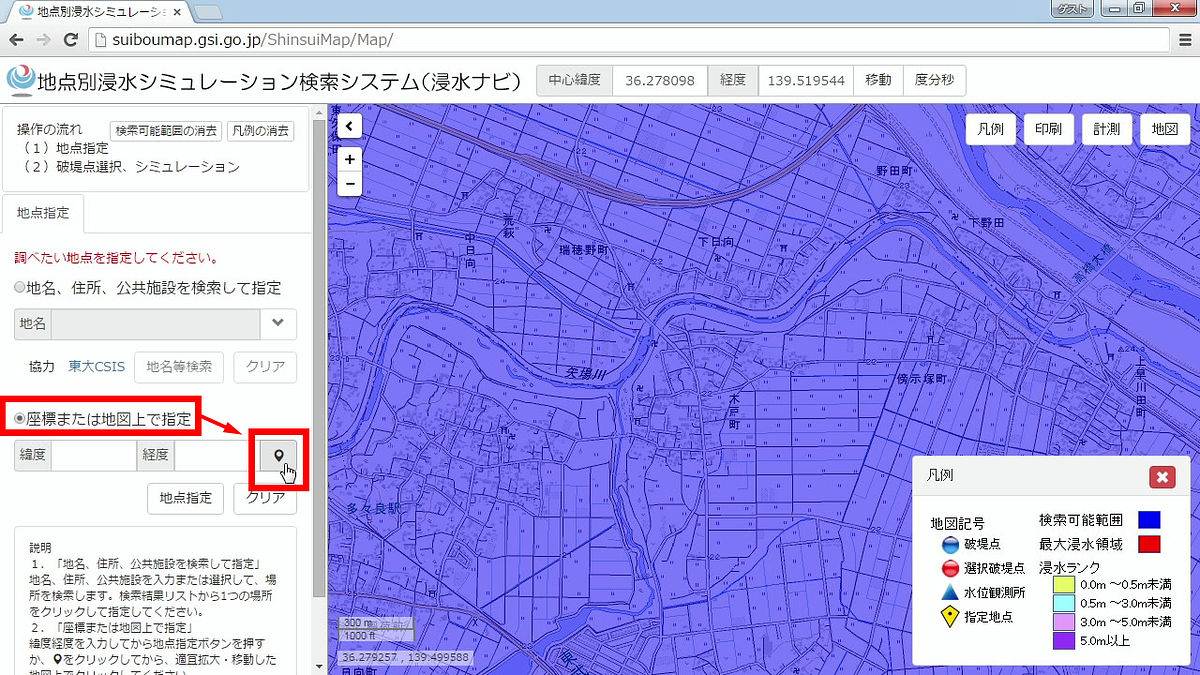
If you want to pinpoint on your home or a specific place, you can search by location name or search by specifying latitude / longitude.
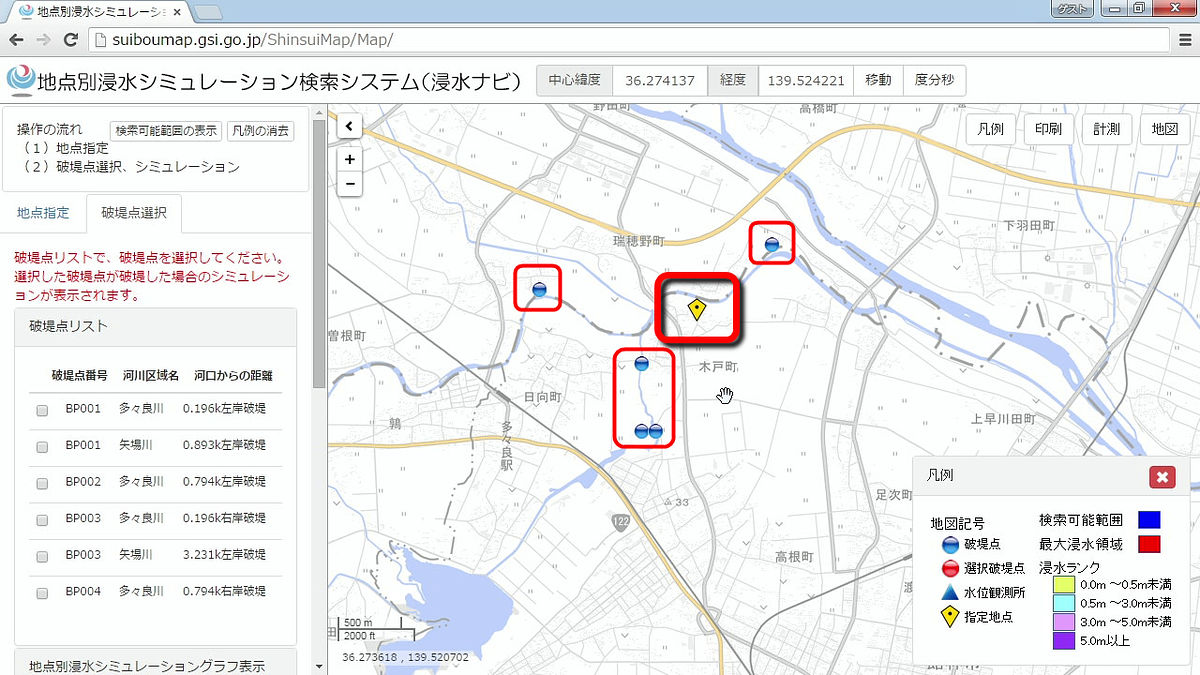
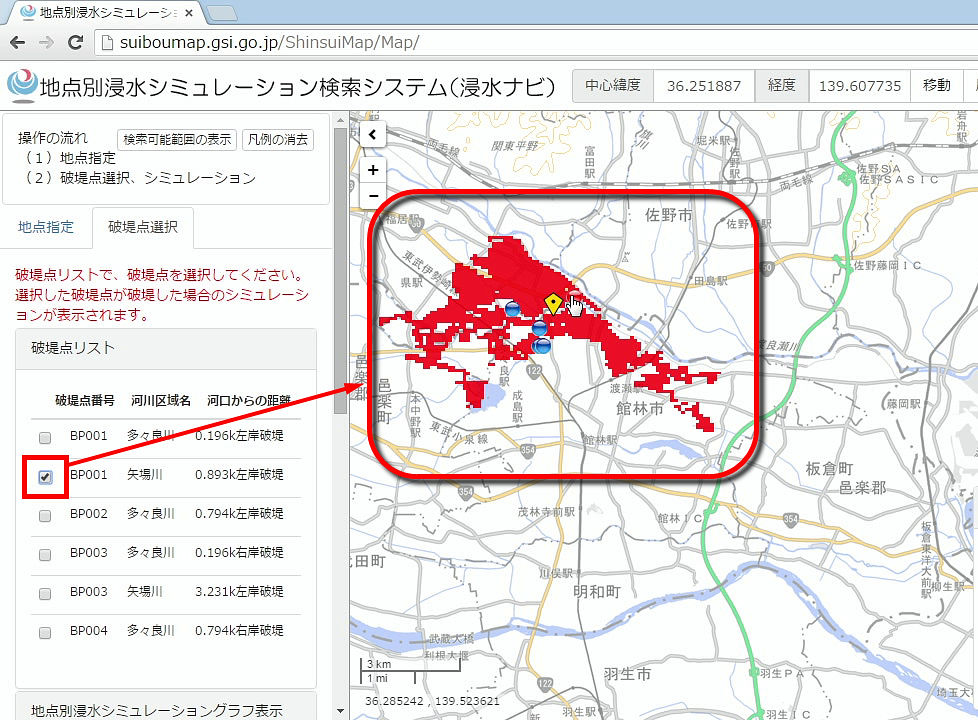
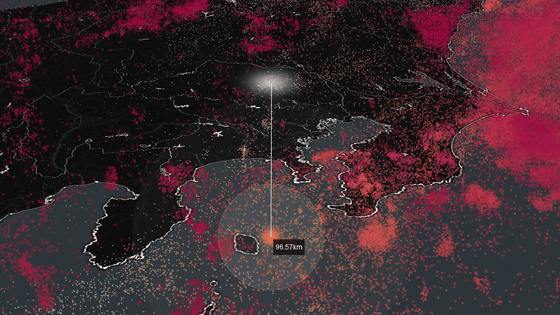
When you specify a point on the map, a yellow icon is displayed, and a blue circle icon is displayed around it. This is because "river breakdown is expected"Break-through point"The break-through point, which may cause damage to the specified point, is displayed on the screen.
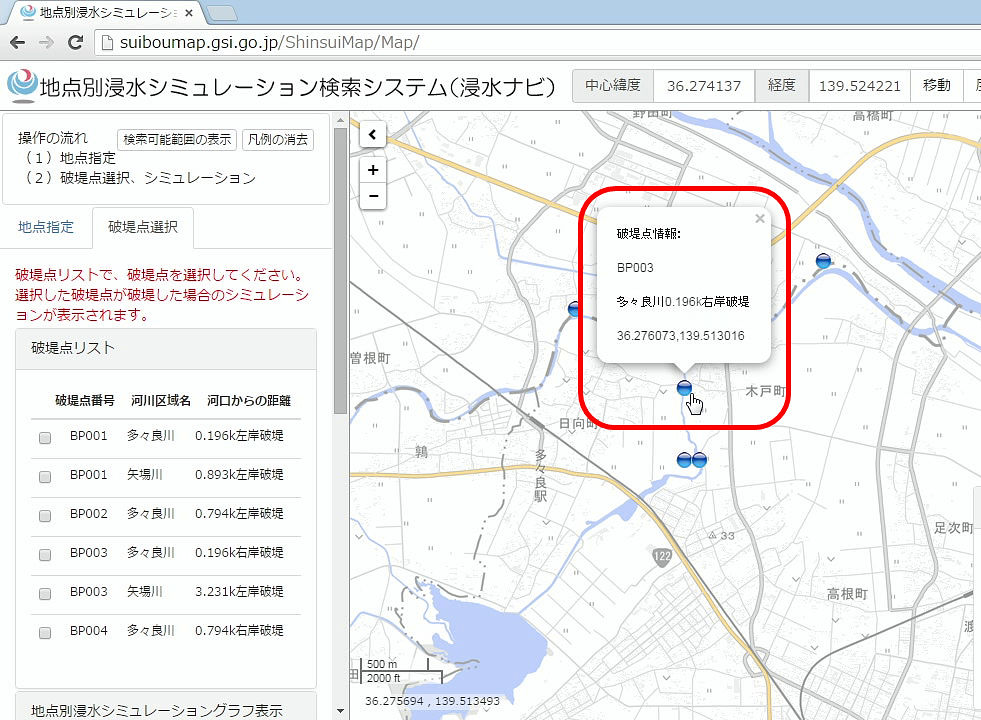
When you move the mouse cursor to the break point, the coordinates and name of the break point, the place where the breakdown is expected, etc. are displayed. Clicking on the icon further ......
A flooded area assumed when the break point was broken was displayed in red. In the list on the left the selected bank break points are displayed.
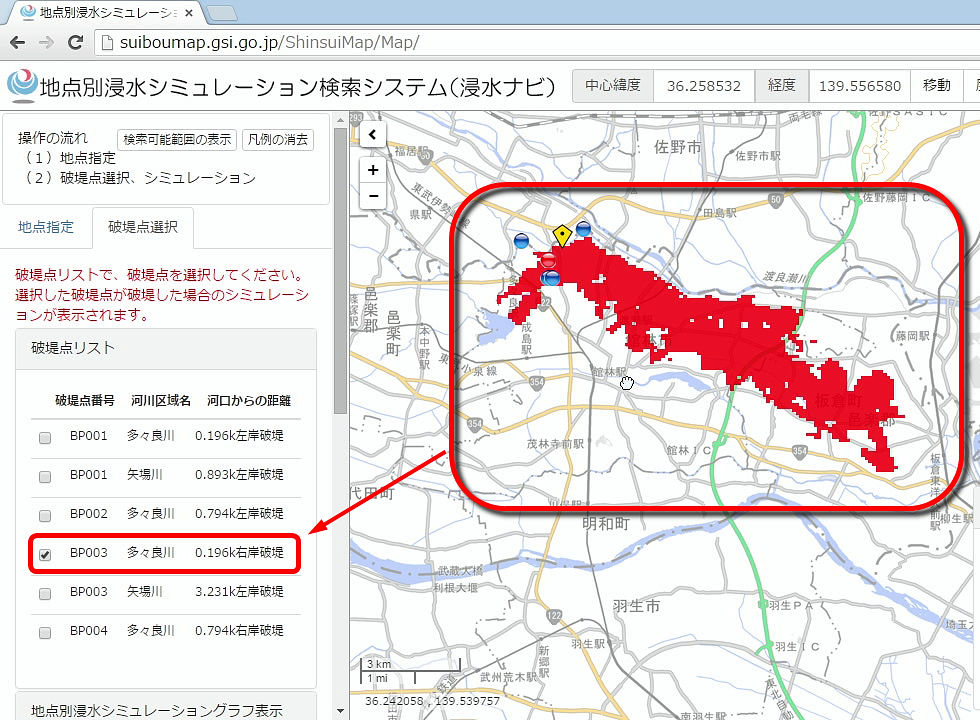
It is also possible to confirm by choosing a break point from the list. Switching the break-through point will also change the flooded area.
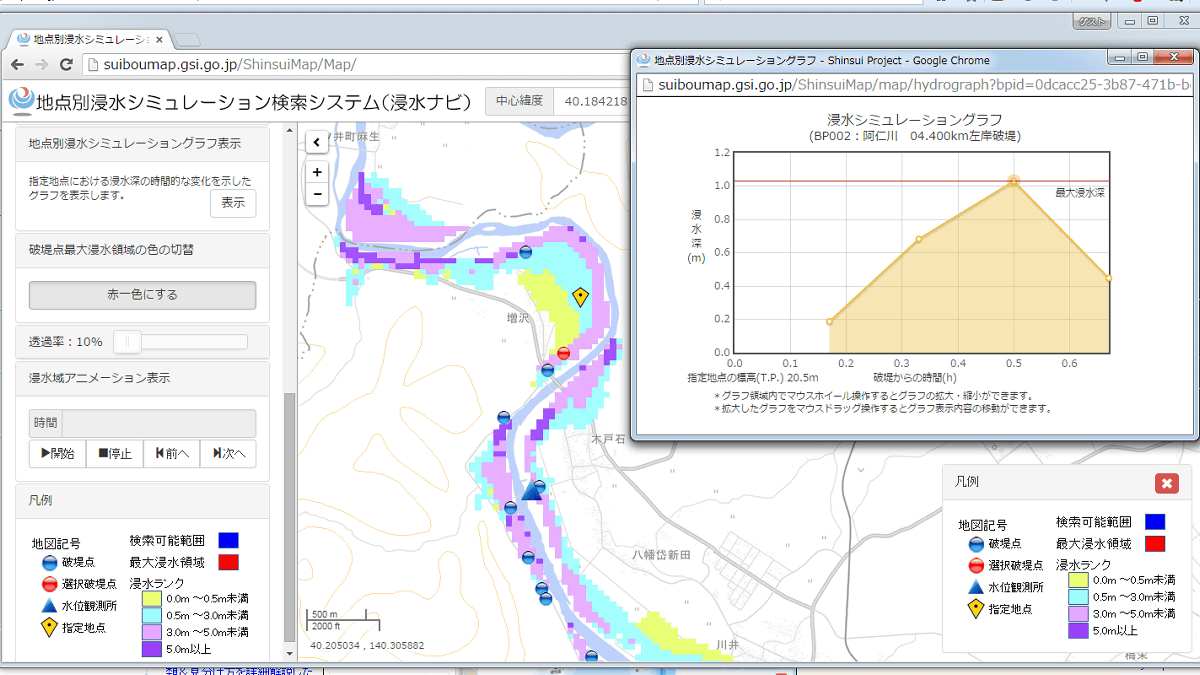
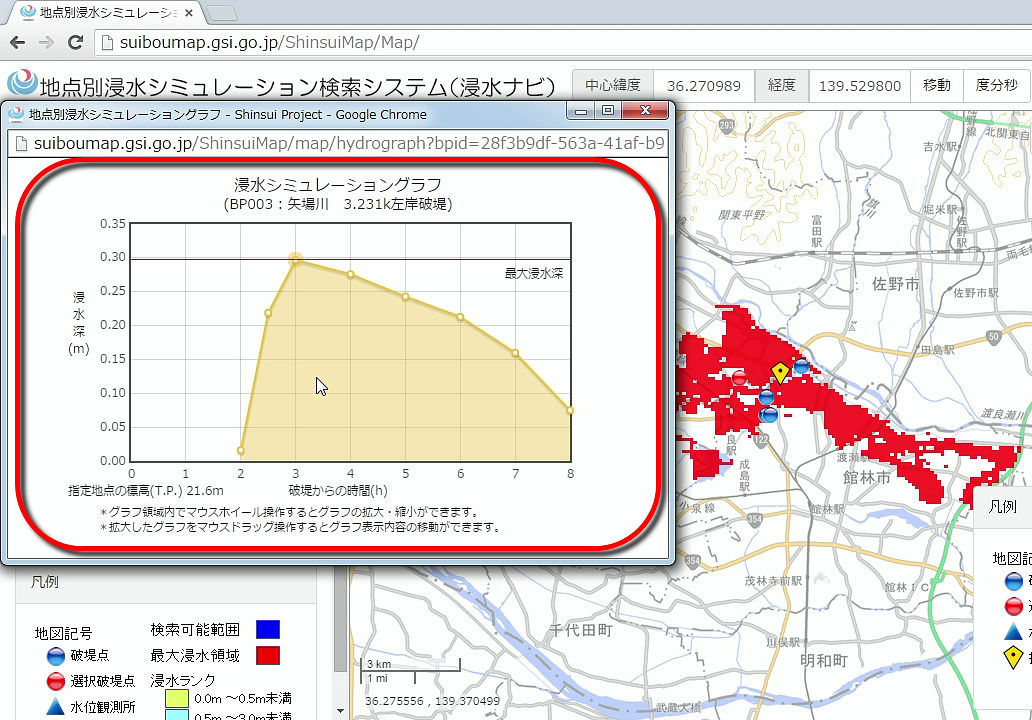
You can also display a graph showing what inundation is assumed at a specified point when a specific breakage point breaks down. In this graph, it is shown that water rushes 2 hours after the collapse and reaches a maximum water depth of 30 cm at 3 hours.
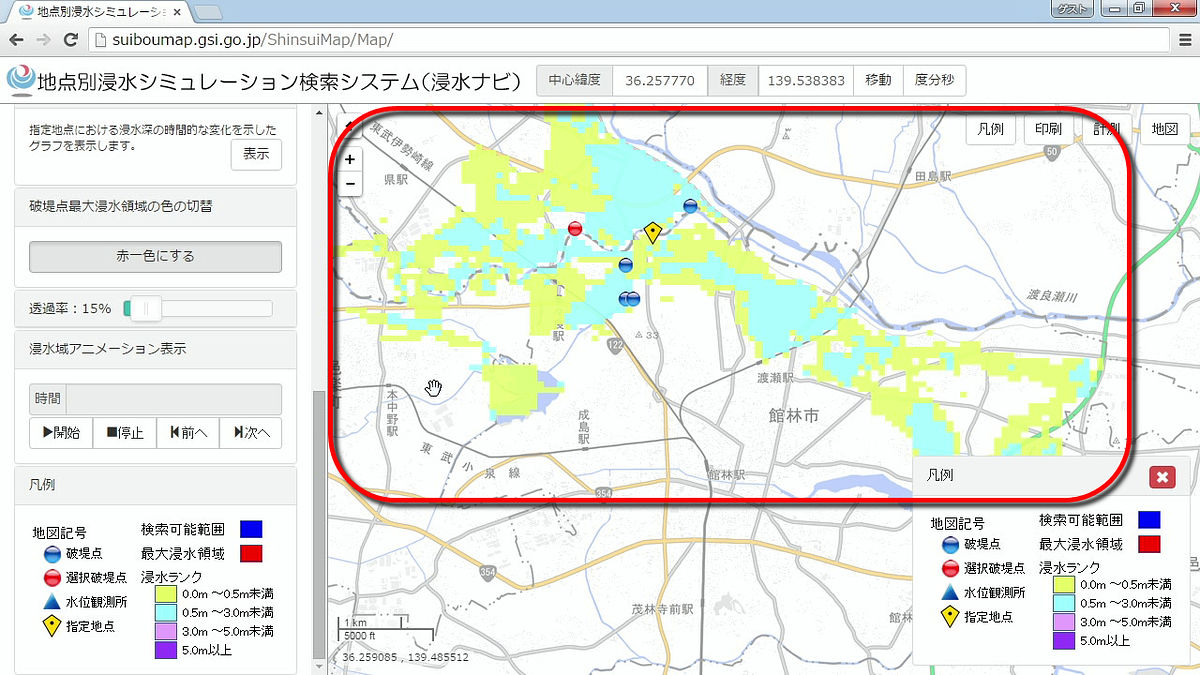
It is also possible to change the flooded area to a color-coded display at the assumed depth. We can confirm more certainly which area is more risky.
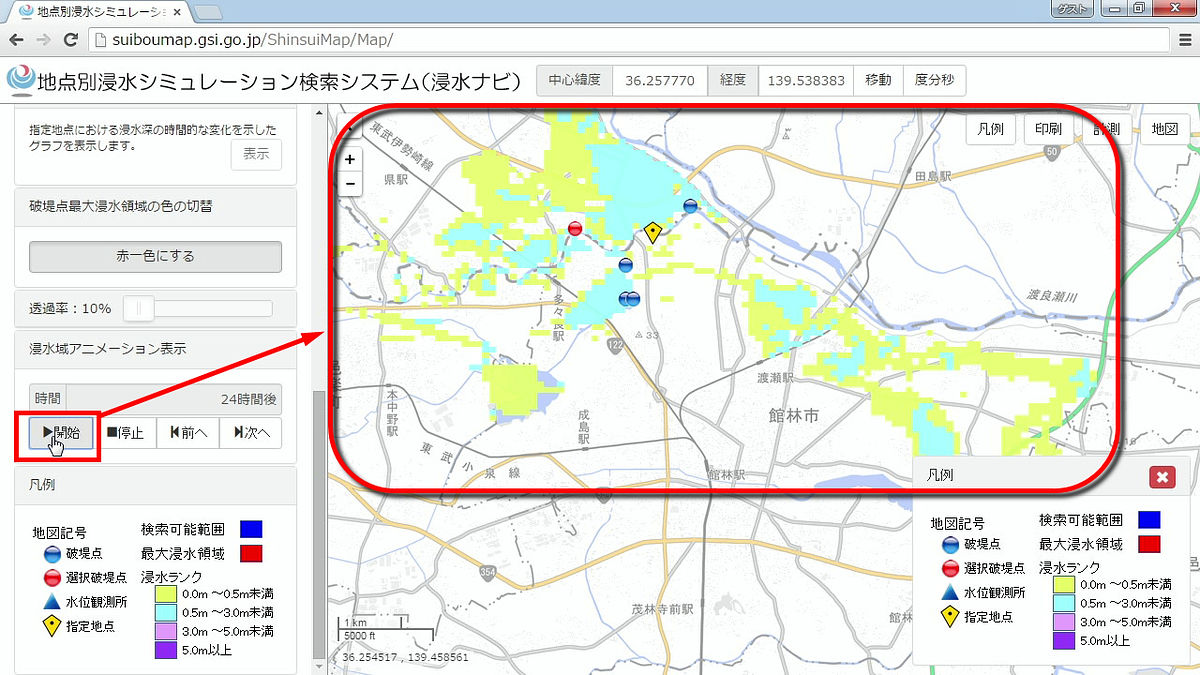
Furthermore, it is also possible to display an animation that predicts the extent of flooding on the time axis from the collapse to about one day after the crash. In flooded navigation, it is now possible to interactively grasp the risk of disasters in this way.
Since the inundation map is a simulation based on data only, care must be taken that the disaster does not necessarily occur in the form that actually follows this information. Still we can grasp to what degree the risk exists in the area where I live in advance, so it seems to be good to check once before the typhoon season.
The corresponding river is planned to be added in the future, and it is planned to correspond to the search of inundation / storm surge supposed area map data by the end of the fiscal year.
Related Posts:

in Review, Web Service, Posted by darkhorse_log