'Electrical Japan' full of power information such as distribution maps of more than 10,000 power plants nationwide and power supply and demand performance graphs
In March 2022, a tight supply and demand warning was announced within the jurisdiction of TEPCO and Tohoku Electric Power, and in June 2022, the Japanese government requested power saving nationwide, saying that the supply and demand of electricity in the summer would become severe. From these situations, it can be seen that Japan's power supply and demand system is in a pinch, but in the first place, I am wondering what kind of power plant is operating and where in Japan. The power plant map ' Electrical Japan ' created by Professor
Electrical Japan ―― Japan's power problems from power plant maps and night view maps | Great East Japan Earthquake Archive ―― National Institute of Informatics
http://agora.ex.nii.ac.jp/earthquake/201103-eastjapan/energy/electrical-japan/
◆ Table of contents
・ 1: Visualize the distribution of more than 17,000 power plants installed all over Japan
・ 2: Check power plants by power company and power generation method
・ 3: Check the history of power plant installation in Japan with animation
・ 4: Check the power supply and demand performance graph of each power company
◆ 1: Visualize the distribution of more than 17,000 power plants installed all over Japan
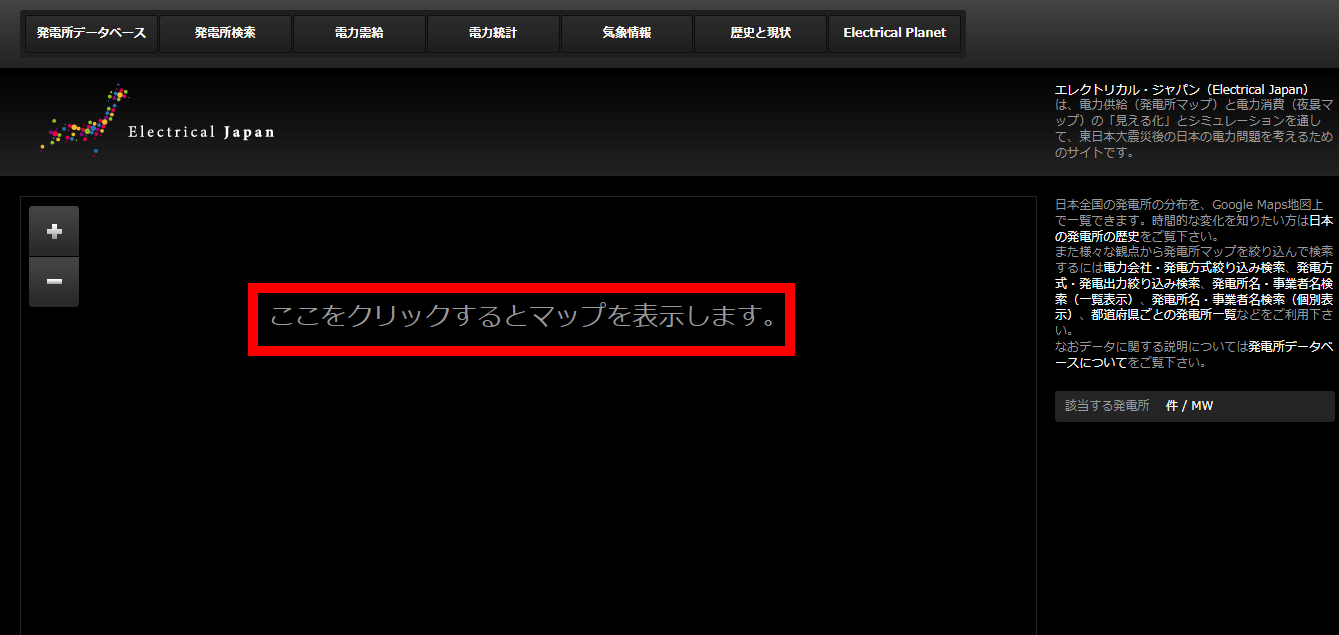
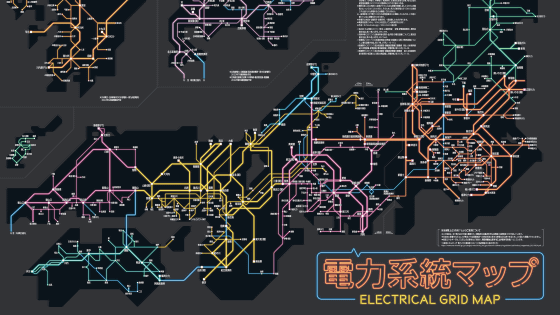
When you access Electrical Japan, the following screen will be displayed. Click on the part that says 'Click here to see the map' ...
A map with a round mark is displayed at the place where the power plant is located like this.
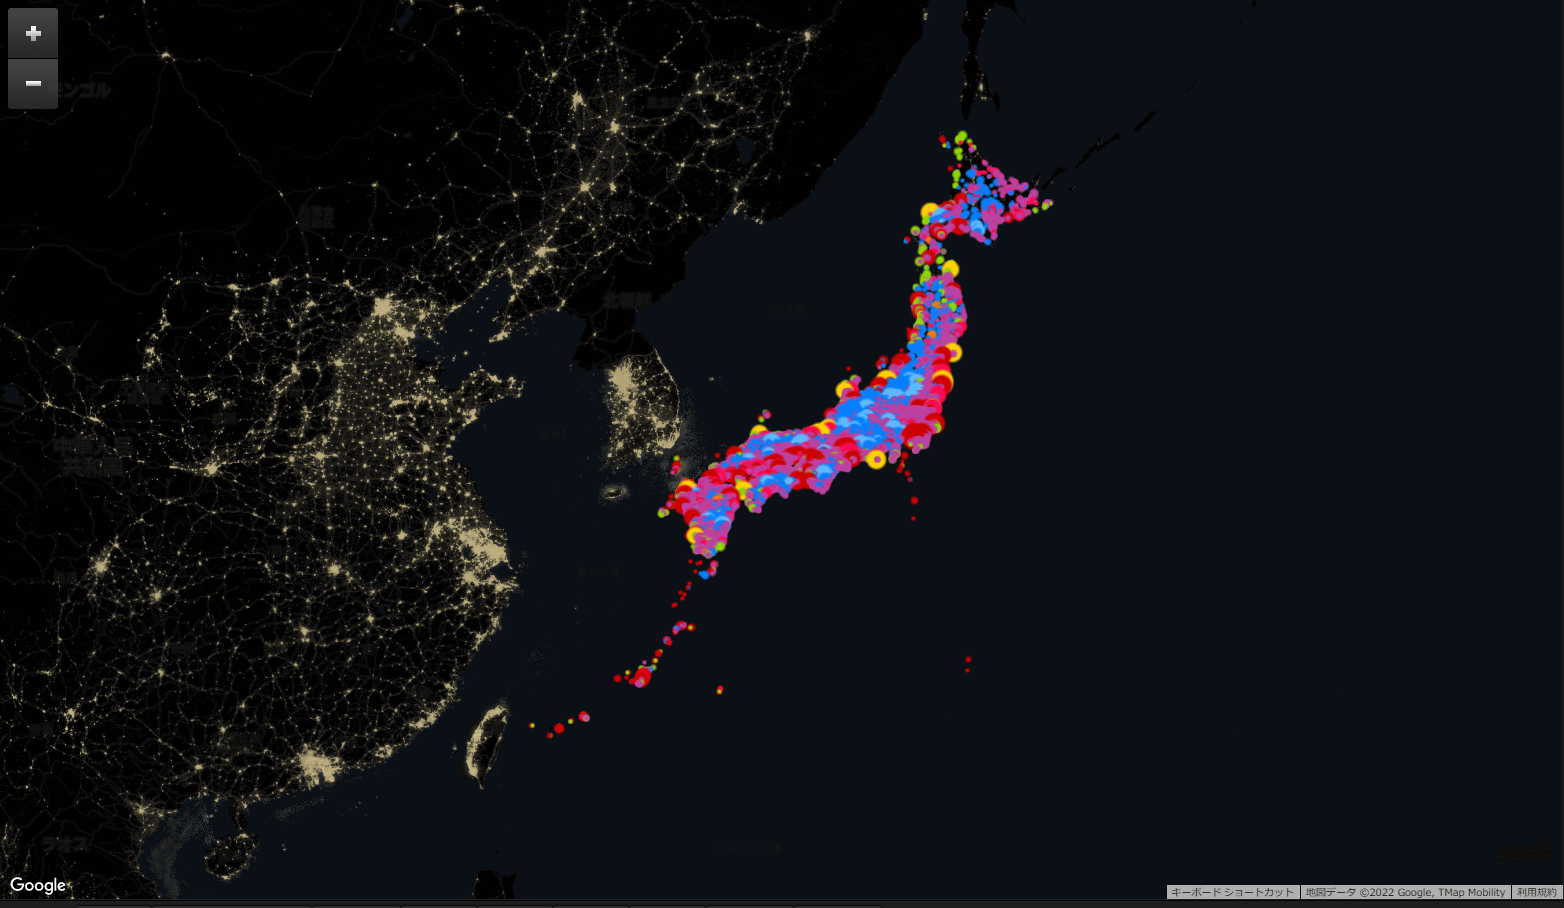
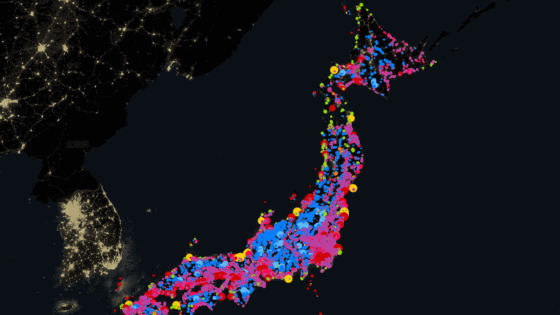
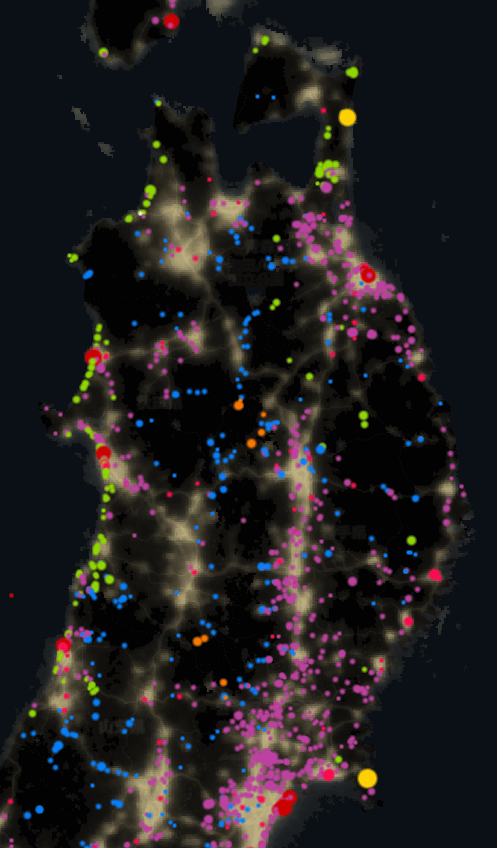
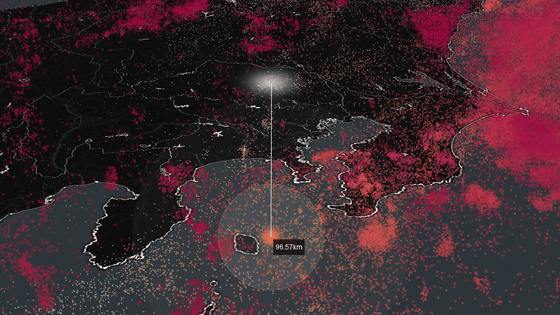
When you enlarge the map, it looks like this. The bright areas on the map are areas that emit light at night, and the circles are 'red: thermal power', 'pink: thermal power (biomass)', 'yellow: nuclear power', 'blue: hydraulic power', and 'light blue' for each color. : Pumping, 'Orange: Geothermal', 'Green: Wind', 'Purple: Sunlight', 'White: Composite type', and the size of the circle indicates the scale of the power plant. It can be seen that a large number of hydroelectric power plants are distributed in the mountainous areas of central Honshu, and many solar power plants are distributed in areas that emit light at night (populated areas).

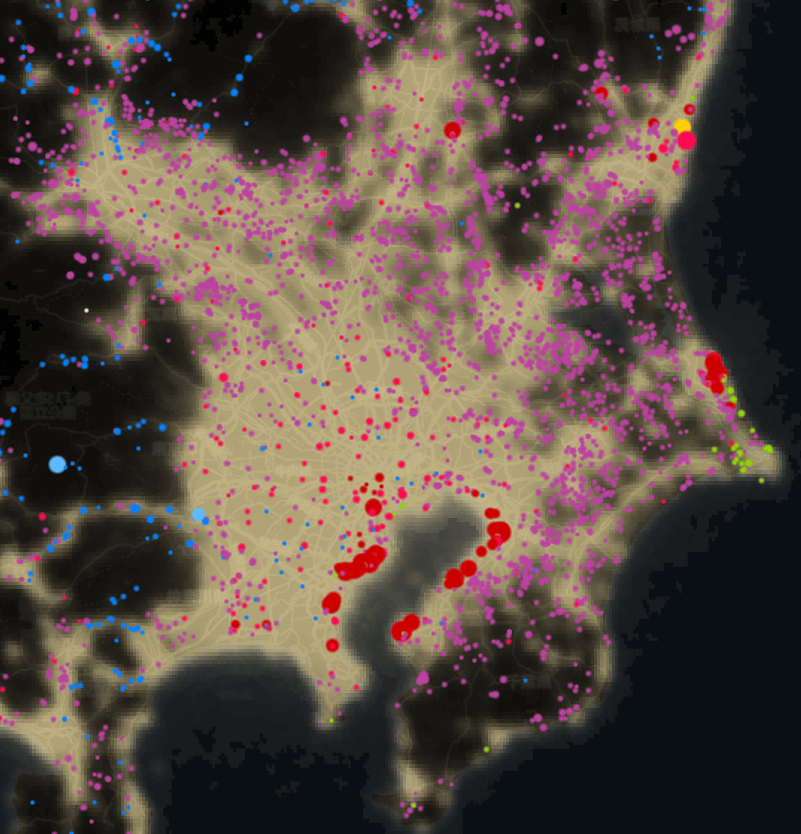
I tried to expand the area around Tokyo. Multiple large-scale thermal power plants are installed along the coast, and a large number of solar power plants are installed in populated areas.
There are many wind power plants in the coastal areas of the Tohoku region. Hydroelectric power plants and geothermal power plants are installed in the mountains.
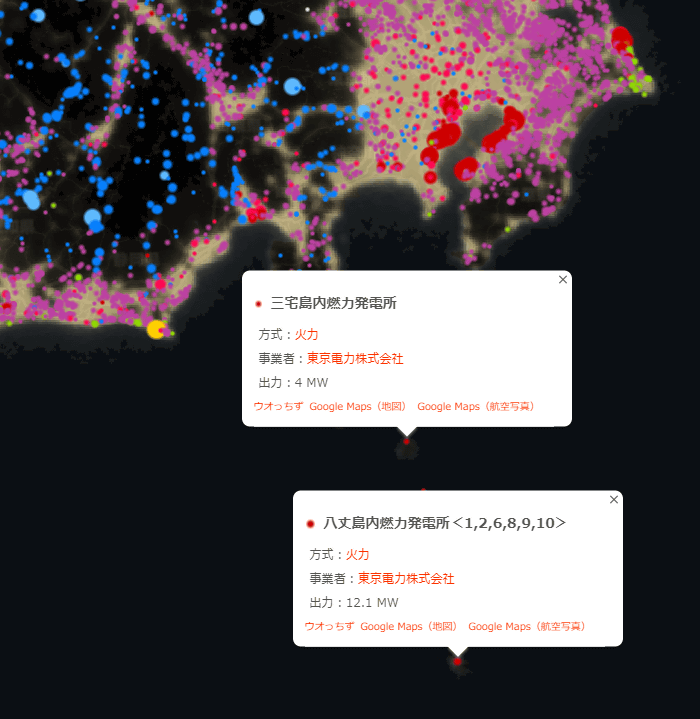
Click the circle to check the name of the power plant and the place of business. Thermal power plants managed by TEPCO were installed on Miyakejima and Hachijojima.
◆ 2: Check power plants by power company and power generation method
At Electrical Japan, you can check the distribution of power plants while narrowing down by electric power company or power generation method. To narrow down, access the link below.
Narrowing down the search for electric power companies and power generation methods | Electrical Japan --Japan's electric power problems from the viewpoint of power plant maps and night view maps
On the refined search page, you can switch the power plant management company and power generation method displayed on the map by checking / unchecking the check box on the right side of the screen. For example, if you display only the power plants managed by TEPCO, it looks like this.
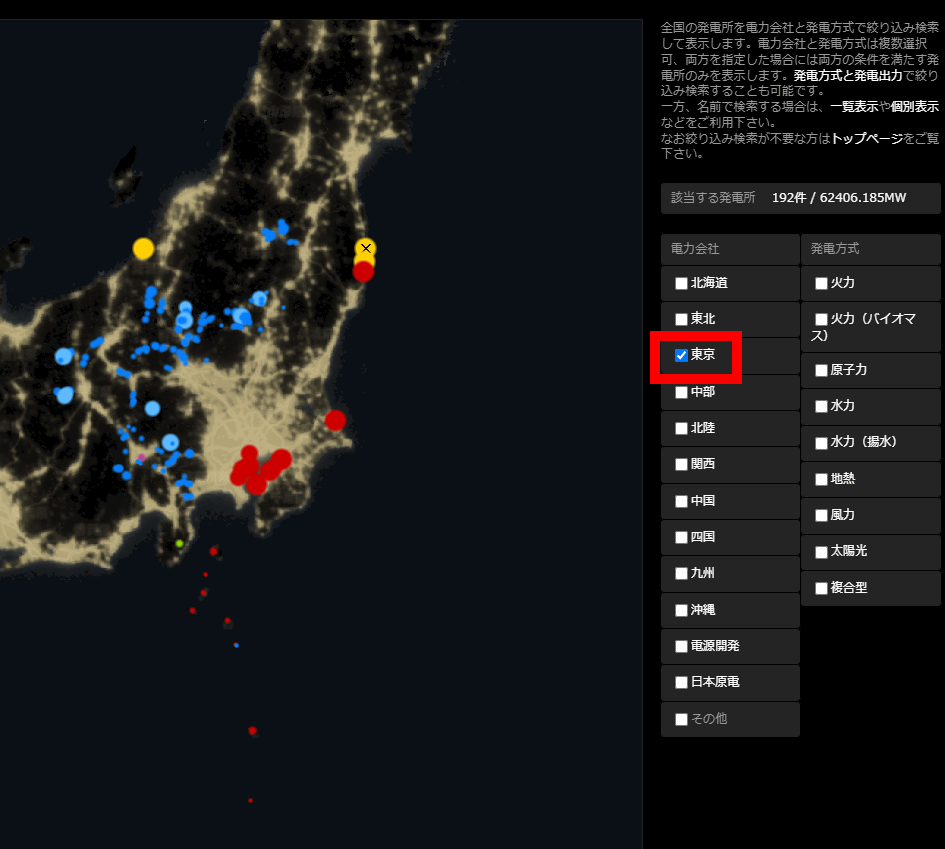
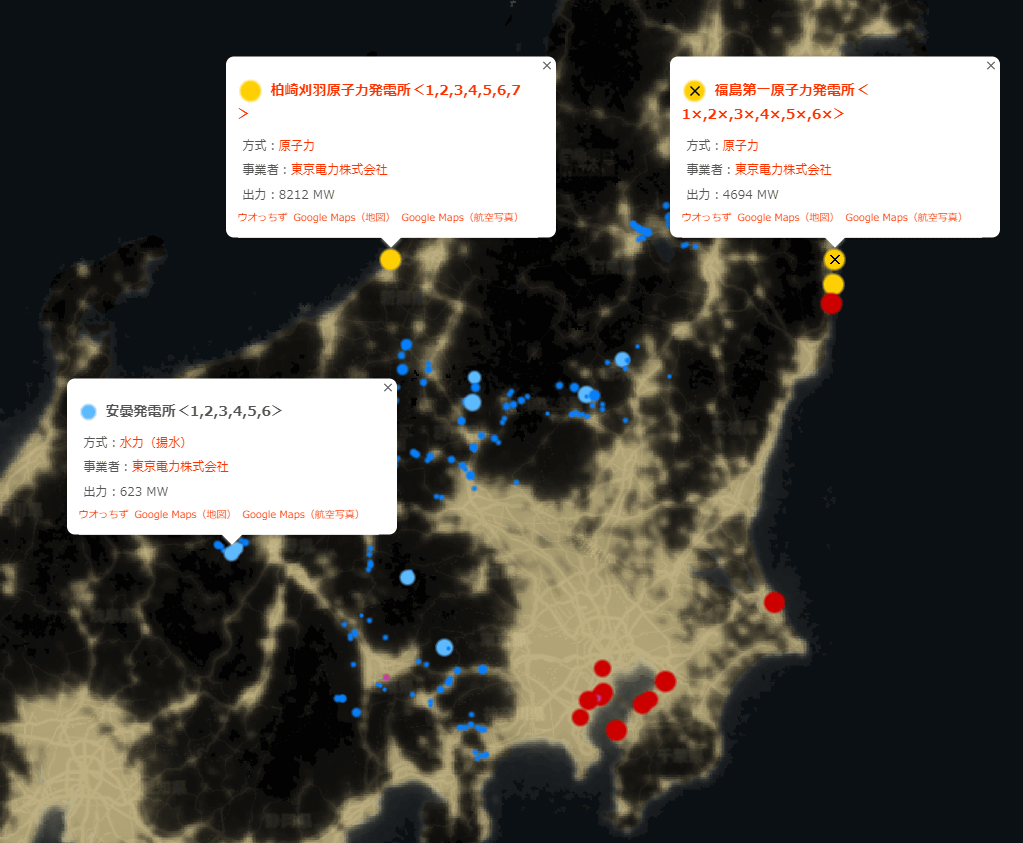
Other than 1 metropolitan area and 7 prefectures, such as 'Fukushima Daiichi Nuclear Power Station' installed in Fukushima Prefecture, 'Kashiwazaki Kariwa Nuclear Power Station' installed in Niigata Prefecture, and 'Azumi Power Station' installed in Nagano Prefecture. There are many power plants managed by TEPCO in these places as well.
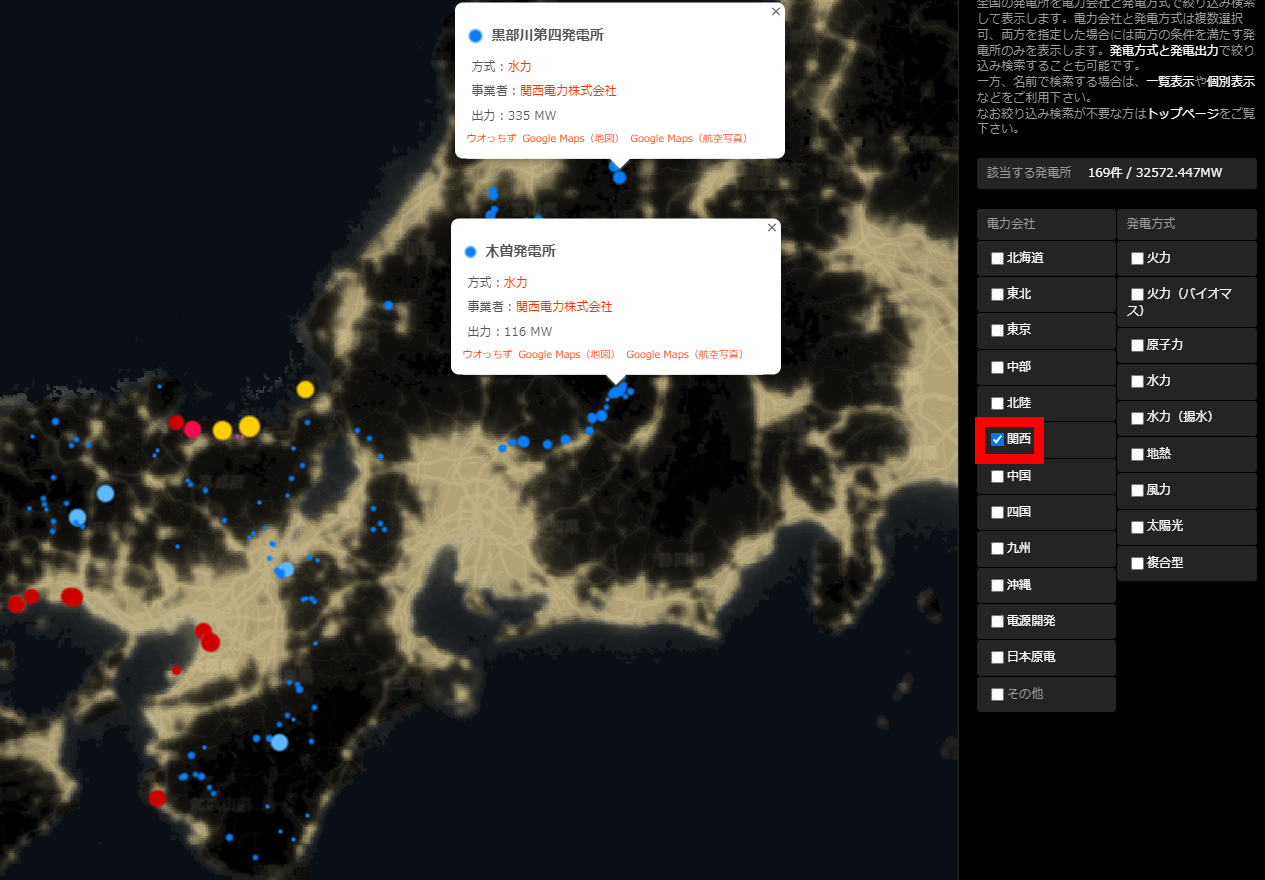
Next, I tried to display the power plants managed by Kansai Electric Power. Kansai Electric Power Co., Inc. has installed multiple power plants in locations away from the Kansai region, such as the 'Kurobegawa Daiyon Power Plant' in Toyama Prefecture and the 'Kiso Power Plant' in Nagano Prefecture.
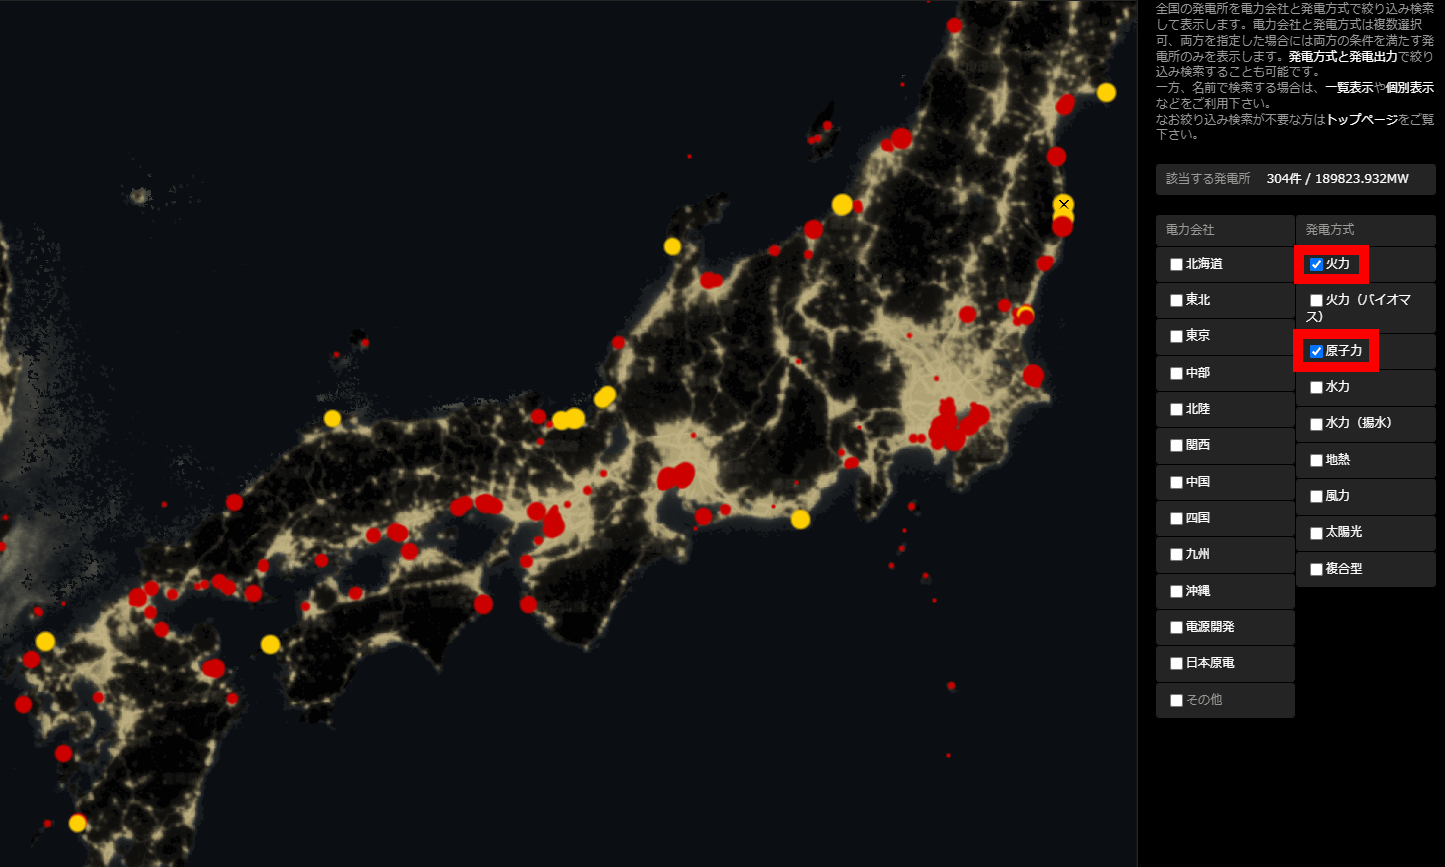
Looking at only thermal power plants and nuclear power plants, it looks like this. Both are concentrated in the coastal areas.
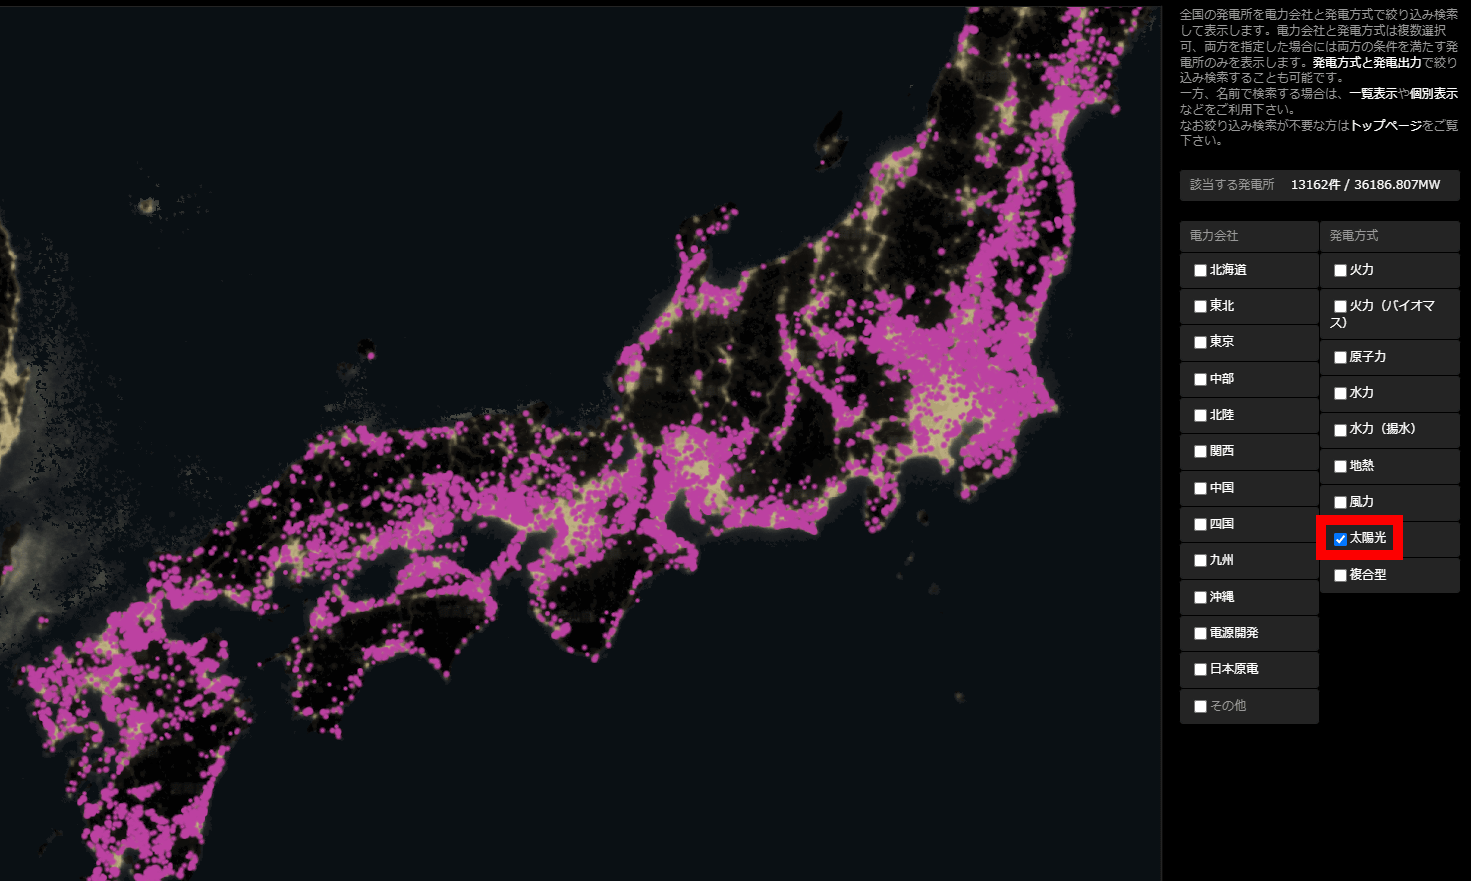
Solar power plants can be found anywhere in a busy area.
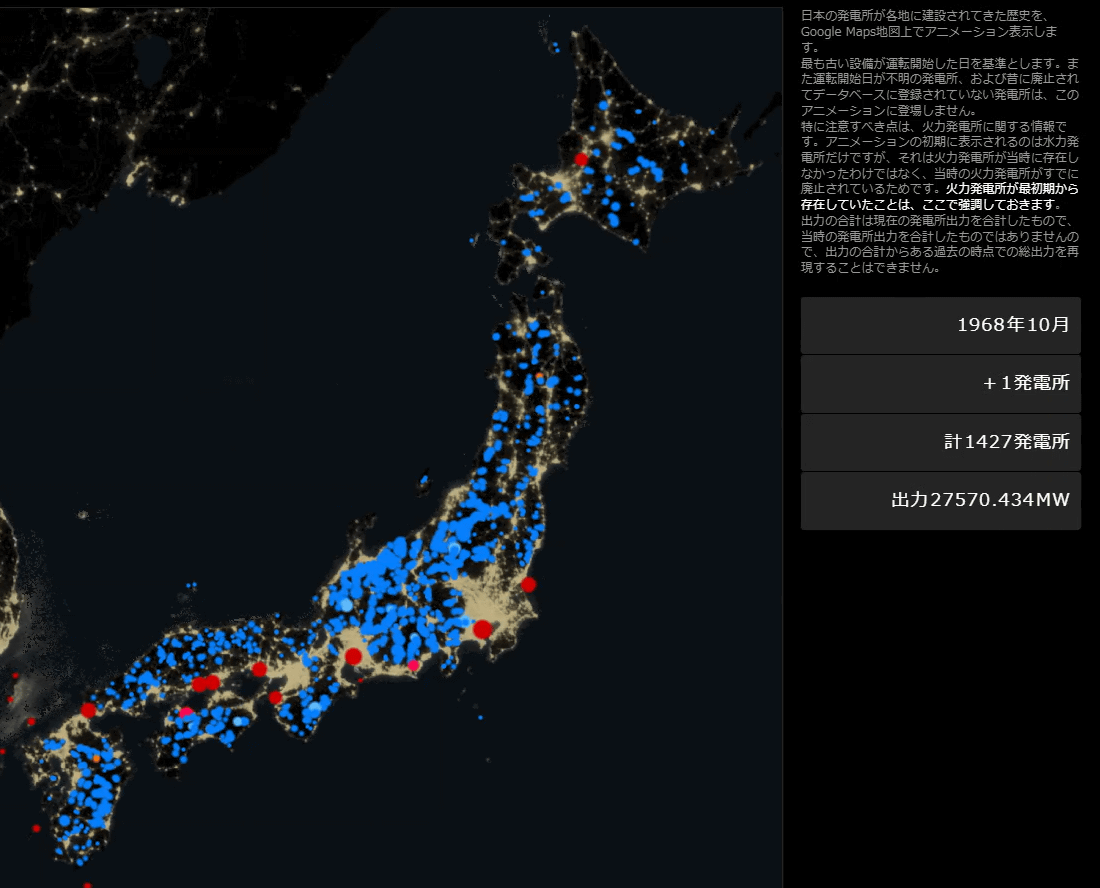
◆ 3: Check the history of power plant installation in Japan with animation
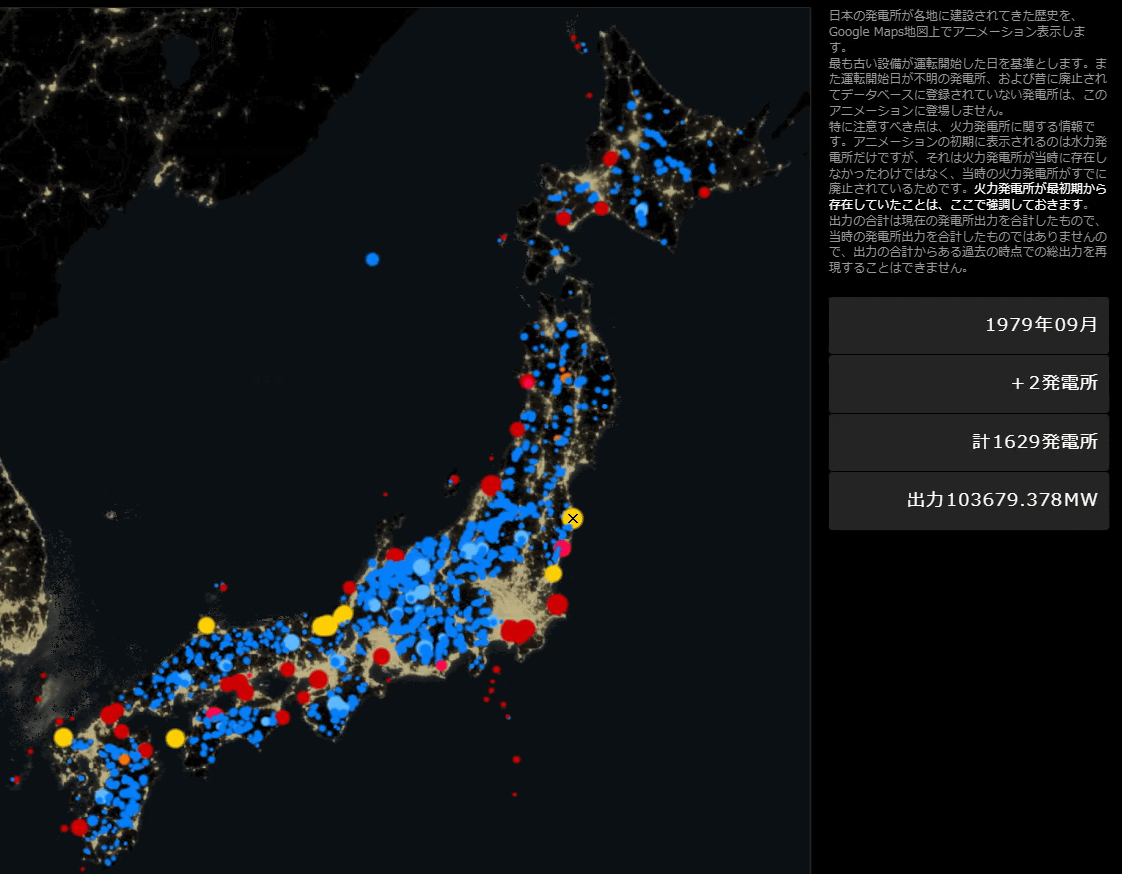
At the link below, you can check the location and type of power plants installed in Japan after 1893 with animation. In Japan, thermal power plants have been in operation since before 1893, but the animation shows only the power plants that are currently in operation.
History map animation of Japanese power plants | Electrical Japan --Japan's power problems from the viewpoint of power plant maps and night view maps
By 1950, about 900 hydroelectric power plants had started operating from Kyushu to Hokkaido.

In the 1960s, several large-scale thermal power plants went into operation ...
Nuclear power plants also started operating in the 1970s.
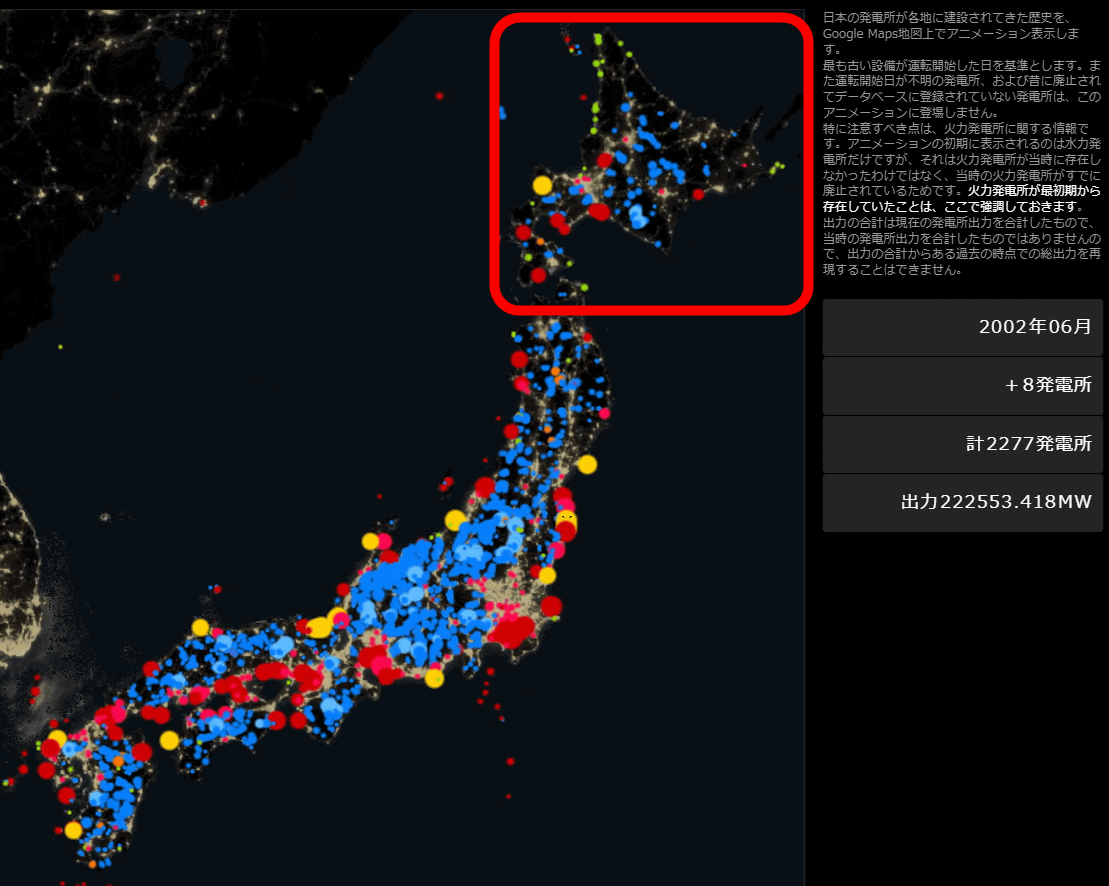
In the 2000s, multiple wind power plants began to operate in northern Hokkaido.
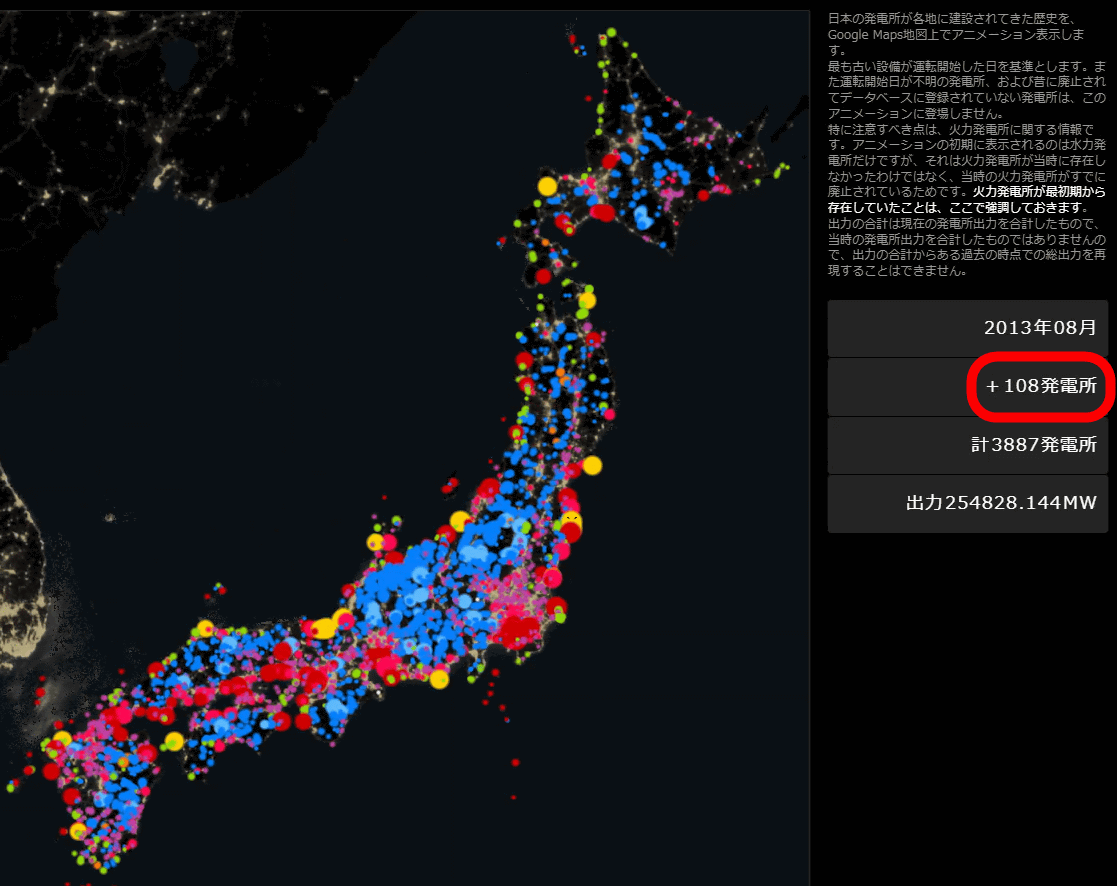
In the 2010s, a large number of solar power plants started operation every month. During this period, about 100 new power plants are in operation each month.
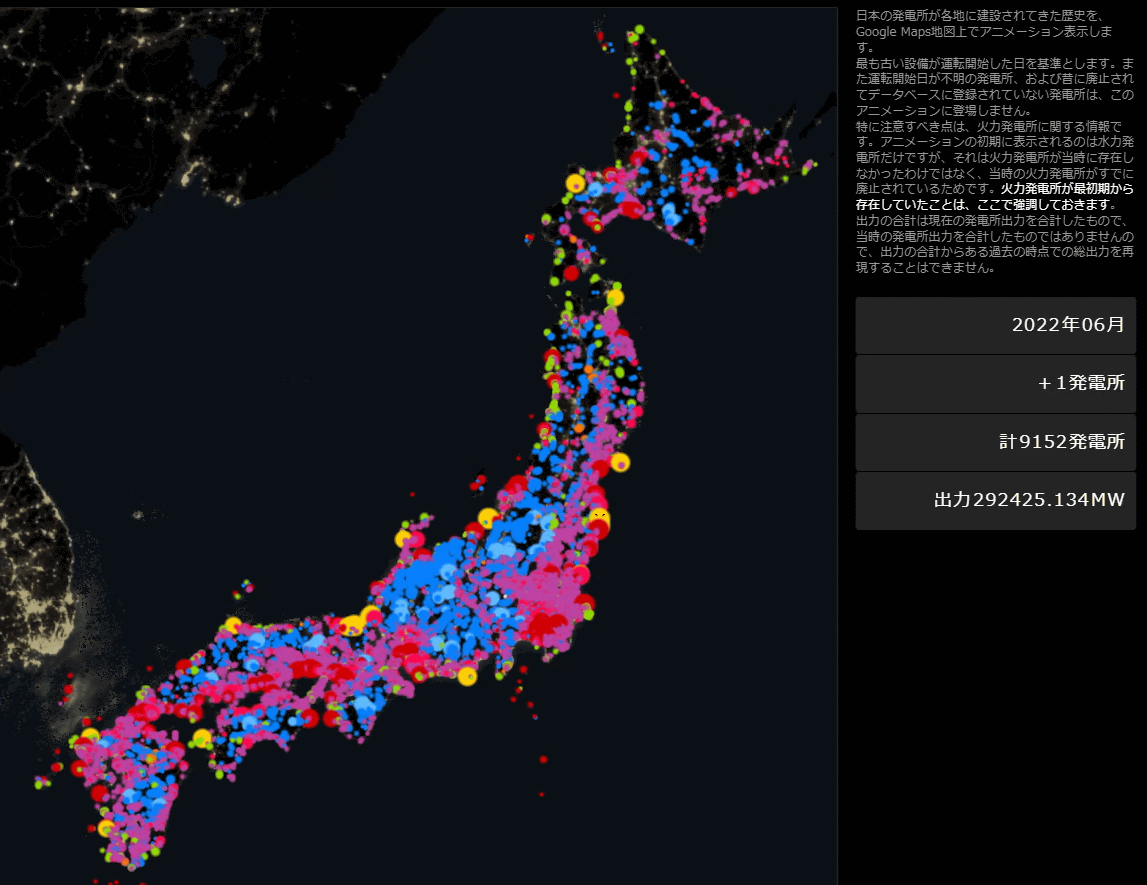
And the situation in June 2022 is as follows. The number of solar power plants is increasing considerably.
In addition, the following pages summarize the information sources and precautions used when creating the animation.
About the history of Japanese power plants | Electrical Japan ―― Japan's power problems from the viewpoint of power plant maps and night view maps
◆ 4: Check the power supply and demand performance graph of each power company
Electrical Japan also publishes a graph that summarizes the daily electricity supply and demand results.
Electric power company / electric power supply / demand performance graph (nuclear power / thermal power / hydropower / geothermal / biomass / solar / wind power / pumping / interconnection line) | Electrical Japan --- Japan's electric power problem from the viewpoint of power plant map and night view map
http://agora.ex.nii.ac.jp/earthquake/201103-eastjapan/energy/electrical-japan/source/
When you access the page of the power supply and demand performance graph, the performance of each power company is displayed in a row. This time I clicked on TEPCO.
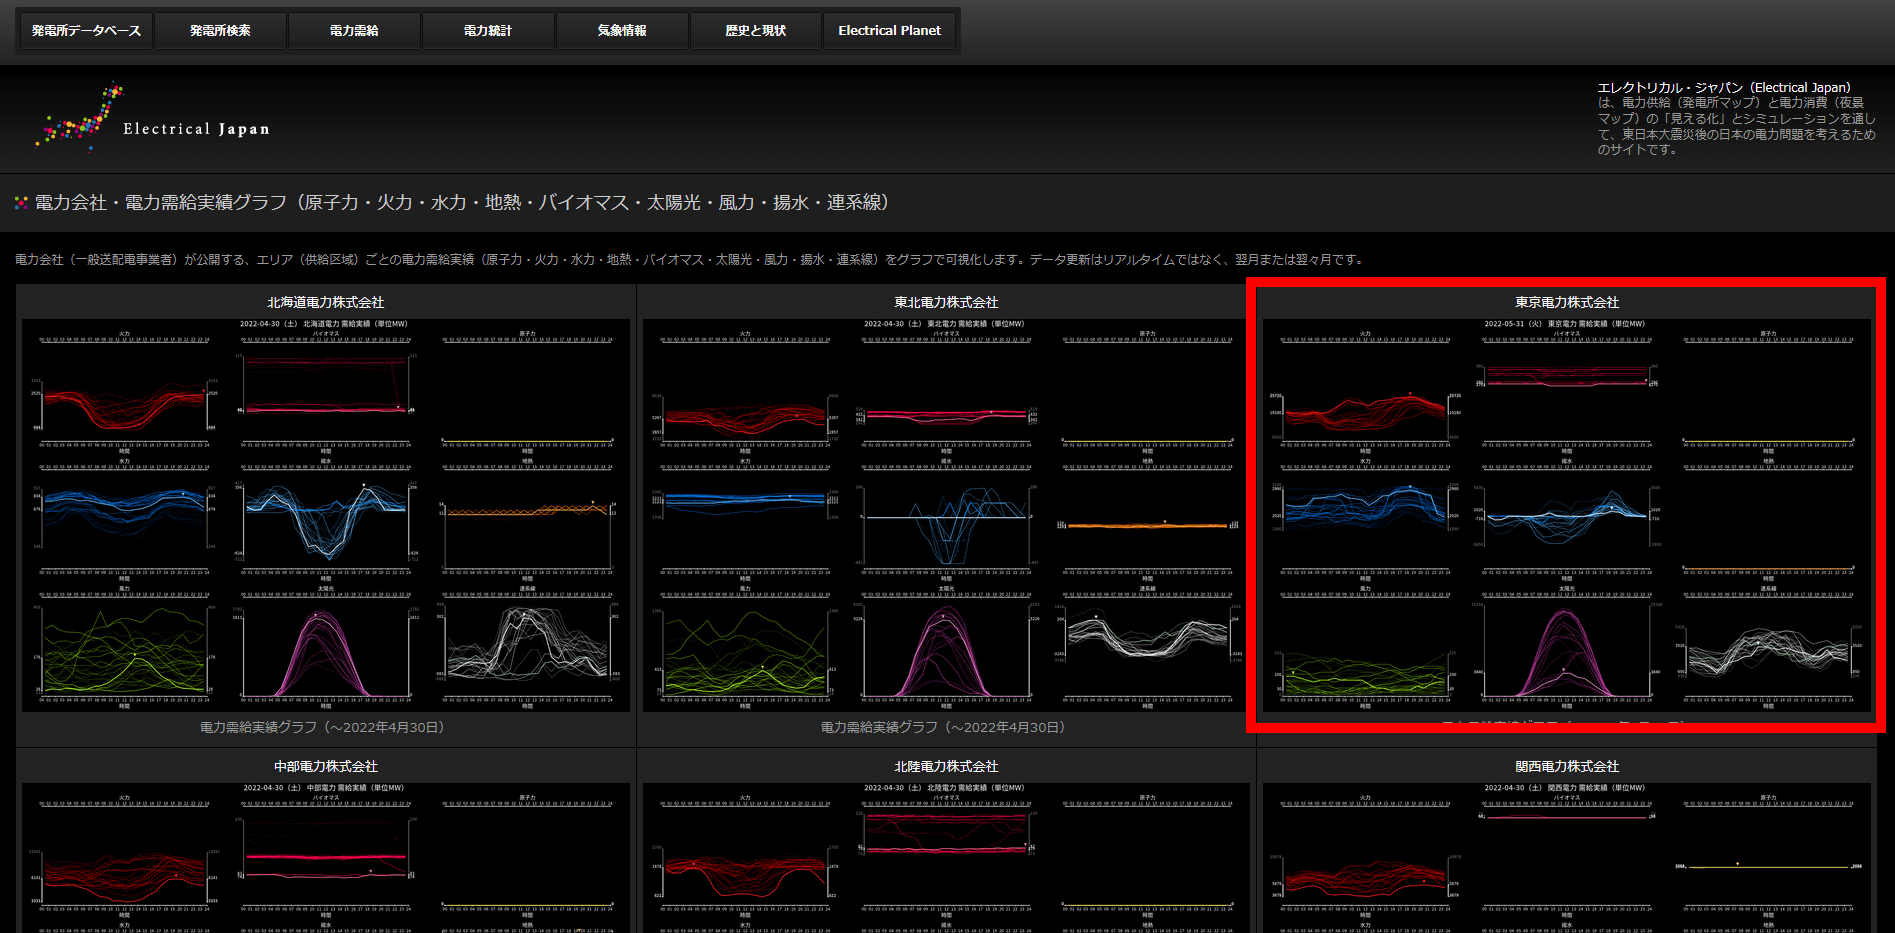
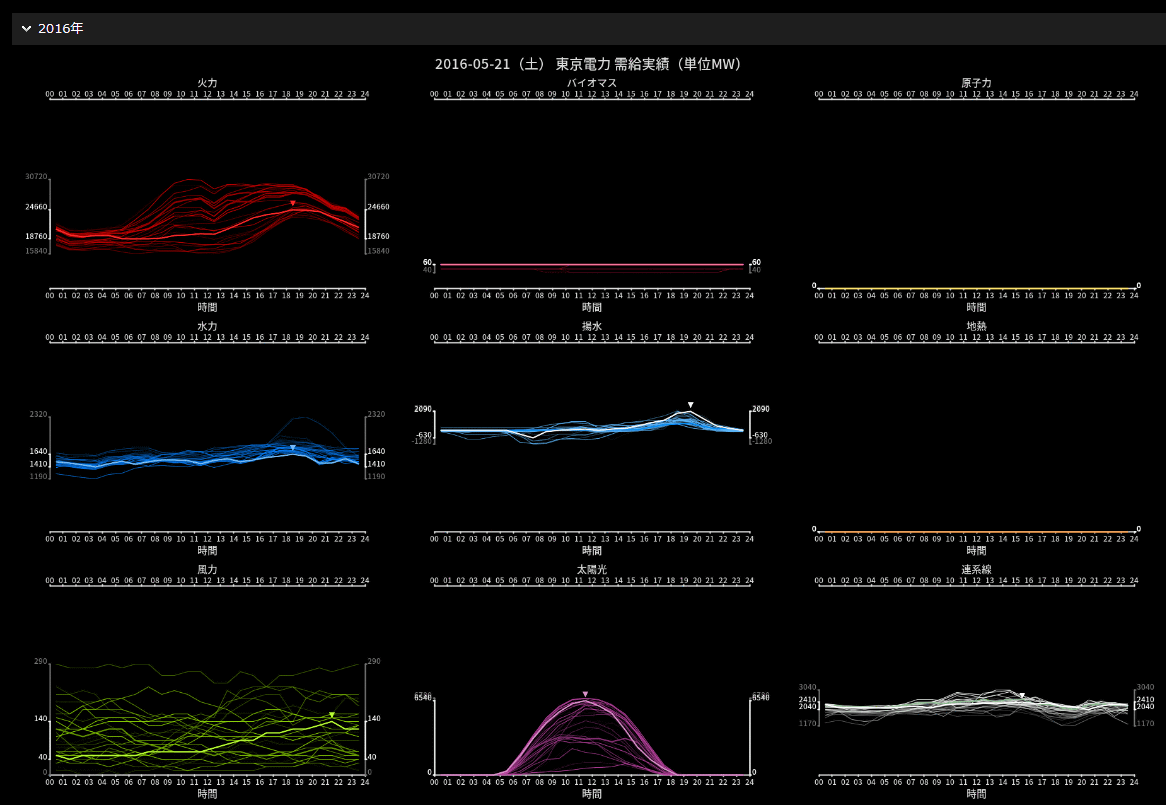
Then, the supply and demand results of TEPCO's thermal power, biomass, nuclear power, hydropower, pumping, geothermal, wind power, solar power, and

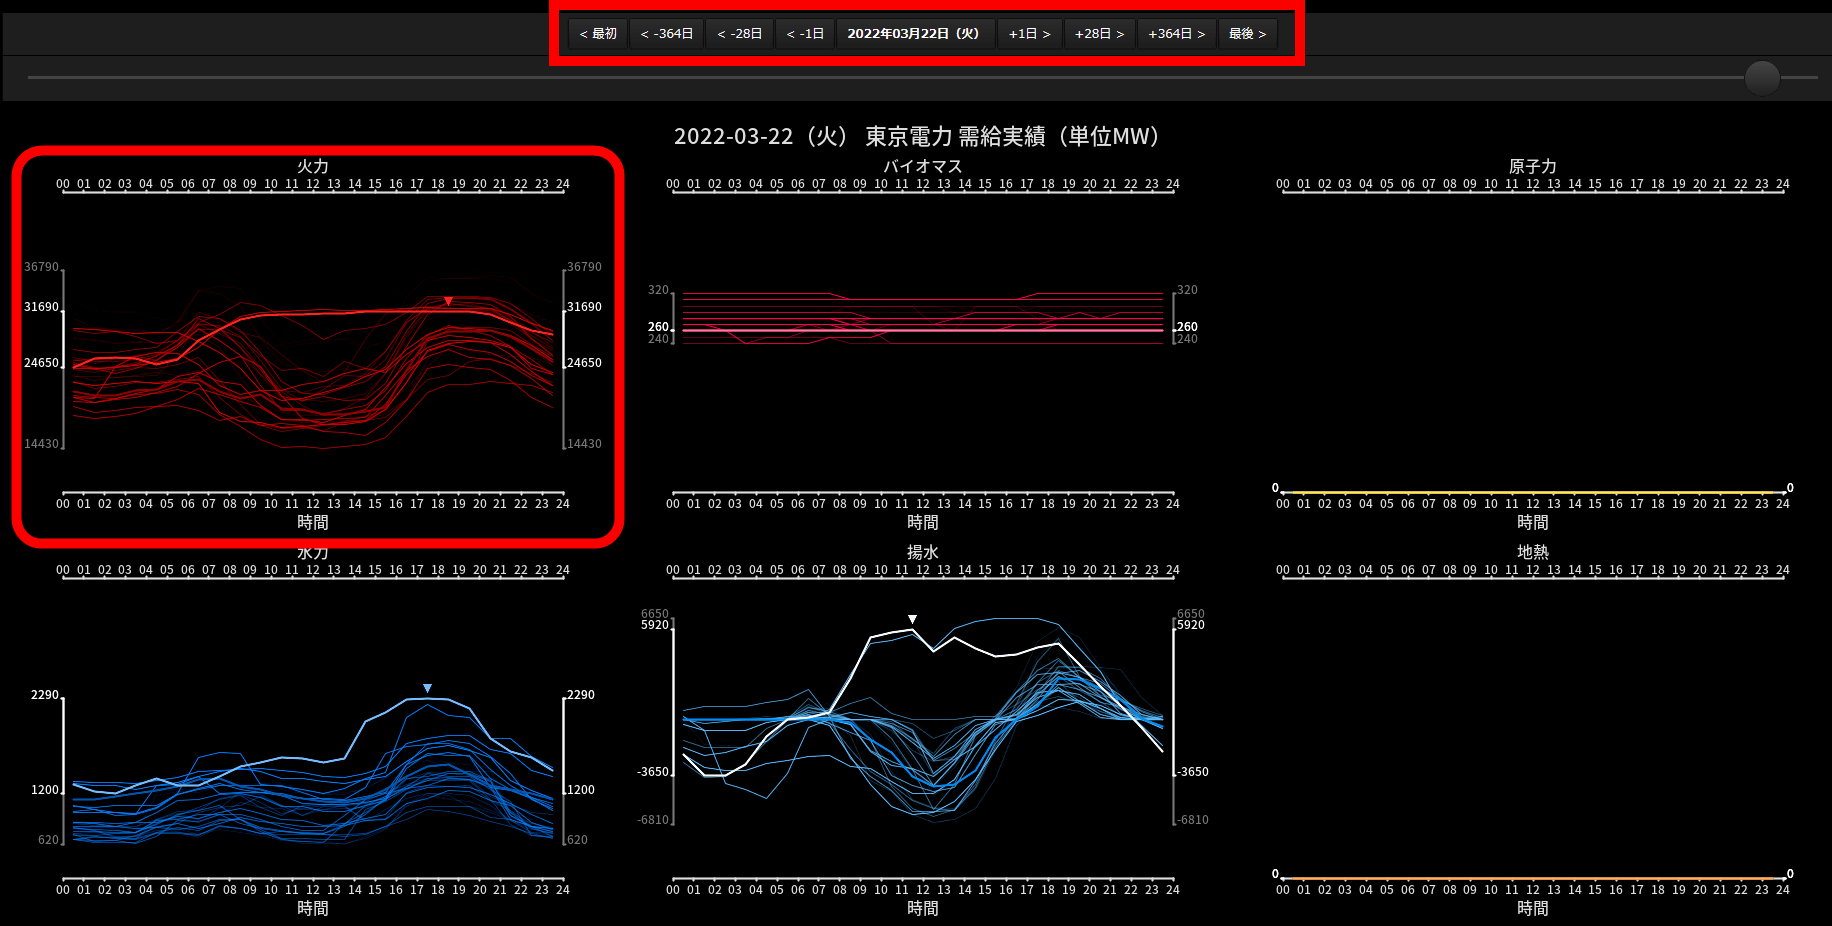
By clicking the button at the top of the screen, you can check the supply and demand results for different dates. For example, when checking the supply and demand results on March 22, 2022, when a tight supply and demand warning was announced within the jurisdiction of TEPCO, it was found that power generation was continued day and night at a thermal power plant where the amount of power generation normally decreases during the day. I understand.
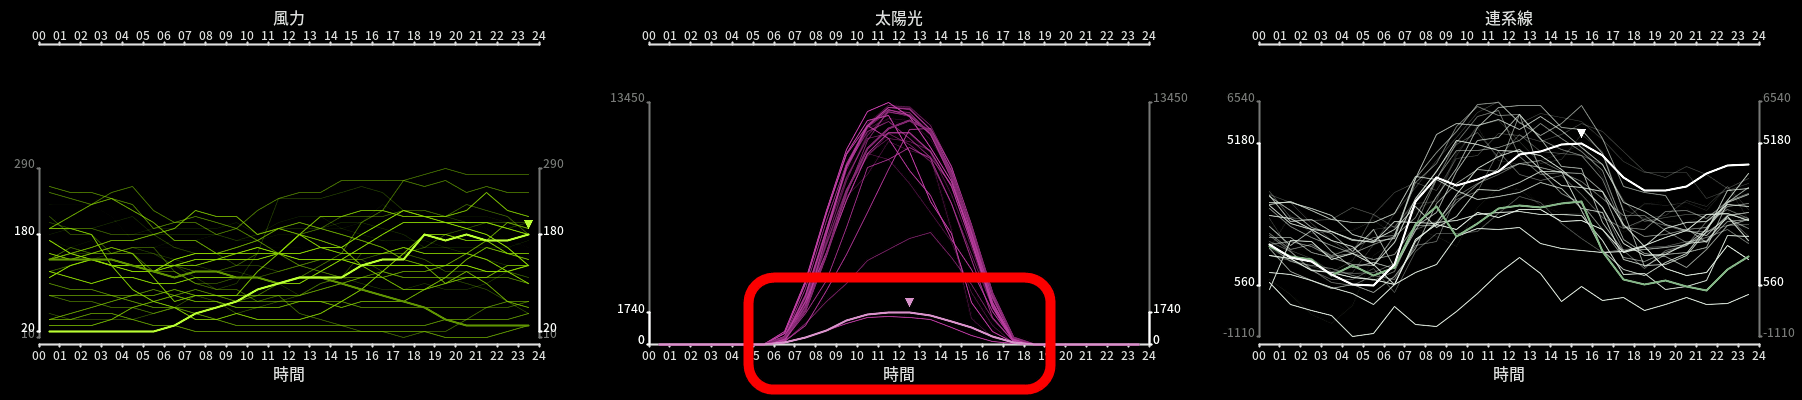
Also, it seems that the amount of power generated at the solar power plant was quite small on this day due to the influence of the weather.
At the bottom of the screen, you can check the annual supply and demand results with animation. If you try clicking on the part marked '2016' ...
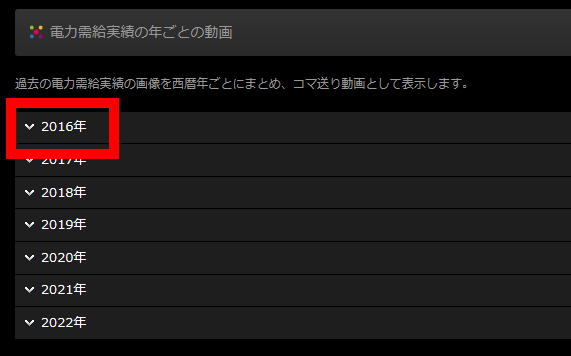
The supply and demand performance graph from the beginning of 2022 to the end of the year is displayed in order. If you look at the animation, you can clearly see the changes in the amount of solar power generated each season.
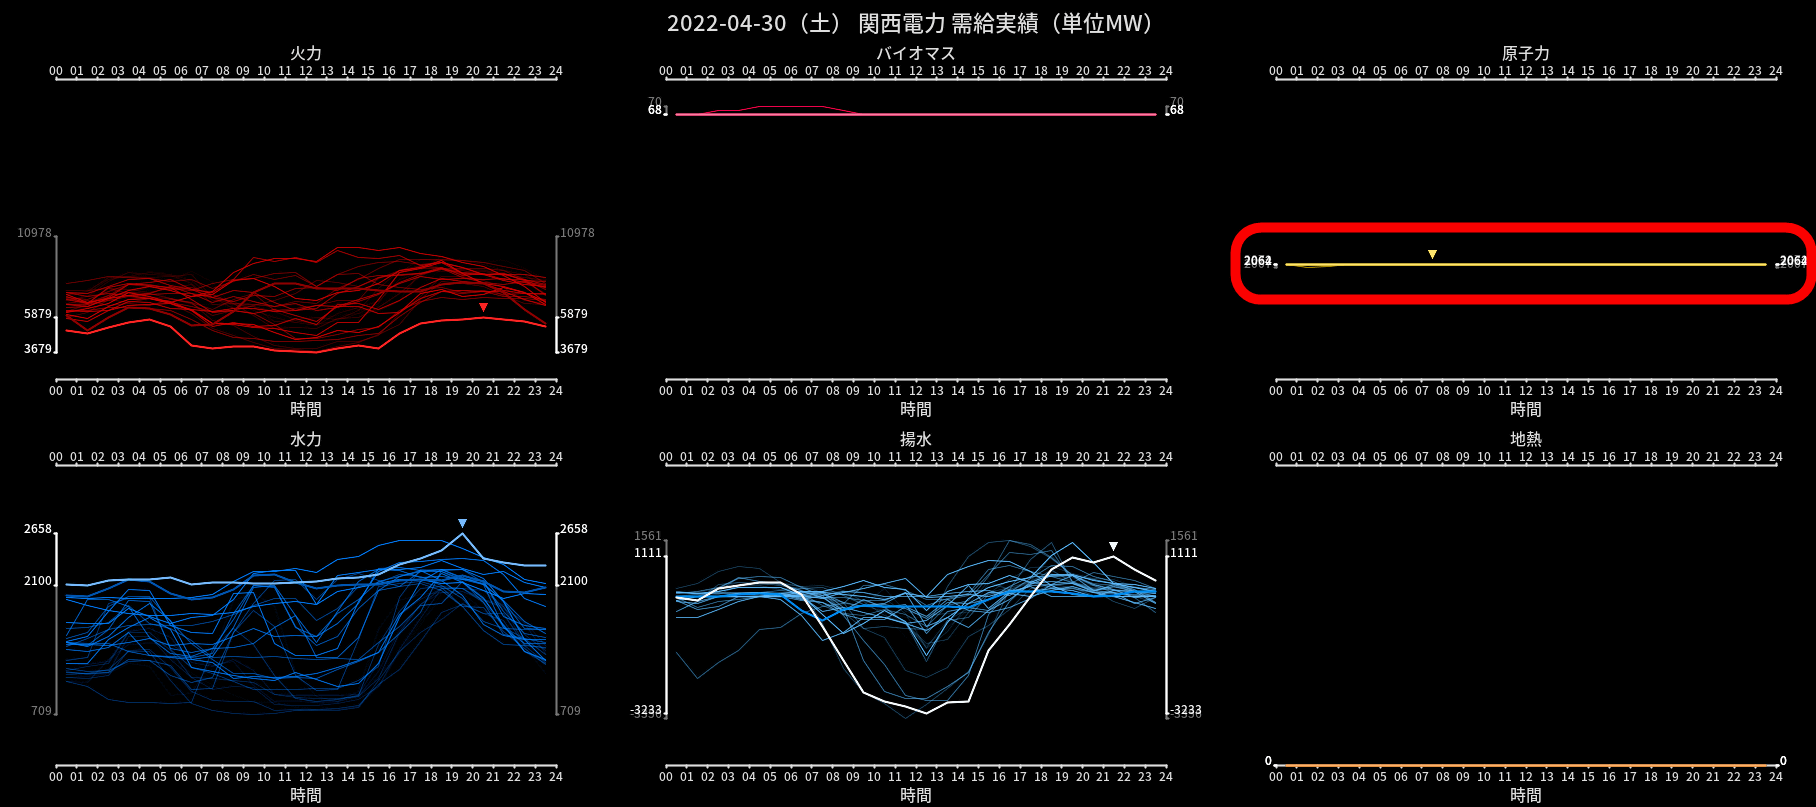
The graph of supply and demand of Kansai Electric Power Co., Inc. as of April 30, 2022 is as follows. There are multiple nuclear power plants operating within the Kansai Electric Power jurisdiction. The characteristic graph of the supply and demand performance of nuclear power plants is that they are in a straight line.
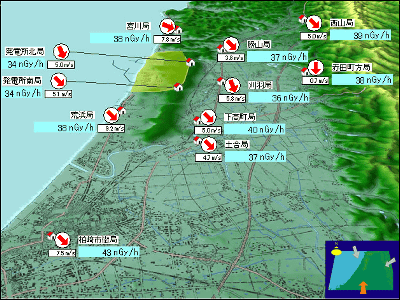
At Electrical Japan, you can find a lot of other information such as aerial photo collections of mega solar and weather information related to electric power . In addition, the following page summarizes the details of the creation process and information used for the creation of Electrical Japan.
What is Electrical Japan? | Electrical Japan-Japan's power problems from the perspective of power plant maps and night view maps
http://agora.ex.nii.ac.jp/earthquake/201103-eastjapan/energy/electrical-japan/policy.html.ja
About the power plant database | Electrical Japan --Japan's electricity problems from the power plant map and night view map
http://agora.ex.nii.ac.jp/earthquake/201103-eastjapan/energy/electrical-japan/data.html.ja
Related Posts:


in Web Service, Review, Posted by log1o_hf