Graph showing the current power usage status of each of the nine electric power companies at a glance
ByBlatantWorld.com
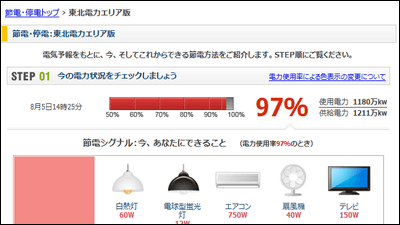
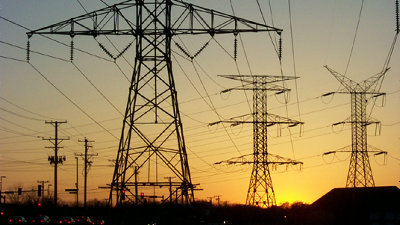
After the Great East Japan Earthquake, the power supply of each place was damaged, etc., and the supply of electricity was dropped, and in August 2011Electricity usage in the Tohoku Electric Power area reaches 97% at the maximumI did something. Because there was an accident at TEPCO Fukushima Daiichi Nuclear Power Plant, it was not OK to restart the nuclear power plant that had been stopped due to inspection,Notice of planned blackout as an emergency preparedness "has been sent from Kansai ElectricAlthough it was, it was Oii nuclear power plant Unit 3 on July 9, on July 25Oimachi nuclear power plant 4 started full operationAnd the situation is improving.
Nevertheless, I am anxious about whether there is no problem with the amount of power supply now. There were sites that compiled this for nine companies in a comprehensible manner.
Usage status of electric power companies
http://nocchi99.singsong.jp/denryoku/
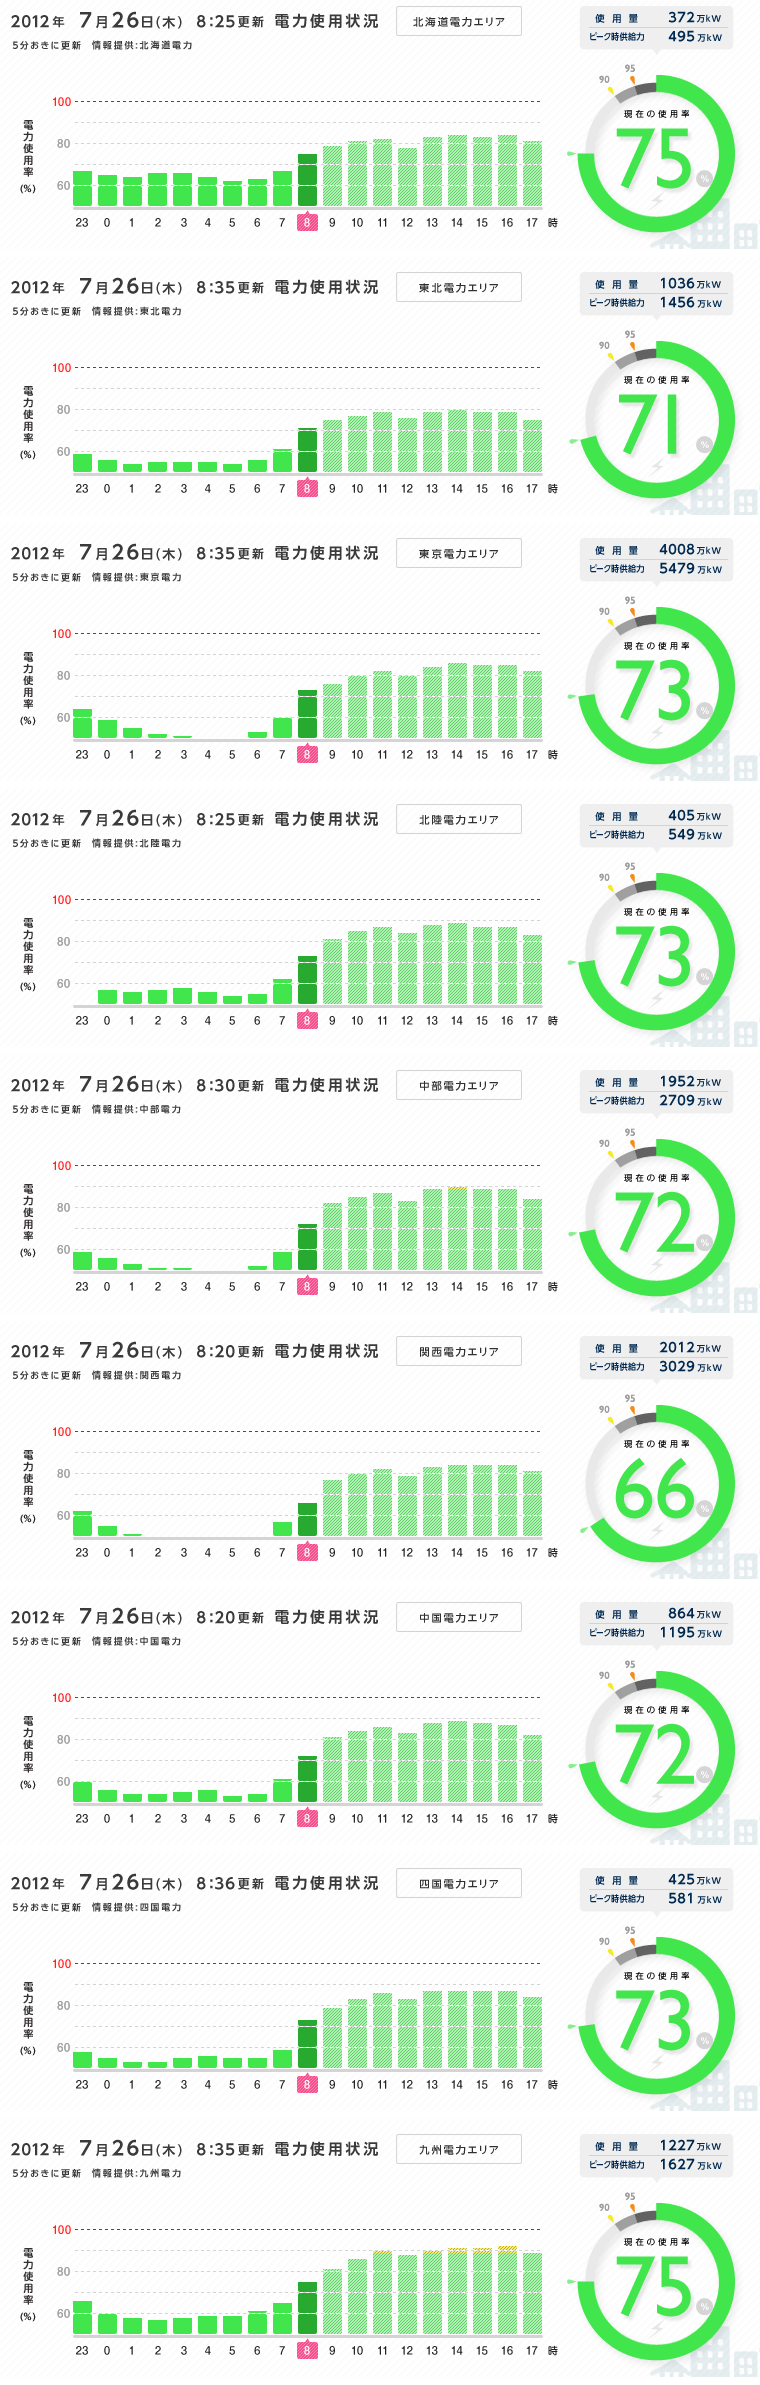
In the site, the power usage rate, usage amount and peak supply power of that day for the total of nine companies including Hokkaido Electric Power, Tohoku Electric Power, Tokyo Electric Power Company, Hokuriku Electric Power Company, Chubu Electric Power Company, Kansai Electric Power Company, Chugoku Electric Power Company, Shikoku Electric Power Company and Kyushu Electric Power Co., . This is an example in the morning, the data is updated every 5 minutes.
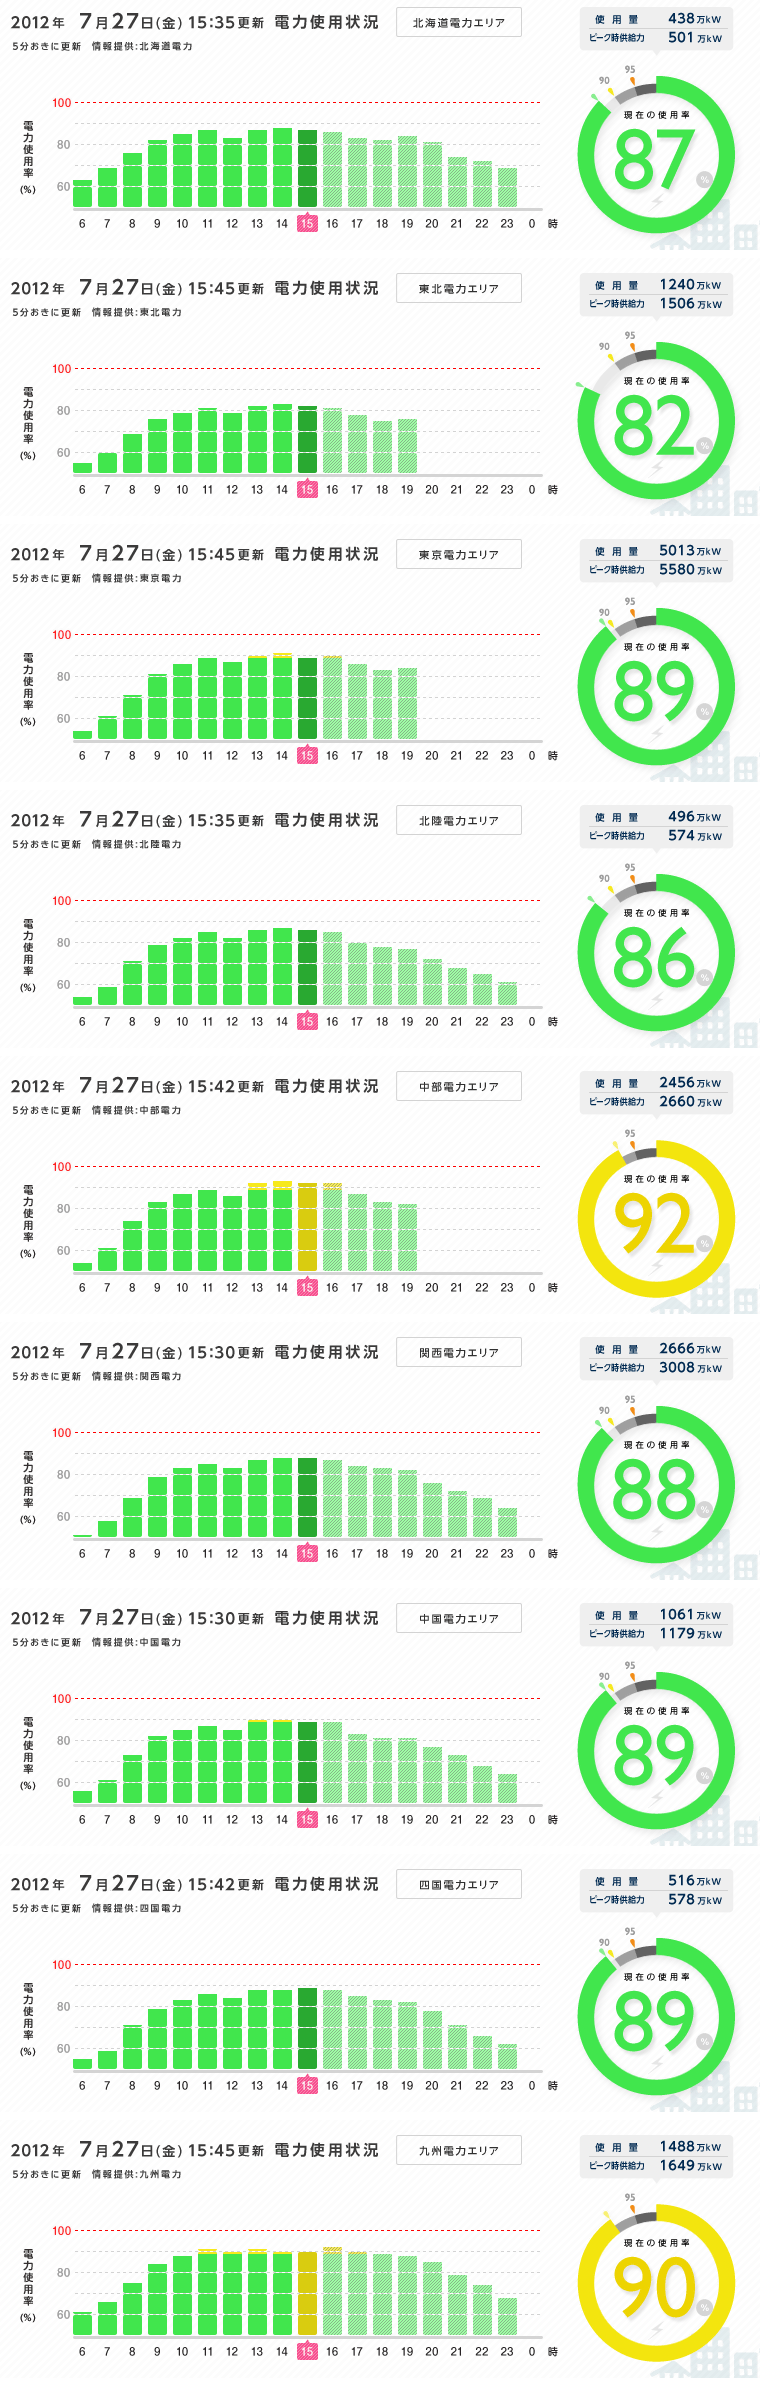
This is evening. When it exceeds 90%, it turns yellow and you can see that it is a bit pinch. When it exceeds 95% it seems to be orange, but I do not want to see ... ....
Related Posts:


in Note, Posted by logc_nt