Review of 'Flood Maps,' a map that shows at a glance where areas will be submerged if sea levels rise due to global warming; what will Japan's coastline look like in the future?

Recent research has shown that the severity of sea level rise caused by global warming is
Flood Maps
http://flood.firetree.net/
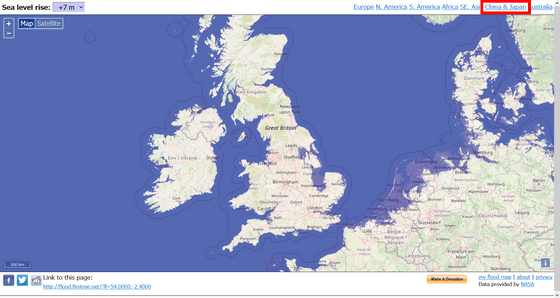
When you access the above URL, it looks like this. You can move the map by dragging up, down, left and right, and you can jump to Japan in one shot by clicking 'China & Japan' in the upper right.
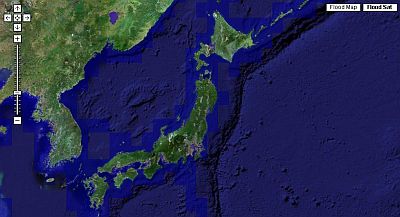
This is what Japan
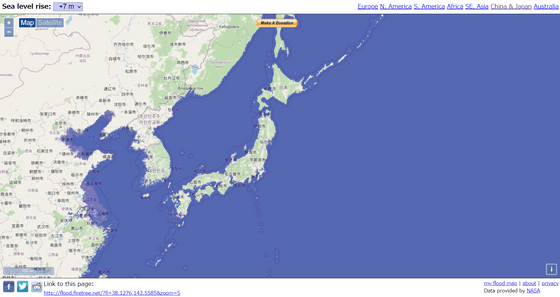
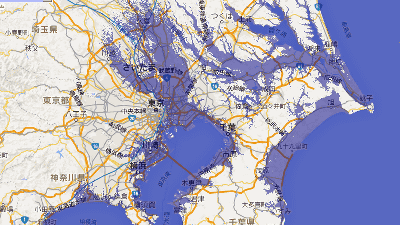
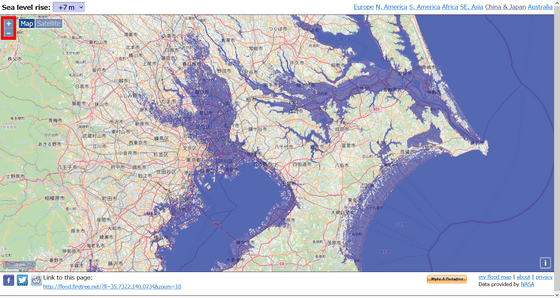
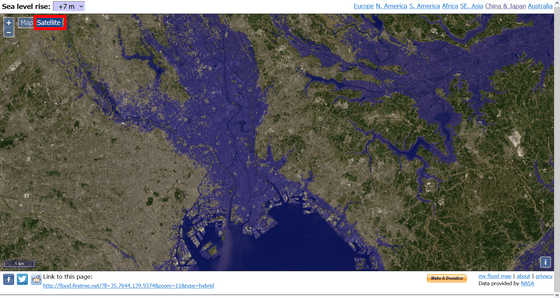
You can zoom in and out by clicking the button in the red frame in the upper left, using the wheel on a PC, or pinching in and out on a smartphone. If you zoom in on Tokyo as an example, you can see that a large area of the metropolitan area is submerged.
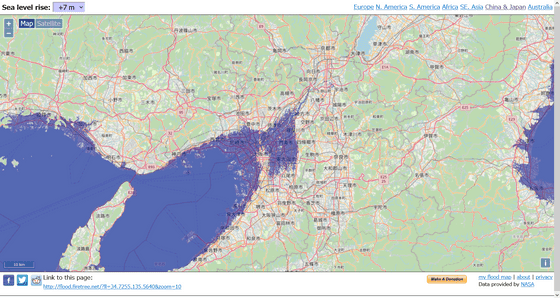
Osaka, Japan's second largest city, looks like this. In addition to the coastal areas of Osaka Bay, the eastern part of Osaka City is submerged.
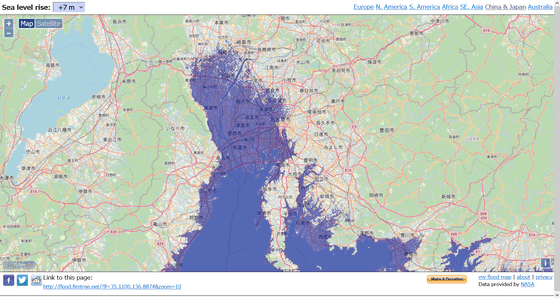
Even in the Chubu region, which includes Aichi Prefecture, the home base of Japan's largest company, Toyota, the sea has extended all the way to Gifu Prefecture, which is supposed to be an inland prefecture.
Click 'Satellite' in the upper left corner to switch the map to a satellite view.
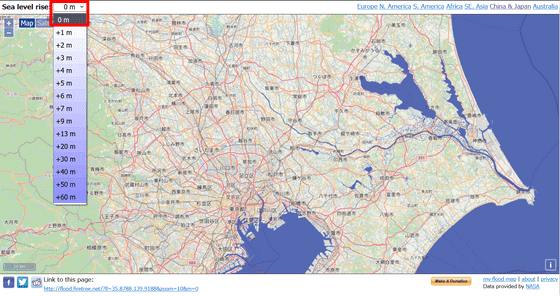
You can change the height of the rising sea level from the tab in the upper left. Selecting '0m' will result in a familiar map with no submerged coastal areas.
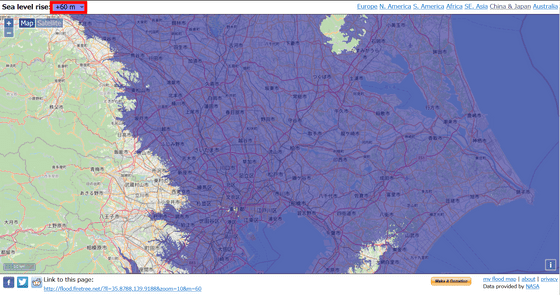
This is a rather extreme scenario, but if the maximum of 60m was reached, the metropolitan area would be almost completely submerged at the bottom of the sea.
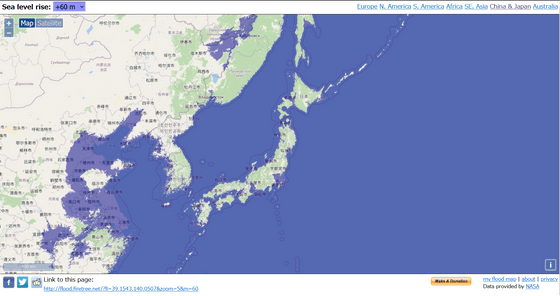
The shape of the Japanese archipelago had also changed significantly.
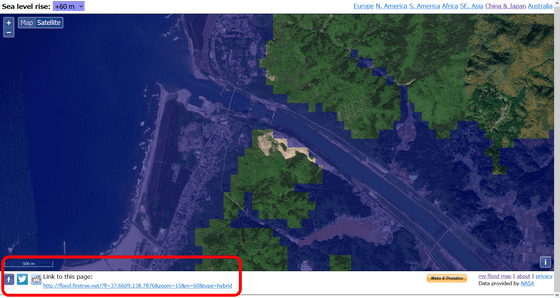
You can share the range you are viewing and the sea level settings using the URL in the bottom left, and you can also post to Facebook, Twitter, and Reddit using the icons for each SNS.
According to creator Alex Tingle, the map was created based on a total of 50GB of data provided by NASA. The NASA data has some errors, and does not take into account coastal erosion or defense measures by cities facing the sea, so it is not guaranteed that this will happen in the future, but Tingle commented, 'I'm interested in warning people about the consequences of ongoing global warming.'
Related Posts:
in Review, Web Service, Science, , Posted by log1l_ks
