'Global Sea Level Rise Map' that shows where the sea level rises due to global warming
Global Sea Level Rise Map --Global Warming & Climate Change Impact
http://geology.com/sea-level-rise/
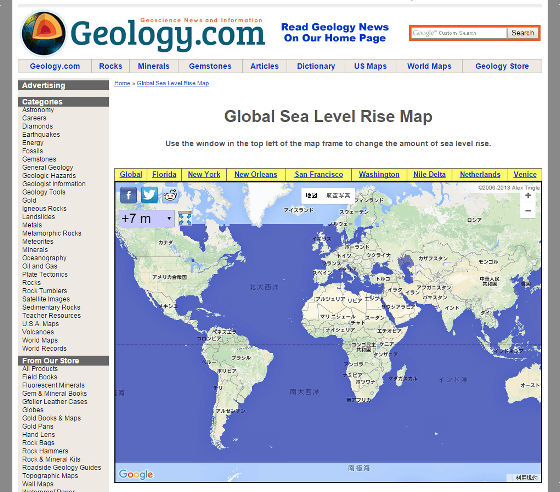
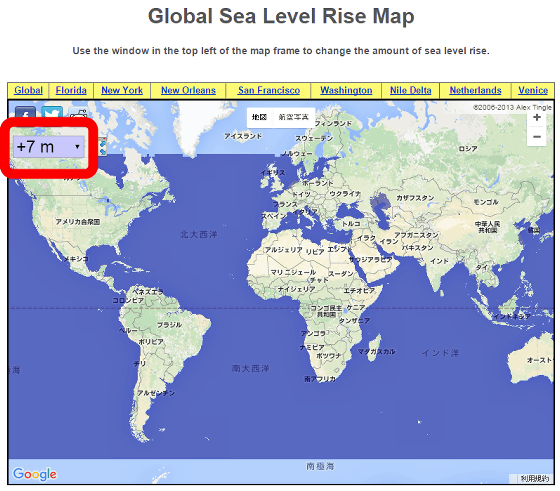
Global Sea Level Rise Map is a web application based on Google Maps, and its usage is the same as Google Maps except that there is a pull-down menu at the top left of the screen to change the sea level rise value.
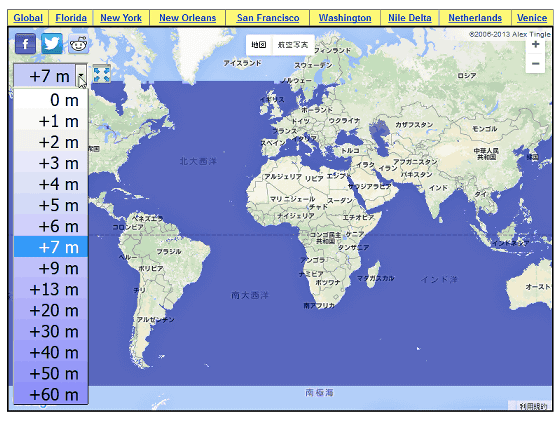
The sea level rise value can be selected from '+ 1m' to '+ 60m'.
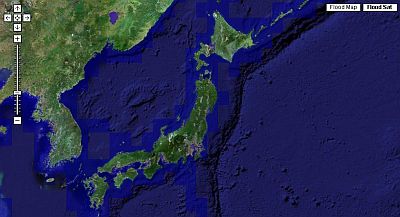
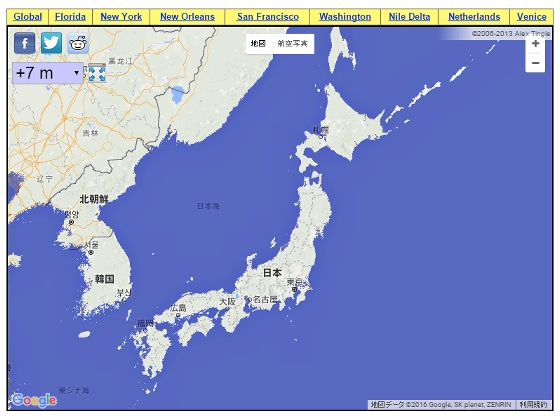
Of course, it is also possible to move the map and enlarge / reduce it. Japan looks like this when the water level rises 7m. It looks like it hasn't changed that much, but ...
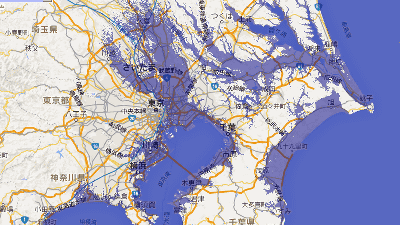
The Kanto region looks like this. The inland sea is intricate in Chiba prefecture, and the sea is eroding from the bay of Tokyo to Saitama prefecture.

Let's expand Tokyo. At '+ 3m', Adachi Ward and the Gulf area are about to disappear.

'+ 5m'

At '+ 9m', you can see that Adachi-ku, Koto-ku, Katsushika-ku in Tokyo, Urayasu-shi, Ichikawa-shi in Chiba prefecture, Kawaguchi-shi, Soka-shi, Yashio-shi, Misato-shi in Saitama prefecture will be in a catastrophic situation. ..


At '+ 5m', it becomes a light in front of the wind ...

It seems that it will almost disappear at '+ 13m'.

If the sea level rises by 13m, all three major metropolitan areas centered on Osaka, Nagoya, and Tokyo are likely to be devastated.

In addition, Shanghai, China also sank at '+ 13m'.

Most of the land is lost in the Netherlands and Denmark, which are located along the coast of Europe.

At '+ 13m', the Caspian Sea, the world's largest lake, is about twice as large.

If you zoom in on the map, it seems that the Caspian Sea is connected to the Black Sea. Apparently it will be the inland sea of Central Asia instead of the largest lake in the world.

Related Posts:
in Review, Web Service, Posted by darkhorse_log
