"CLIMATE TIME MACHINE" seen at a glance on how climate change has occurred
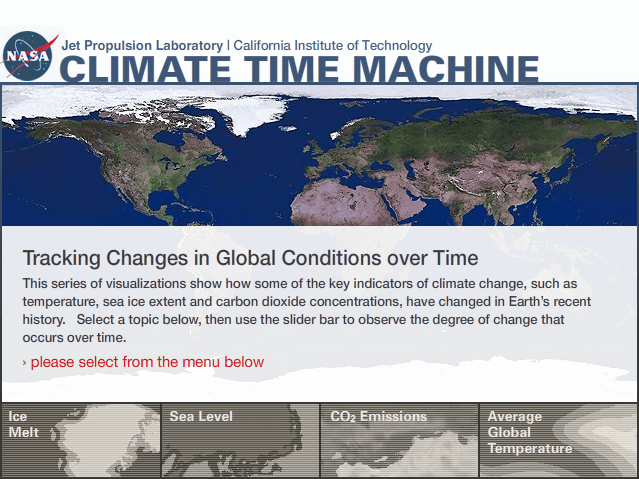
With the service "CLIMATE TIME MACHINE" provided by NASA, we can see at a glance how the Earth's climate change has occurred using the visual data accumulated so far. What can be seenReduction of Arctic Ocean Ice,Sea level rise,Increase in carbon dioxide emissions,Temperature riseFour of them. Even though the data is small, it has been accumulated for the last ten years, and for many things for 120 years.
Details are as below.
CLIMATE TIME MACHINE
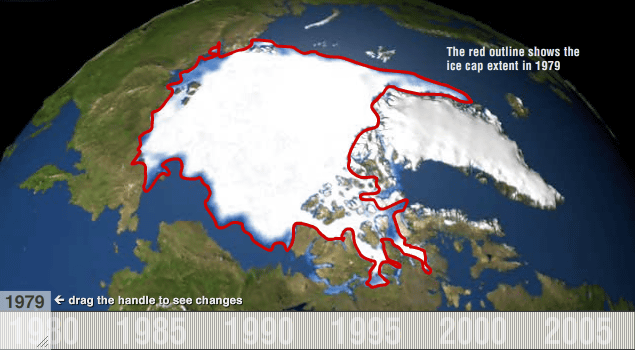
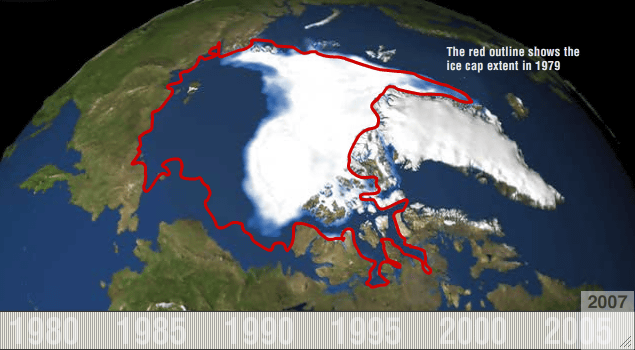
By choosing "Ice Melt" from the menu at the bottom of the site you can see how ice is decreasing in the Arctic Ocean. The criterion is in 1979, moving the slider to the right will make the era new.
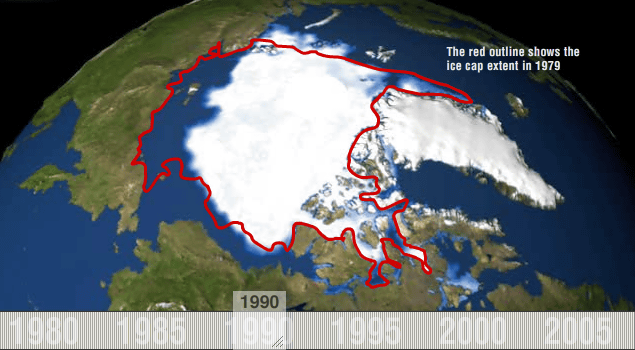
1990. The area facing Russia on the left side of the screen retreats considerably.
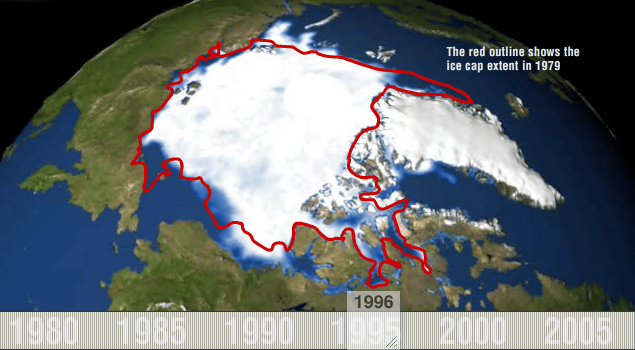
1996. The shape has changed since 1979, but the Russian side, which had been retreating in 1990, also became quite large as the ice stretched again.
The most recent 2007. Ice area has decreased to about half of 1979.
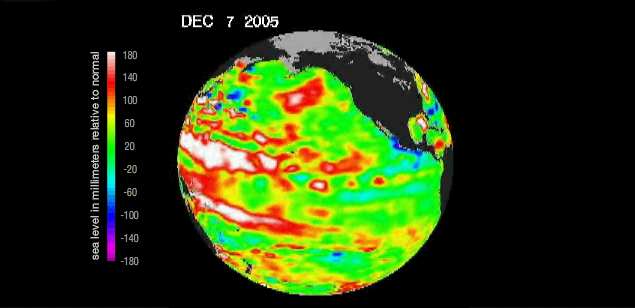
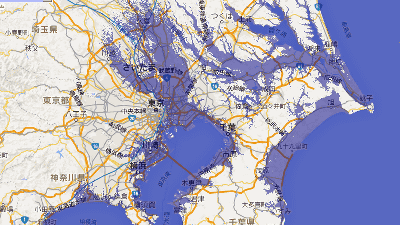
Sea level change seen from "Sea Level". (7/1 19:53 Correction)
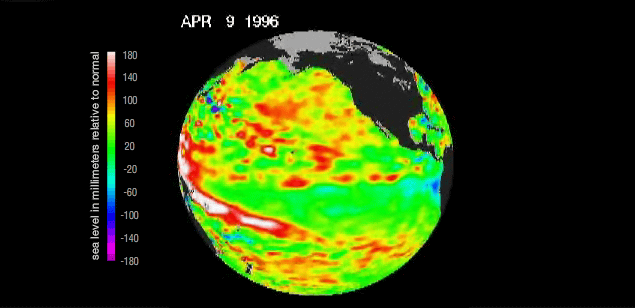
Sea level is rising along the equator from South America to the Pacific Ocean. If you are looking at colors onlyEl Niño phenomenonwant to see.
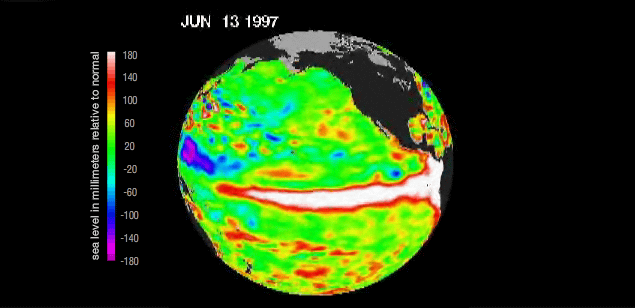
There is a dent beside the excited part.
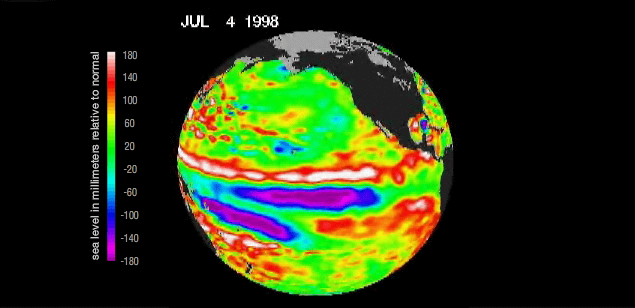
The entire Pacific seems to be rising in sea level in 2002.

2005. Is the sea level gradually rising over time?
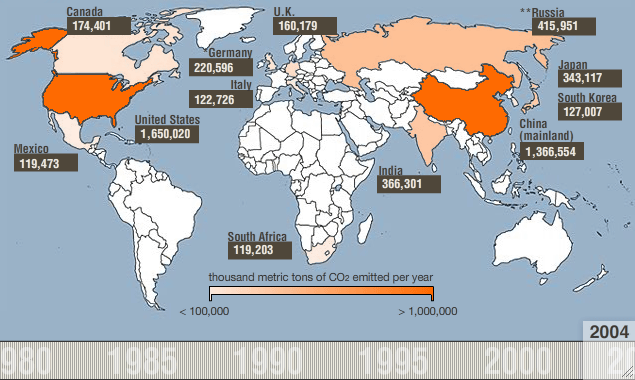
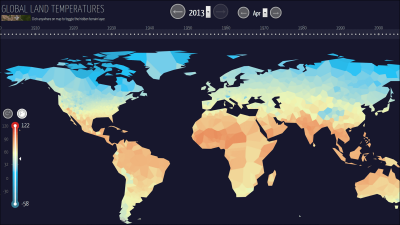
"CO2 Emissions" can compare carbon dioxide emissions of major countries. The country that is painted with dark orange color means that there is much emissions.
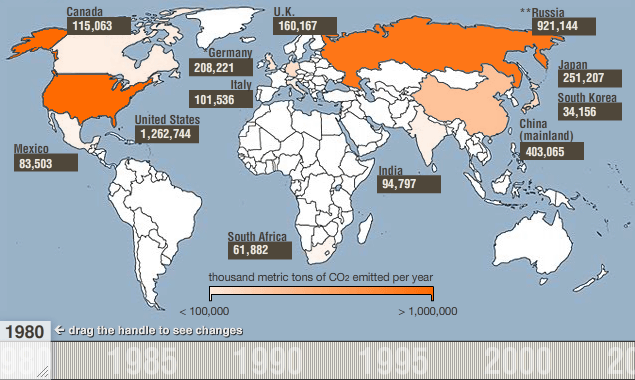
It is America that the amount of emissions is always high.
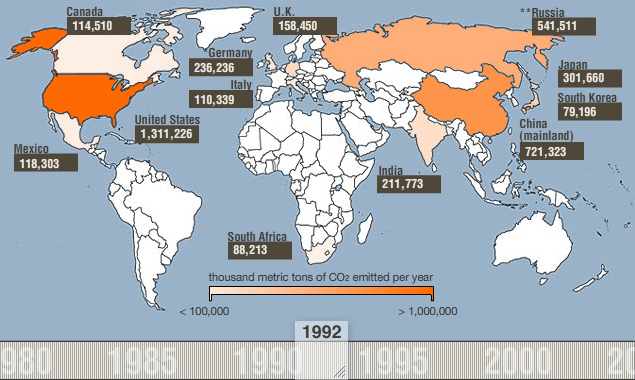
In recent years, China and India are growing, and Russia seems to be decreasing.
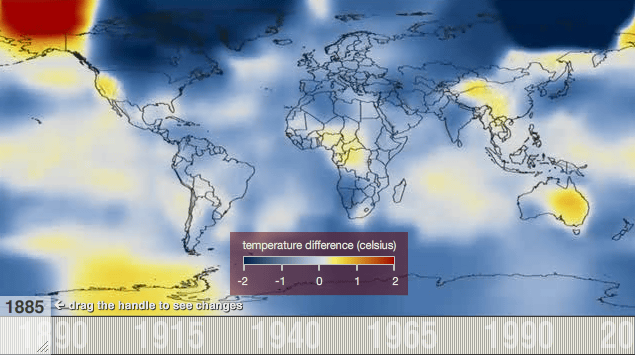
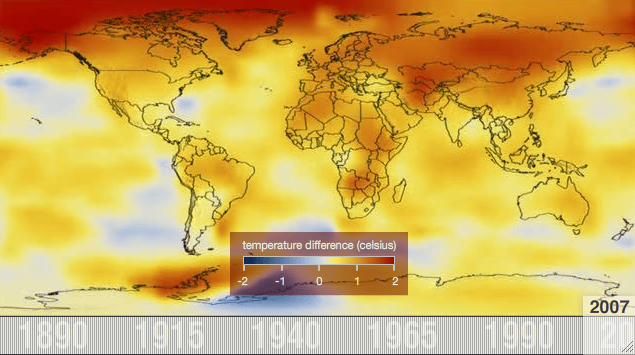
The last "Average Global Temperature" is the state of the rise in temperature. You can compare between 1885 and 2007.
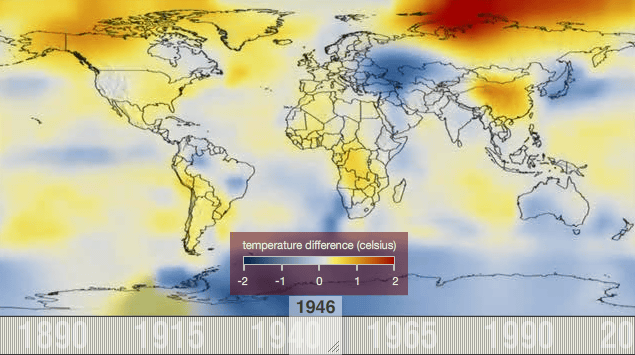
1946 after the Second World War. There is an upward trend around Arctic.
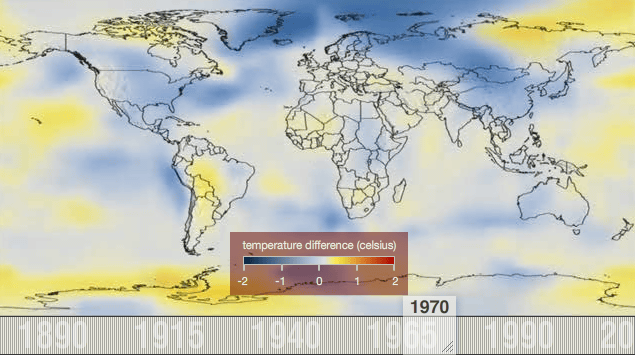
In 1970 with little fluctuation overall. It is the year when the Osaka World Expo was held.
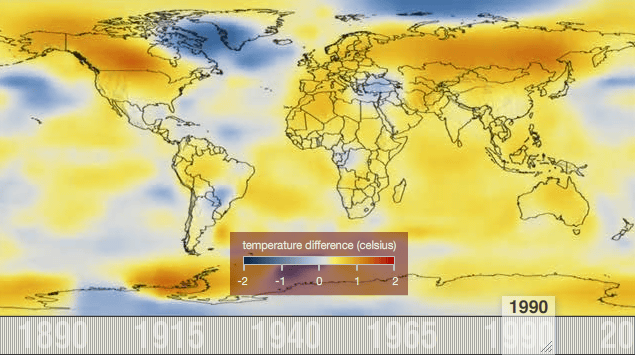
In 1990, the temperature turns to an upward trend around the world.
And the most recent 2007 data. Although it is because of color coding, it seems that the earth is dirty and perhaps destroyed somehow.
Related Posts:


in Web Service, Posted by logc_nt