National Oceanic and Atmospheric Administration releases maps and graphs that show climate change over the past 120 years in one shot

Climate change and the 1991-2020 US Climate Normals | NOAA Climate.gov
https://climate.gov/news-features/understanding-climate/climate-change-and-1991-2020-us-climate-normals
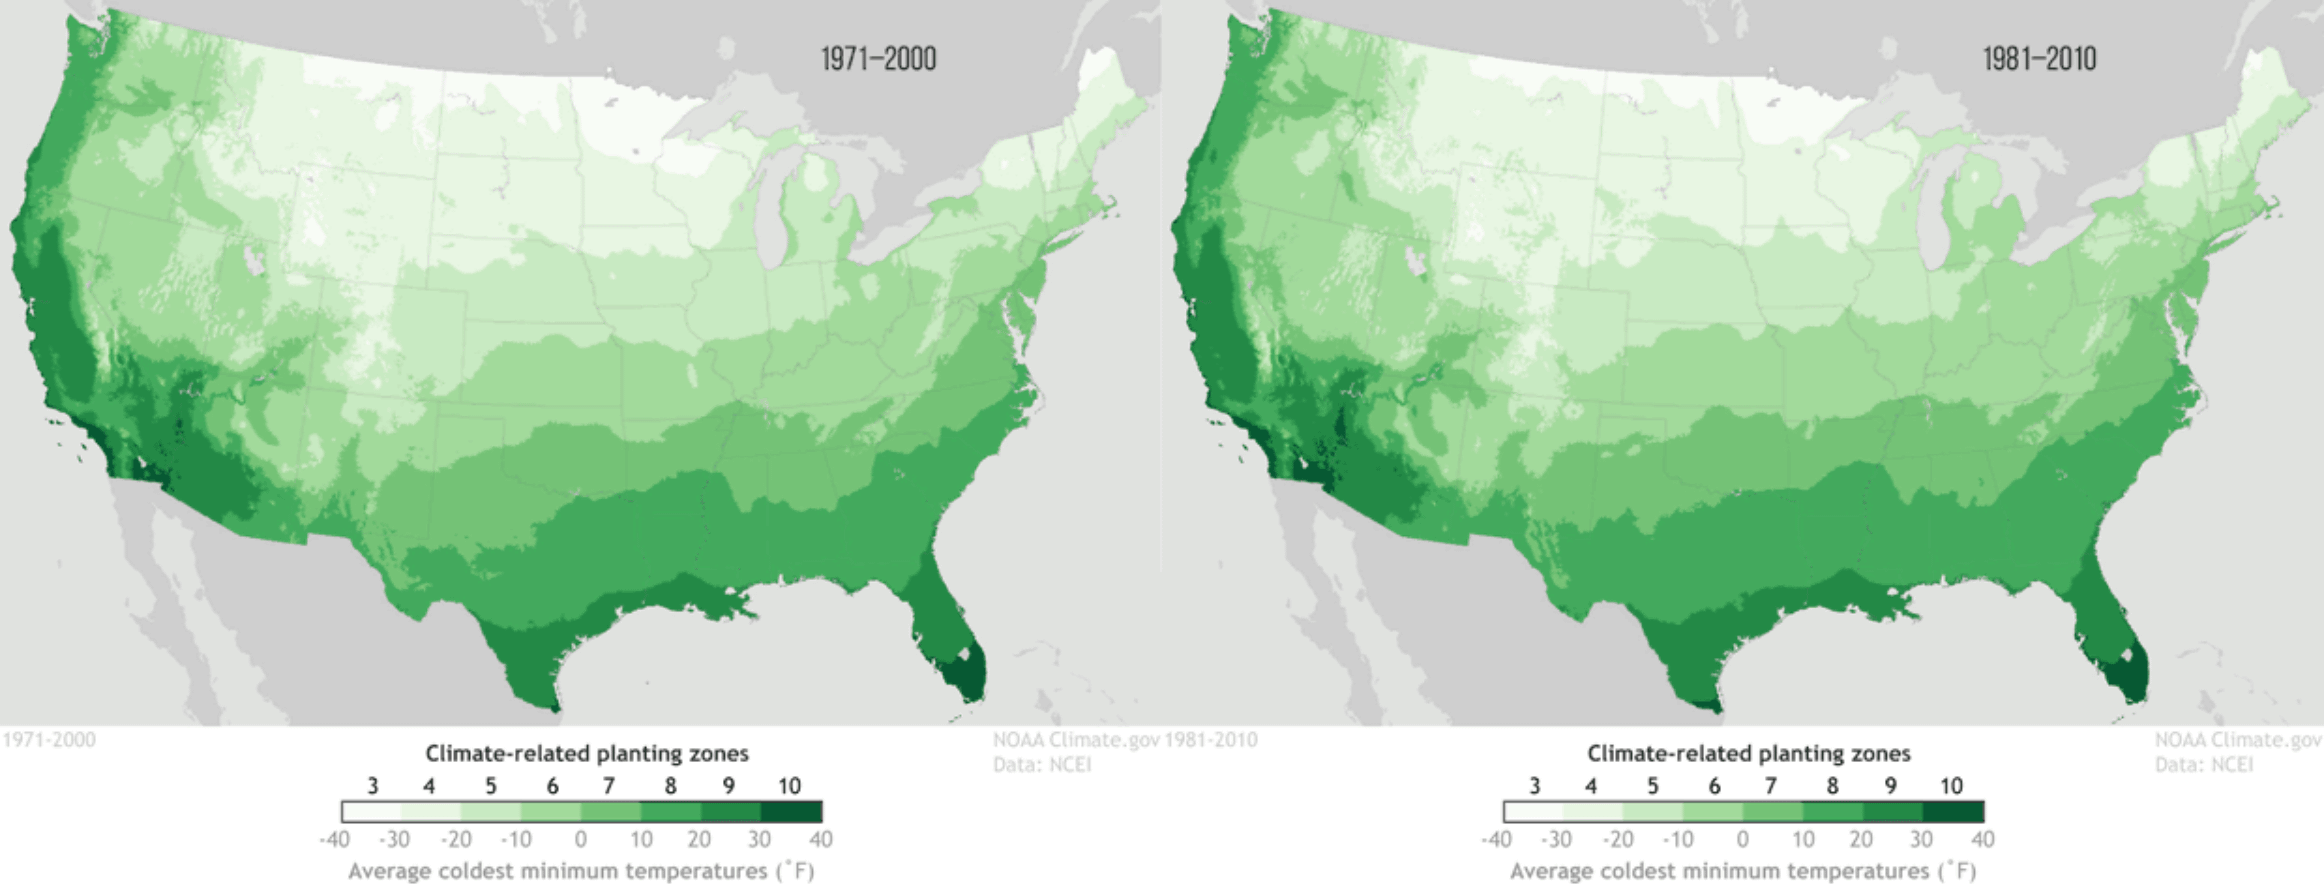
The average yearly value was last updated in 2011, from 1971 to 2000 to 1981 to 2010. At this time, the following map showing the 'plant zone ', which is the distribution zone of climate-related plants, was created. Compared to 1971-2000 (left image), the vegetation zone from 1981-2010 (right image) has moved northward as a whole. The shift of the vegetation zone to the colder north indicates that 'the overall climate of the United States is warming.'
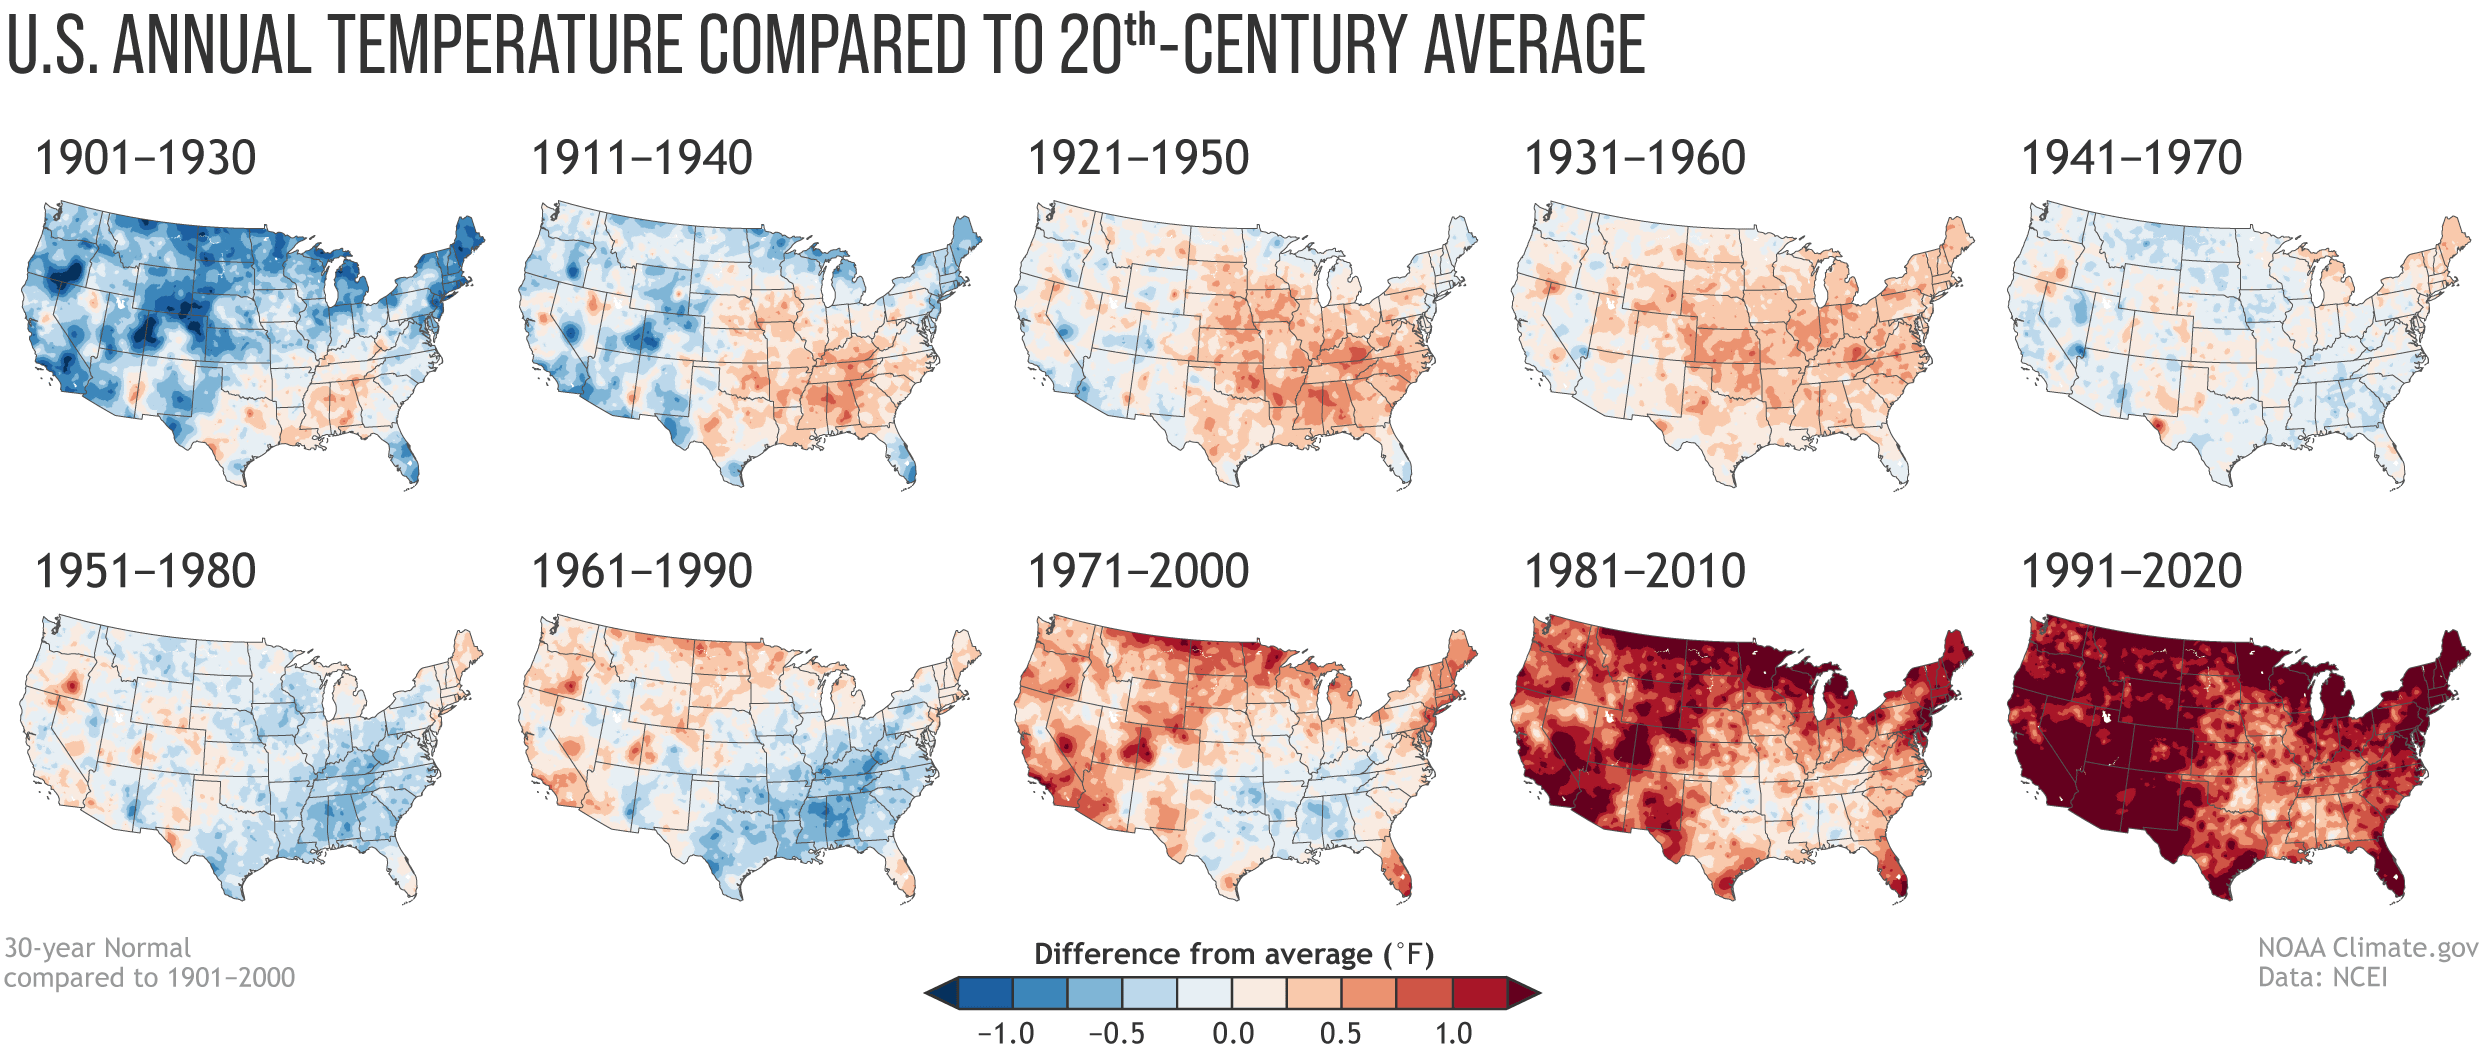
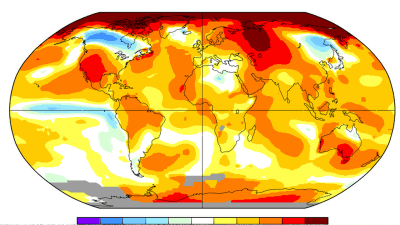
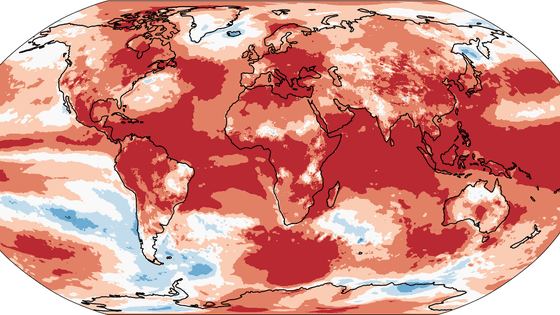
Below is a map that summarizes the average temperature in order among the average yearly values in the United States. Compared to the average temperature during the 100 years from 1901-2000, the low part is shown in blue and the high part is shown in red, clearly visualizing that global warming is steadily progressing throughout the 100 years. I will.
And the map below summarizes the changes in annual precipitation. Compared to the average annual rainfall for the 100 years from 1901-2000, the lesser part is shown in brown and the more part is shown in green. Looking at this, we can see that precipitation tends to increase from 1901 to 120 years.

The graph below summarizes the annual average temperature from 1901 to 2020 in a line graph (orange). The red line is a trend estimation line that shows the overall temperature fluctuation, but it is rising.

'The average year is changing, but we haven't overlooked climate change,' NOAA commented.
Related Posts:


in Science, Posted by log1i_yk