NASA publishes animation that shows how serious the progress of sea level rise is
Global average sea level continues to rise as polar ice melts due to global warming. NASA has released animations visualized based on measurements for 20 years to see how serious this situation is.
NASA SVS | Sea Level Through a Porthole
Sea level rise animation for 20 years from 1993 to 2022 visualized by NASA-YouTube
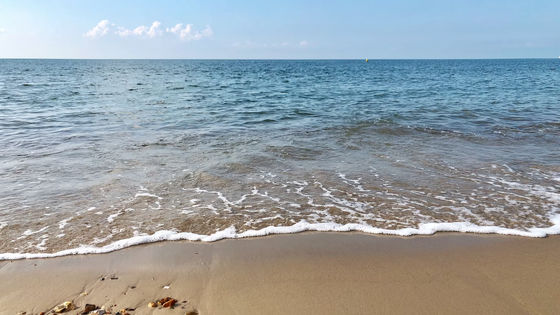
There are two animations posted on the site, but the content is the same, just the appearance is different. The round frame in one of the animations is attached with the image of looking at the sea surface from the window on the side of the ship.
Animation started in 1993. Sea level rise values are taken from 60-day moving averages of the same data. The animated sea surface is wavy and can be higher or lower than the graph line.
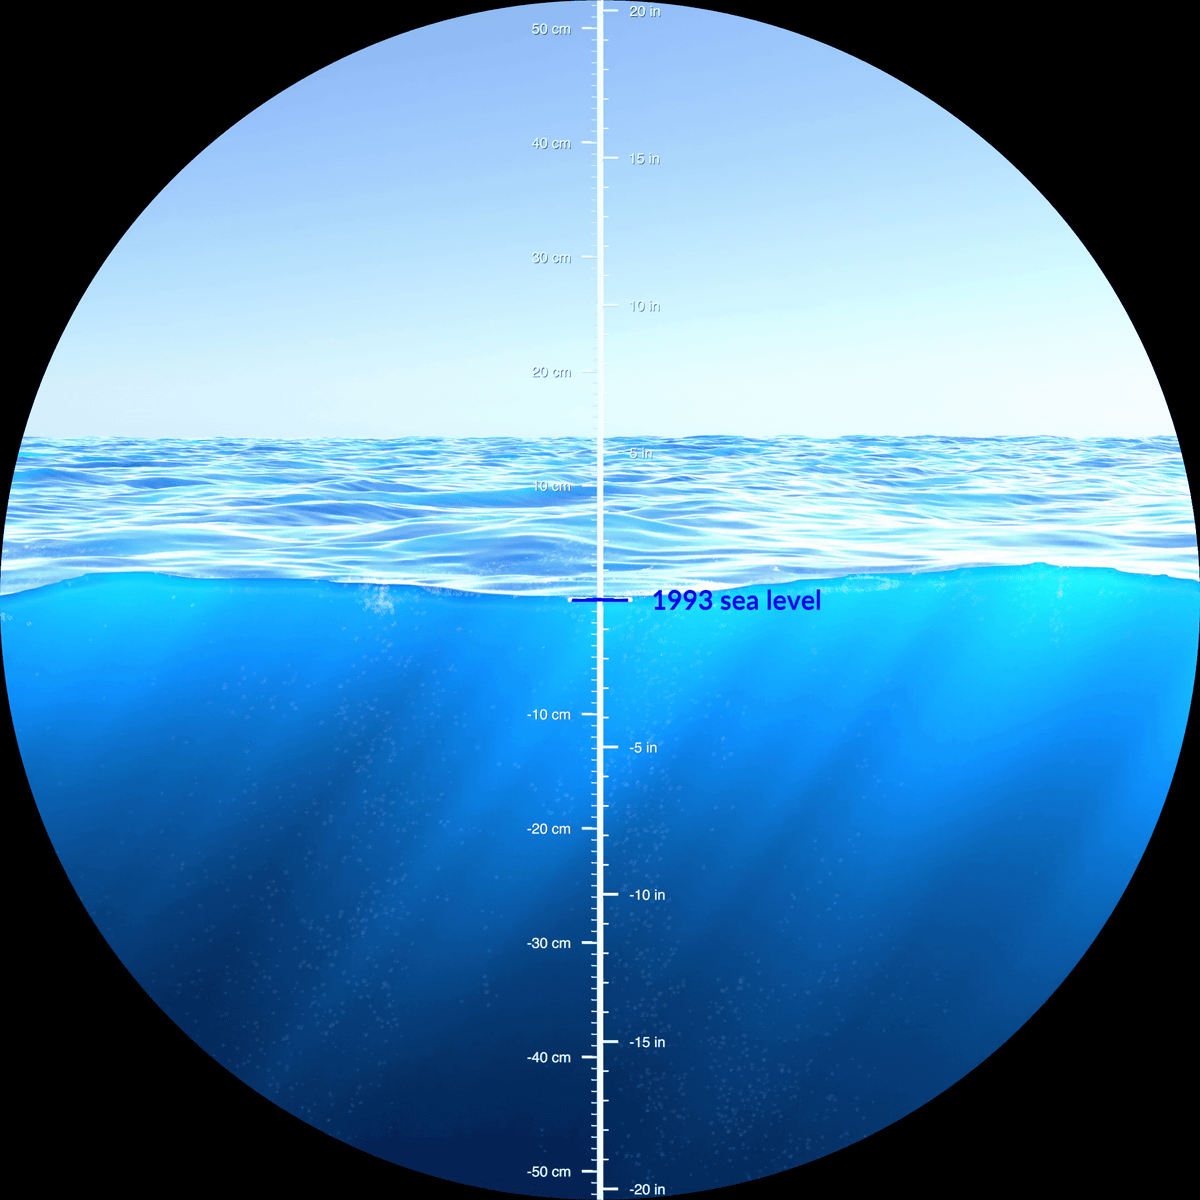
As of 1998, the increase was 2cm. The graph shows that it is rising, but still seems to be within the vertical range.
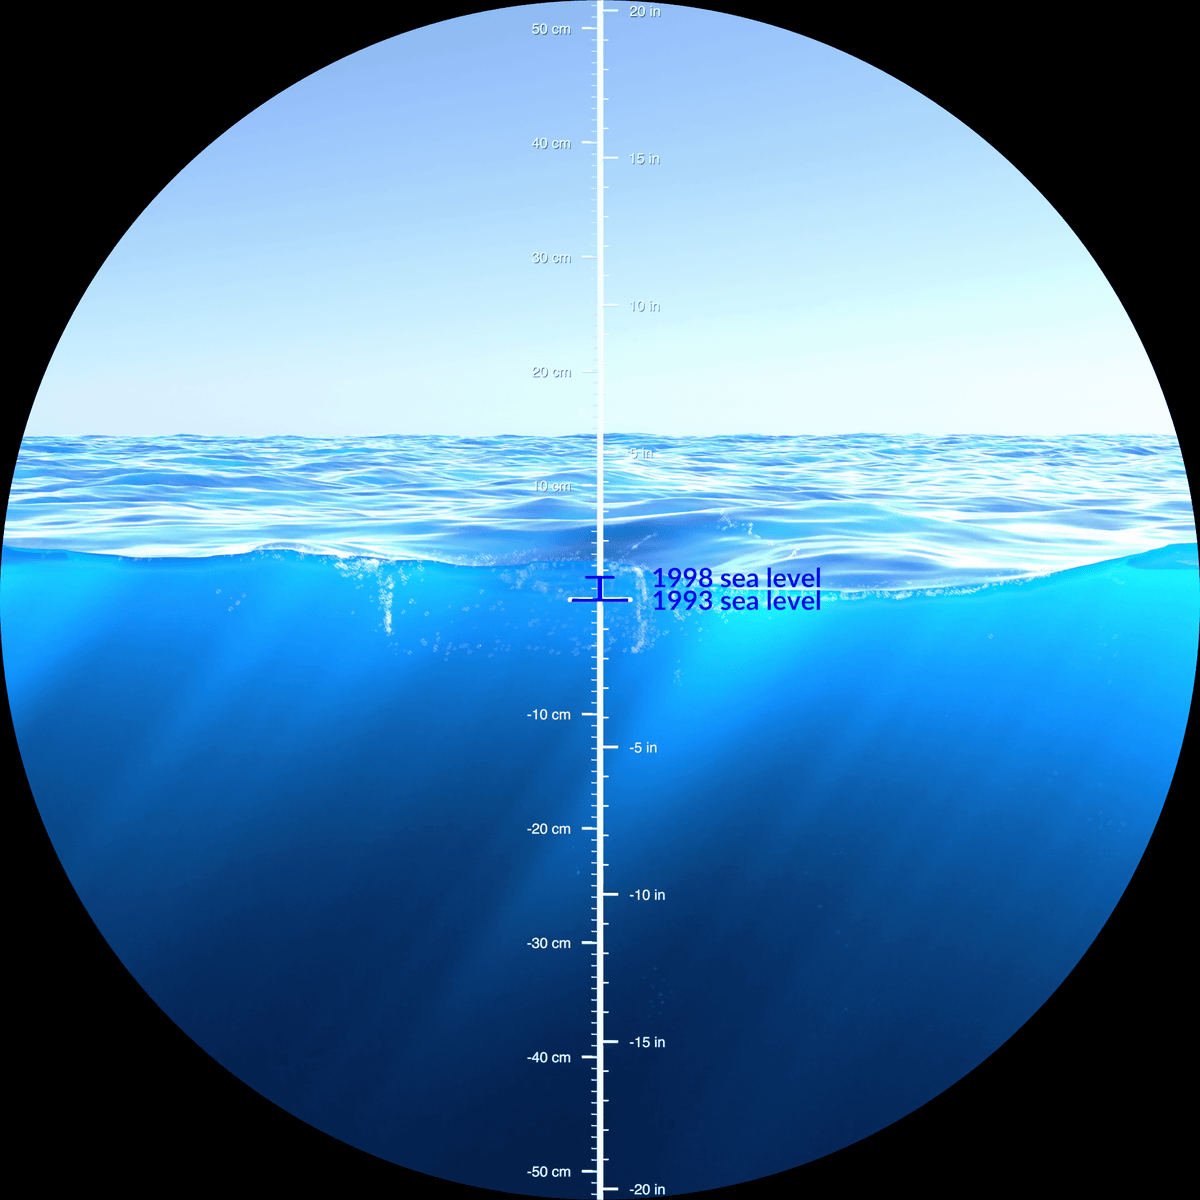
As of 2003, the rate of increase is 2 cm, and the numbers continue to fluctuate slightly around this point.
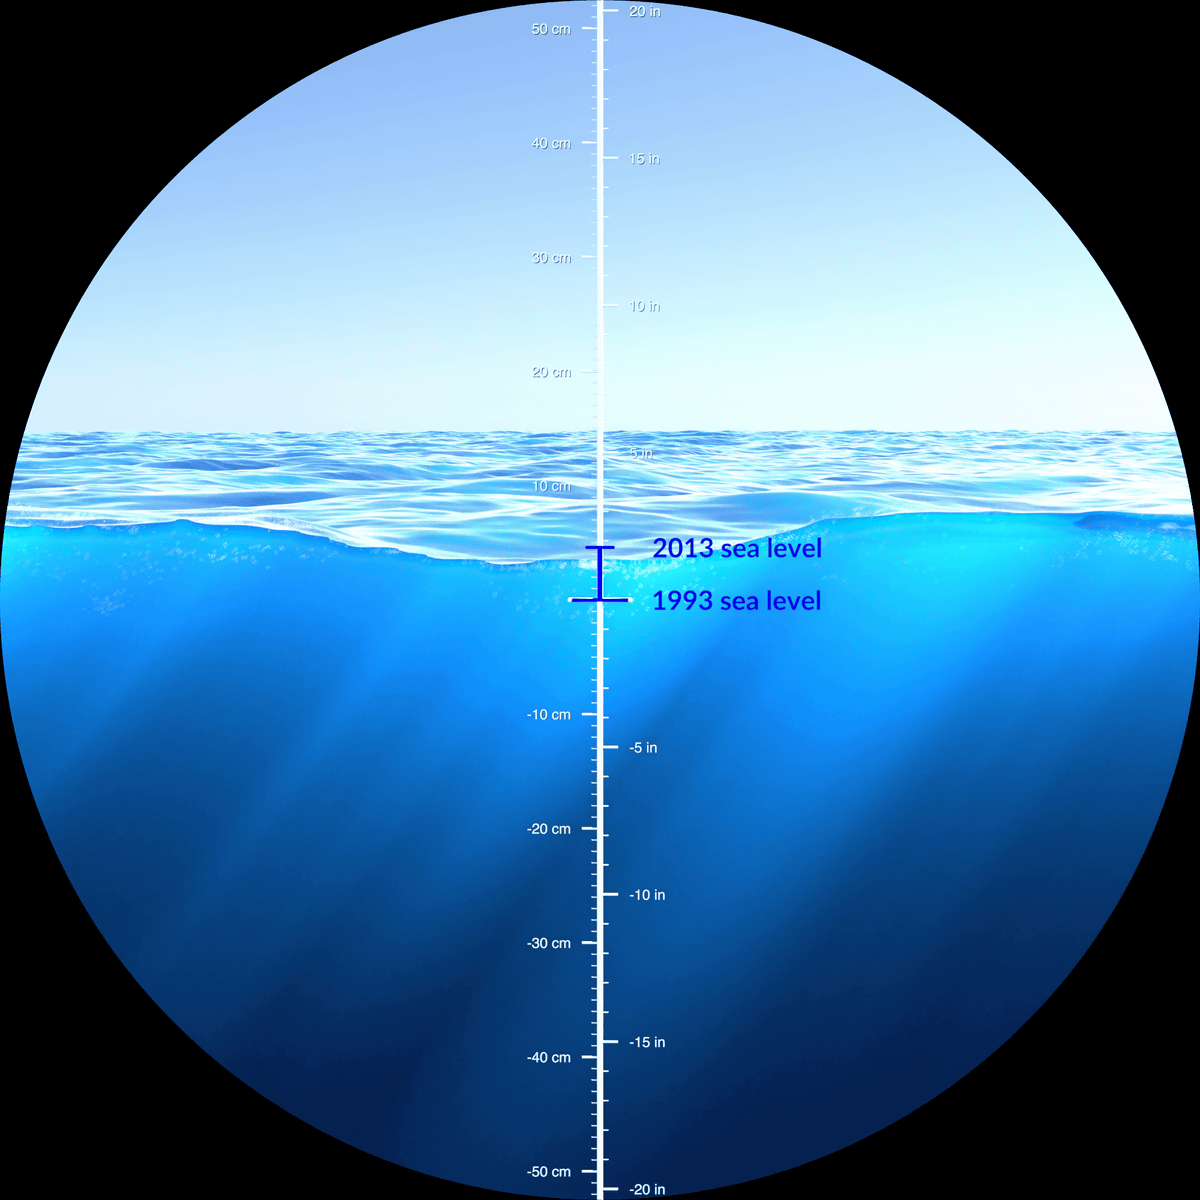
By 2013, the increase was about 5 cm.
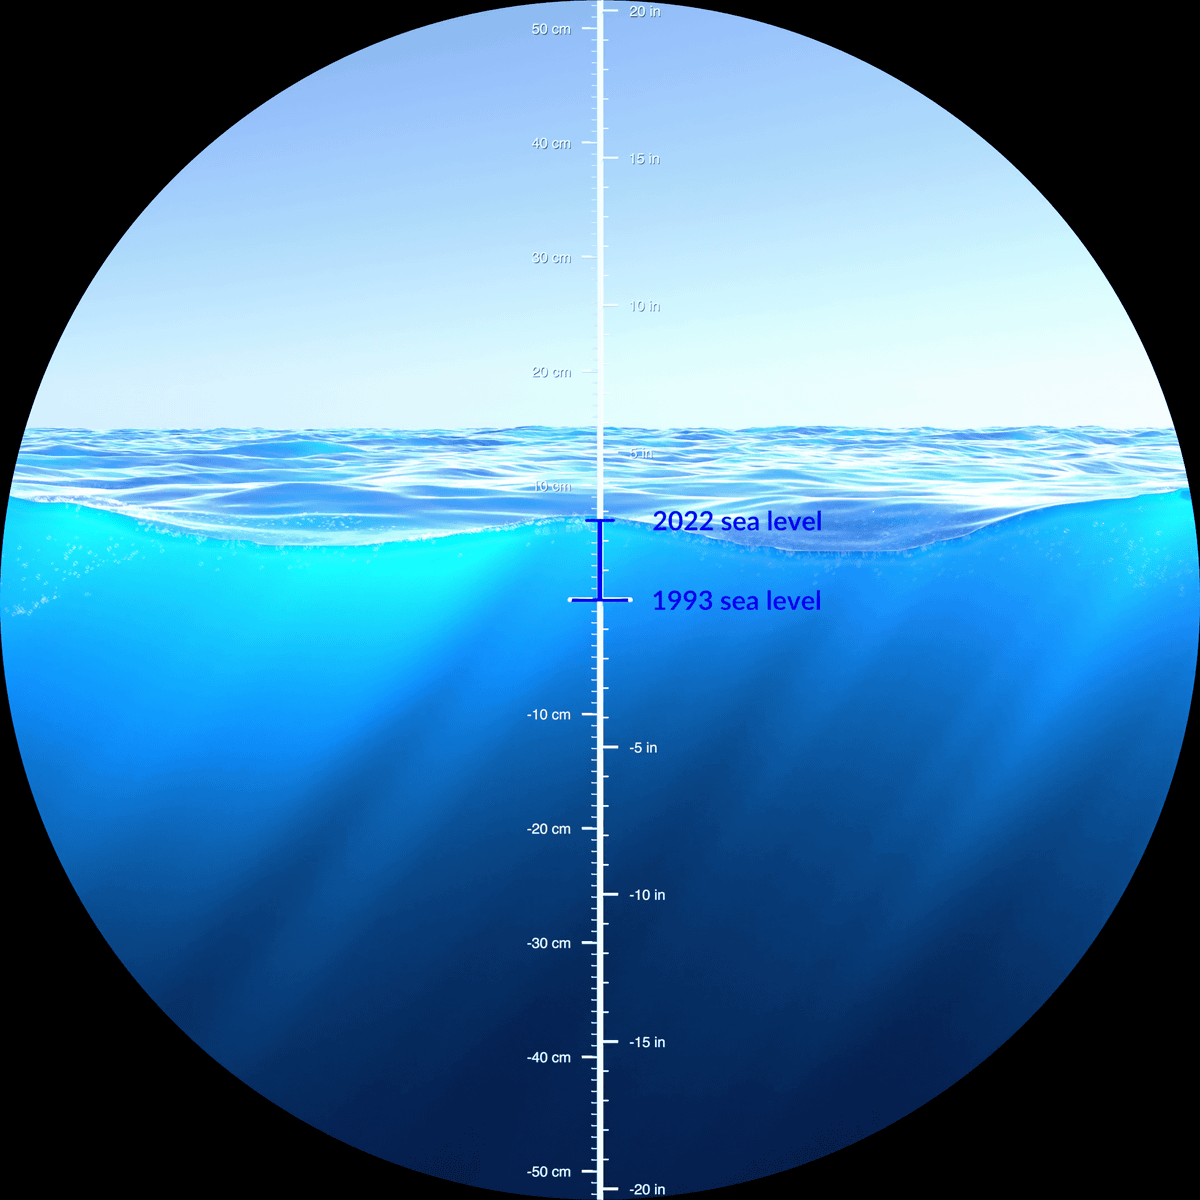
The rise in 2022 is about 7 cm.
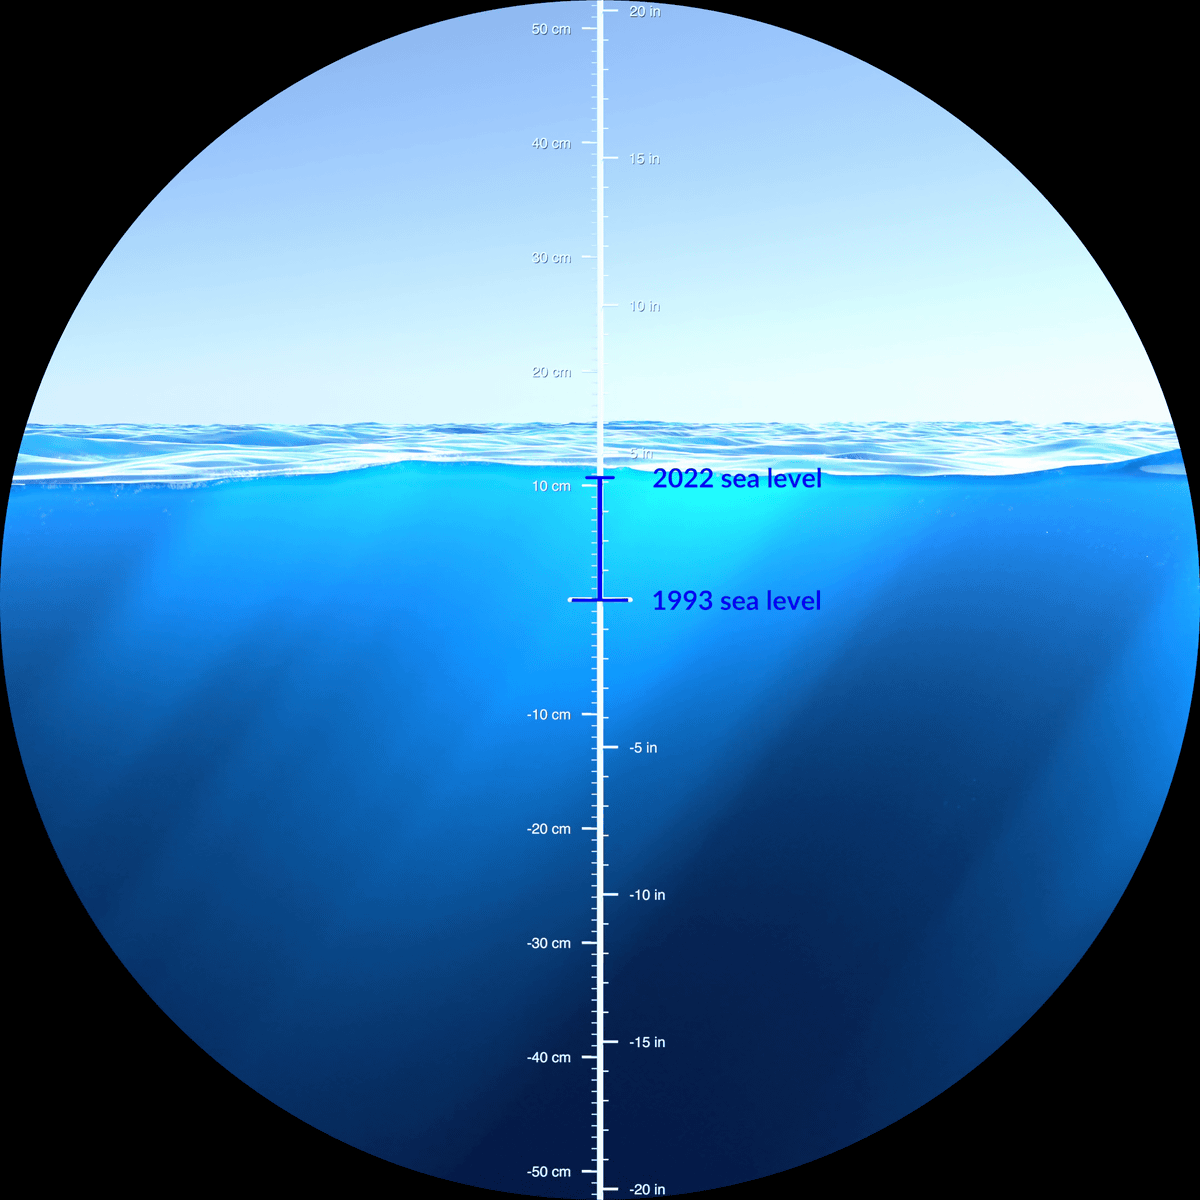
...... I thought, it came up to 10 cm or more. As of 1993, the sea level, which was in the center of the round frame, is clearly up and there is a sense of pressure.
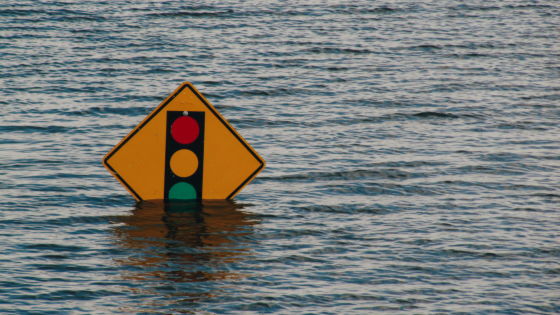
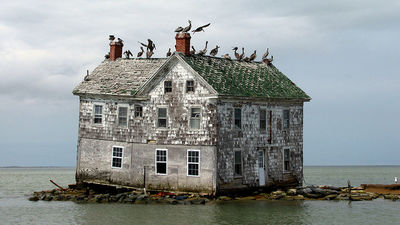
Sea level rise leads to concerns that coastal areas will be submerged in the future, but a 2023 study points out that before submergence, a large number of people will become isolated due to difficulty in moving. .
Related Posts:


in Video, Posted by logc_nt