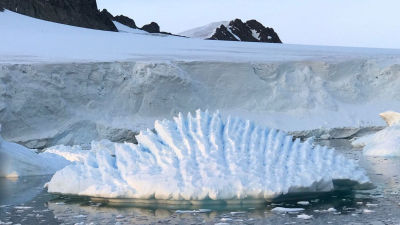
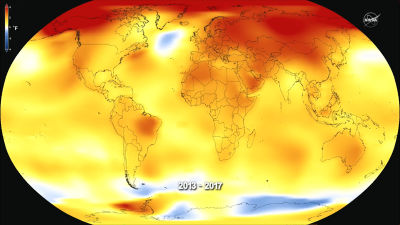
NASA survey revealed that the sea level rises all over the world & the ice island Greenland is melting

ByBaldeaglebluff
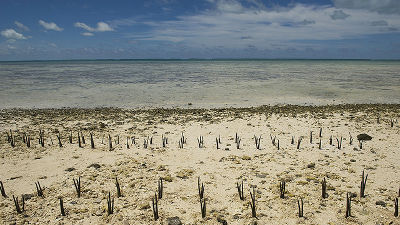
National Aeronautics and Space Administration (NASA)However, in the 23 years from 1993 to 2015 the sea level of the world increased by an average of 3 inches (7.62 cm), and it has revealed that it rises more than 9 inches (about 23 cm) depending on the place.
GMM: Sea Level Rise Briefing - August 26, 2015
http://svs.gsfc.nasa.gov/cgi-bin/details.cgi?aid=11978
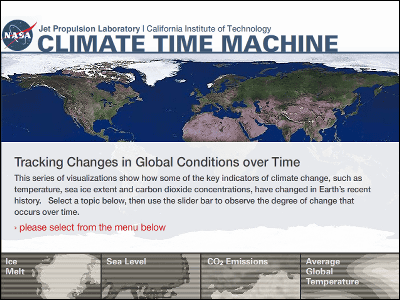
Climate Change: Vital Signs of the Planet: Sea Level
http://climate.nasa.gov/vital-signs/sea-level/
According to NASA, the sea level rise has two major factors, one is "Global warming"And the other occurs with global warming"Melting of land iceThat thing. Data showing what kind of pace these are actually going on is released.
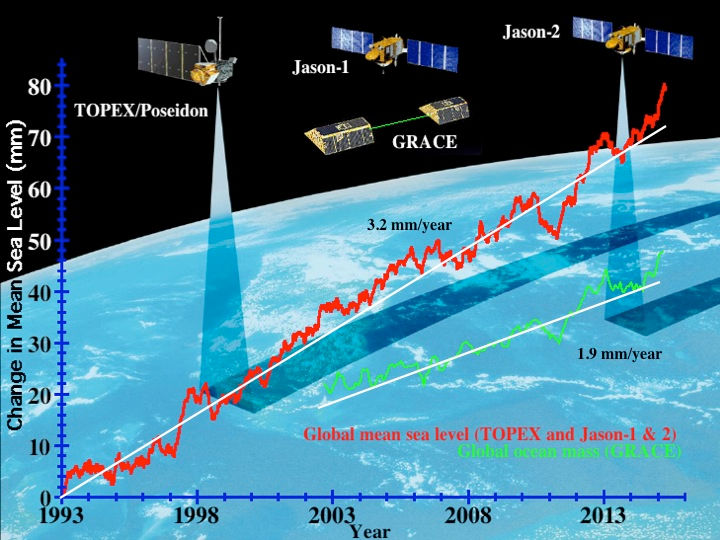
Since 1993 NASA has been developing "sea surface altitude measurement system using artificial satellite"TOPEX / Poseidon"Or"Jason 1, "Jason 2" has measured sea level altitude. The graph below shows how the sea level has risen from 1993 to 2015 by illustration and graph.
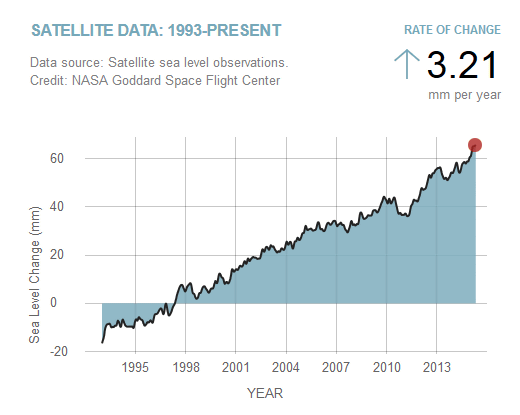
Below is what made graphs easier to see by drawing illustration. The year when the horizontal axis was observed, the vertical axis represents the height of the sea level, you can see that the sea level has risen dramatically in the past 20 years slightly. The data is an average of the sea level of the whole world, and on average, the sea level is rising as much as 3.21 mm in one year, and at this pace the calculation that the sea level rises by 30 cm or more in 100 years.
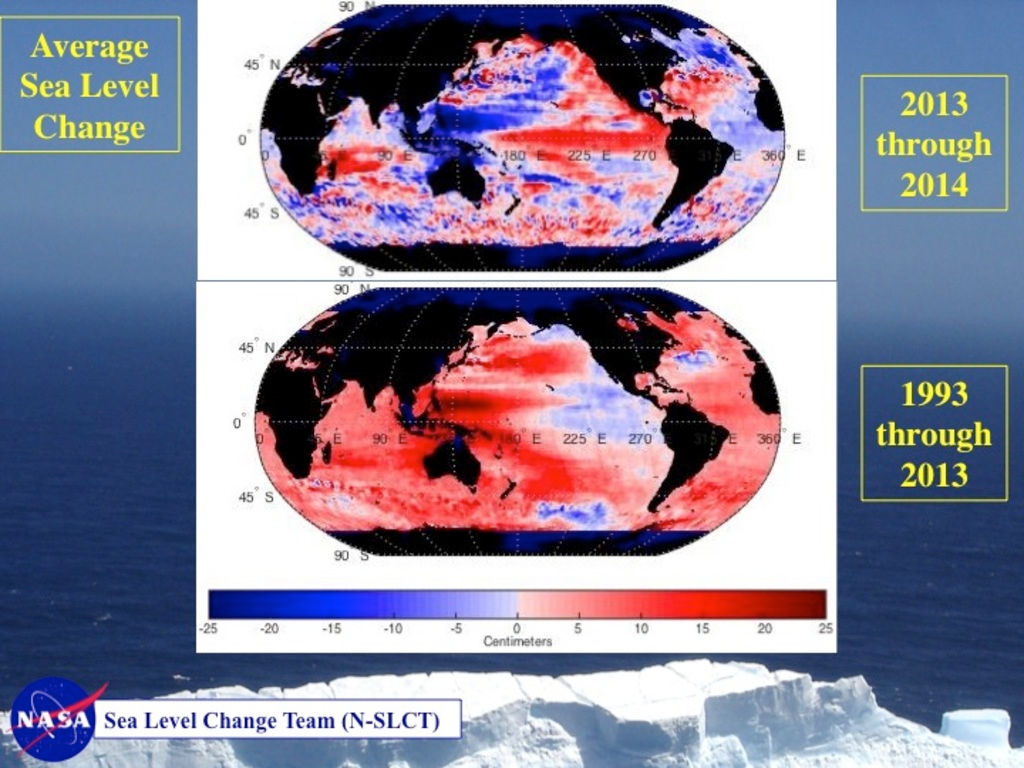
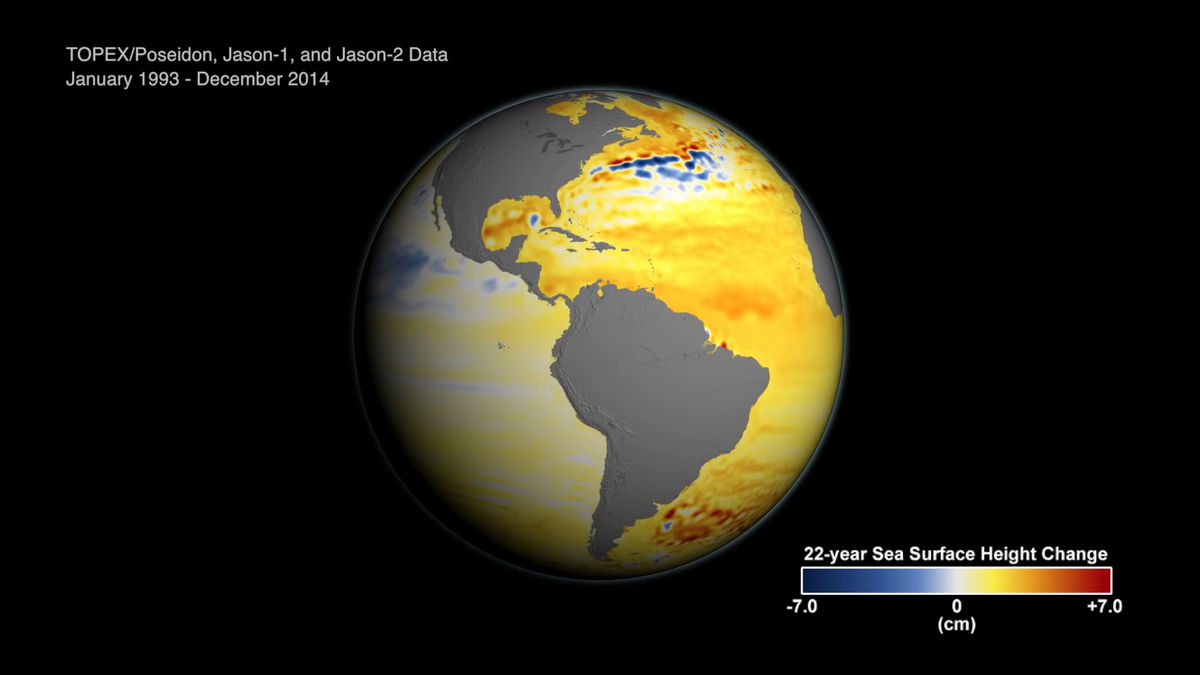
TOPEX / The following figure maps changes in the sea level of the whole earth based on data collected by artificial satellites such as Poseidon and Jason. The blue part of the figure shows the place where the sea level is low, the white color does not change, the red color shows the place where the red color rises, the above figure shows the change from 2013 to 2014, the bottom figure from 1993 It shows the change until 2015. Looking at the change in a single year, the sea level altitude is rising and the place where it is declining appear halfway, but sea level altitude is rising in most places when seen throughout the year 23.
By looking at the movie below you can see changes in the sea level of the earth more visually.
Watching Rising Seas From Space - YouTube
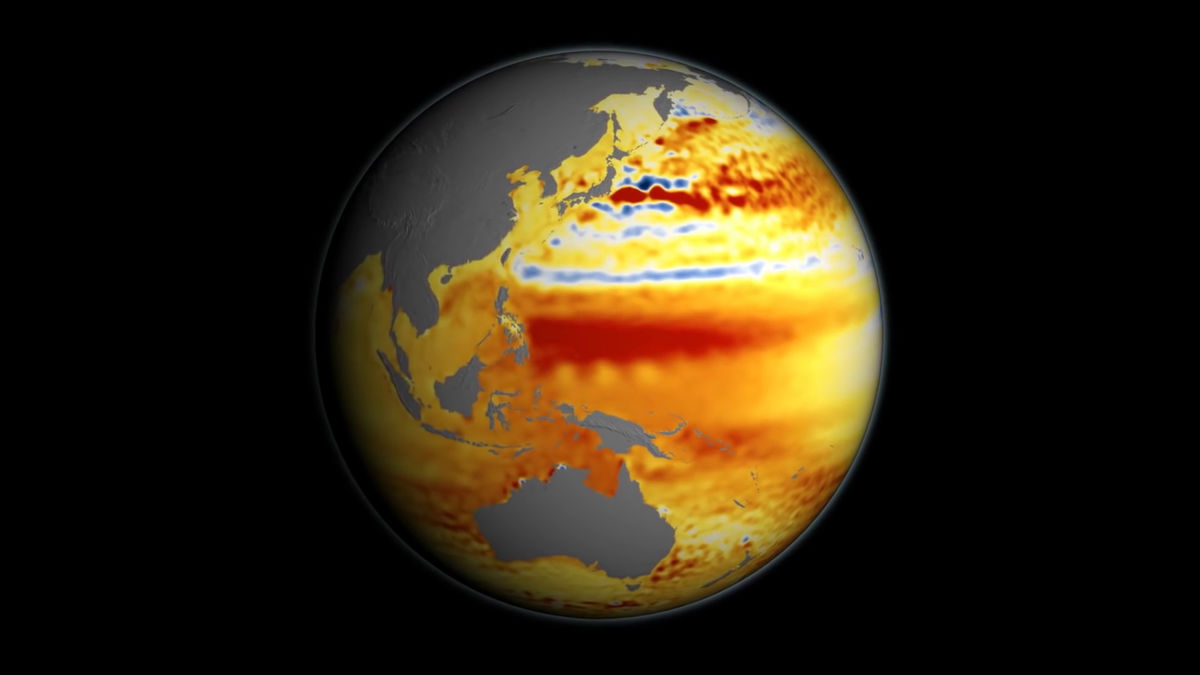
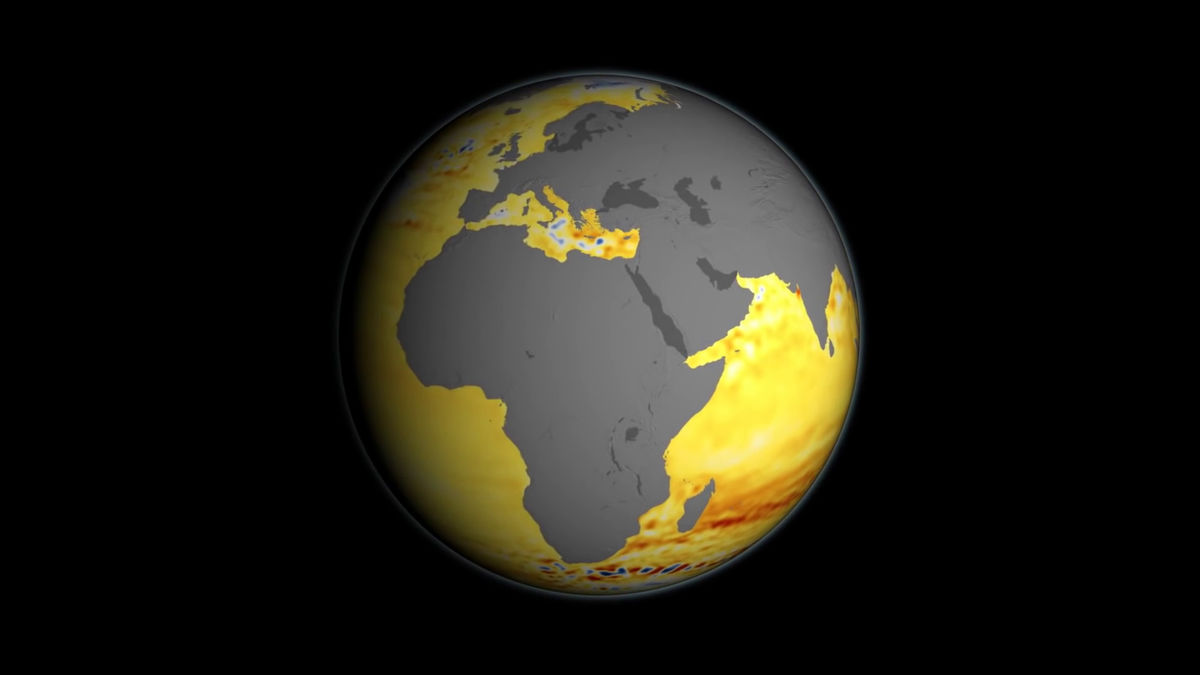
The gray part has land, and the part painted on blue, white, and tea shows the place where sea level altitude has changed. The data in the movie are collected for 22 years from 1993 to 2014 collected by artificial satellites such as TOPEX / Poseidon and Jason. The white part is a point where there is no change in the sea level altitude, the sea level altitude increases as the dark brown color increases, and the blue part is the point where the sea level altitude has declined.
The Americas
Japan · Australia · East Asia · Southeast Asia
Europe / Africa
On the other hand, the graph below shows a change in sea level altitude based on the data measured by the tidal rigs installed along the coast. The measurement period is 130 years from 1870 to 2000. According to this, the sea level has risen by about 20 cm from 1870 to 2000, but this clearly rises gently compared with the pace of the current sea level rise, and how severe the current pace is abnormal It is understood whether it is things.

The following graph shows NASA's twin artificial satellite "GRACE"Observed by the melting mass of the ice sheet. A light blue line shows the amount of melting of the ice sheet in Antarctica, and the green line shows the ice sheet melting amount of Greenland. The observation period is 14 years from 2002 to 2015, but it turns out that the ice sheet of Greenland is overwhelmingly melting than the Antarctic ice sheet.

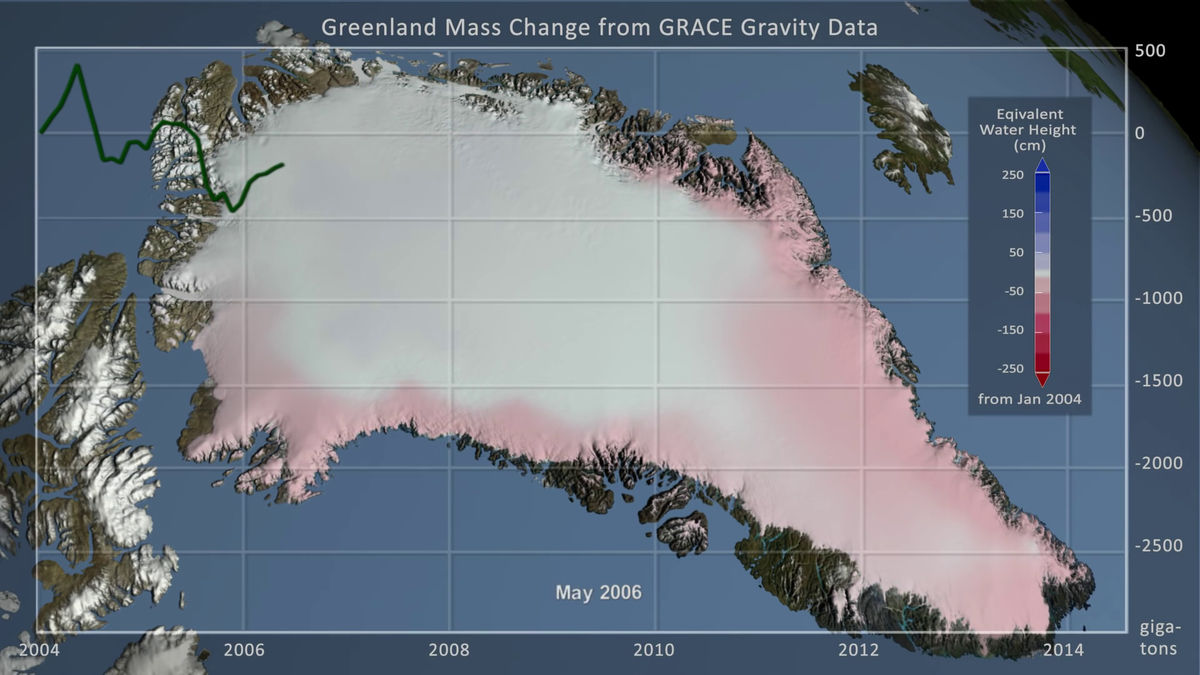
In the following movie, we can see the trend of decrease in Greenland's ice sheet measured by the two satellites "GRACE" launched to investigate the Earth's gravitational field since 2004. The color scale at the upper right of the screen shows a change in water level of plus or minus 250 cm, the blue part shows the place where the water level decreases, the red part shows the part where the ice sheet has decreased and the water level has risen.
Greenland Ice Mass Loss: Jan. 2004 - June 2014 - YouTube
The following white island is Greenland. The line graph displayed so as to overlap on it shows the rate of change of ice sheet mass of Greenland in Gigaton (1 billion tons) unit.
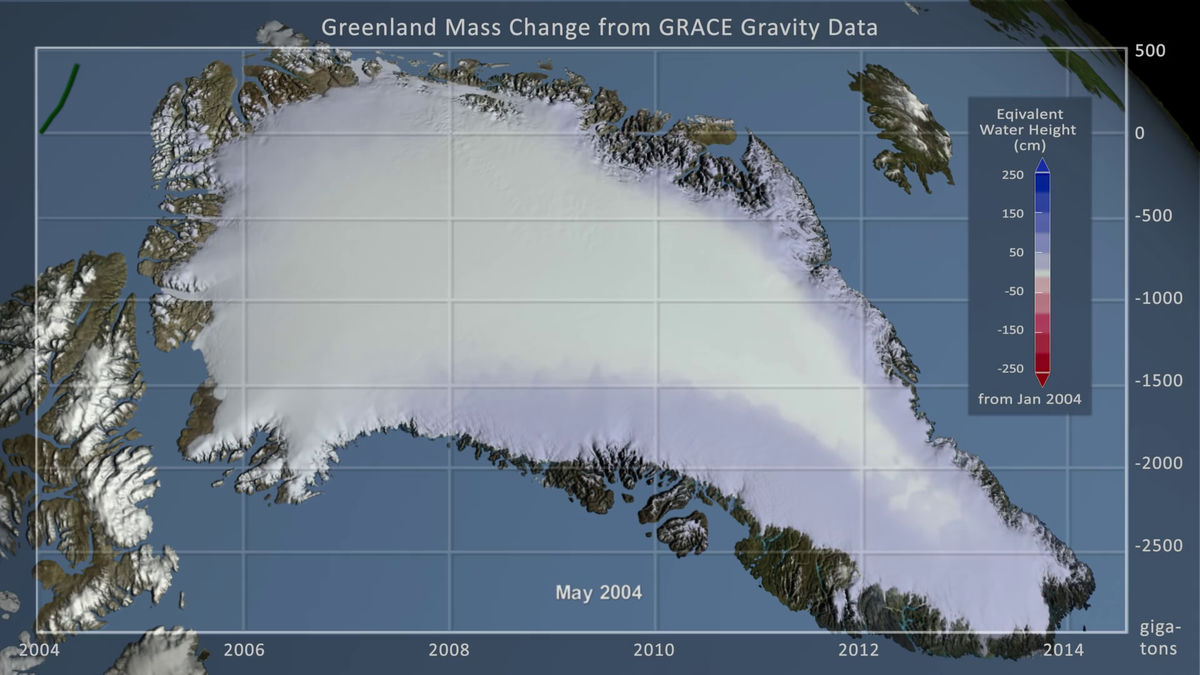
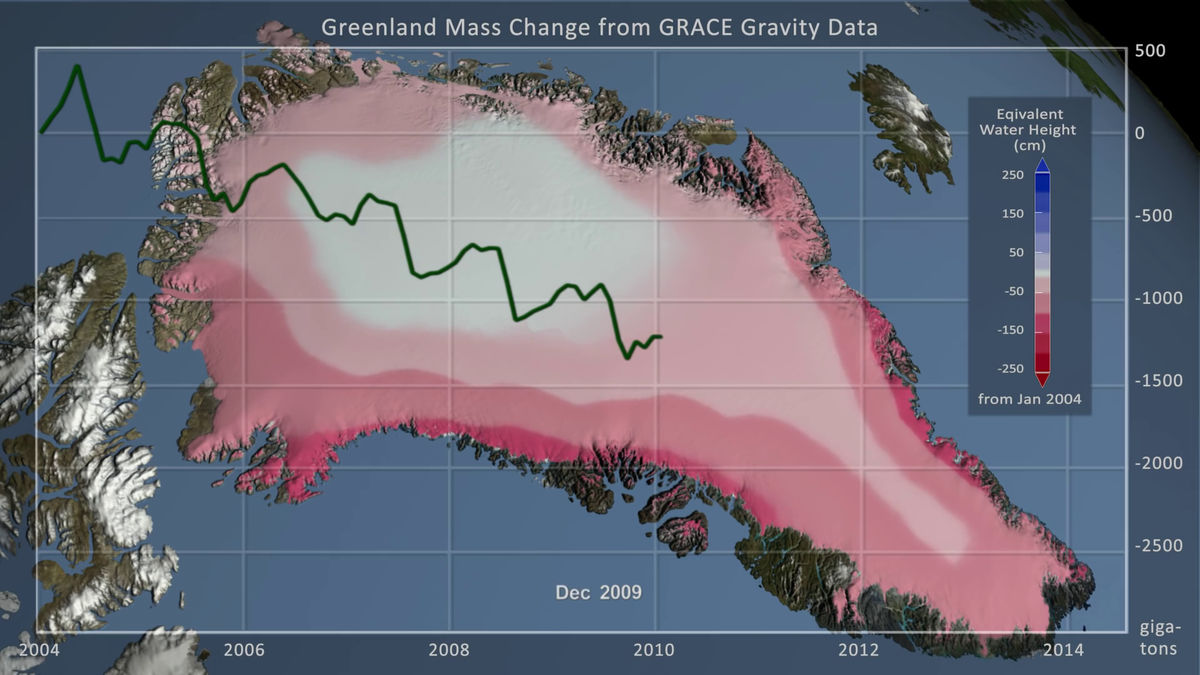
Initially it changes slowly and the part in contact with the sea surface is gradually melting.
Mass melted in 6 years from observation breaks to 1000 Gigaton
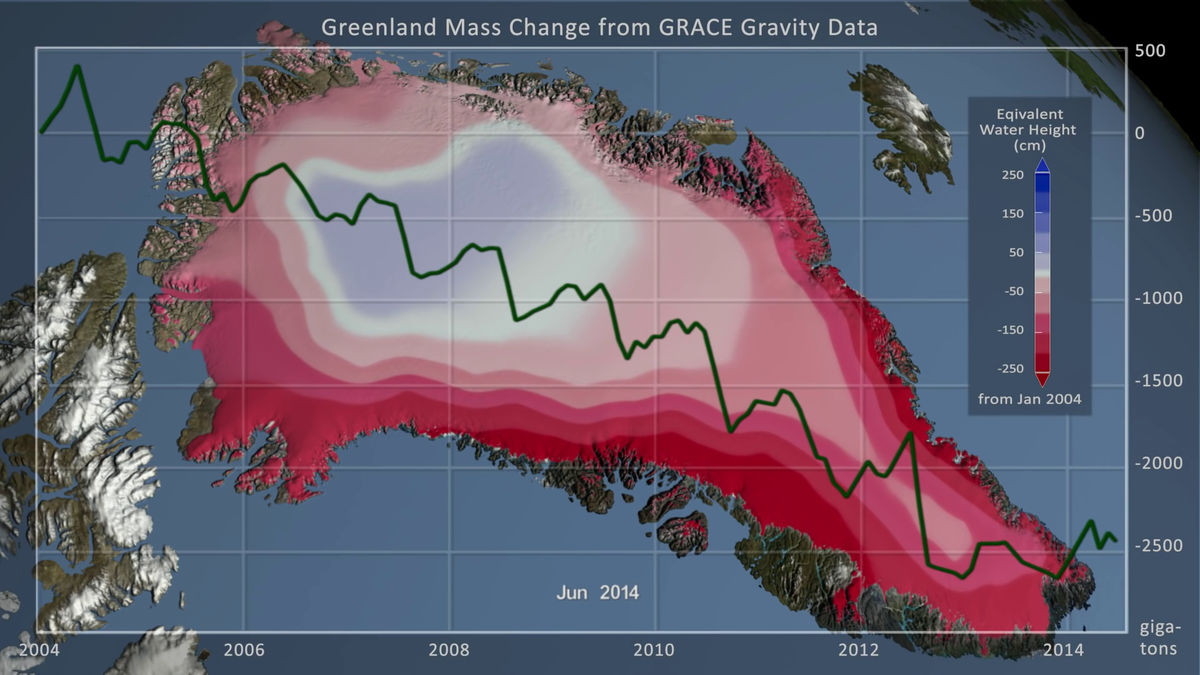
You can see that the ice melts fairly extensively at the stage of 2015. Also, the melting mass is a tremendous number of about 2500 gigatons.
Related Posts: