A masterpiece that visualized the flow of carbon dioxide on a global scale
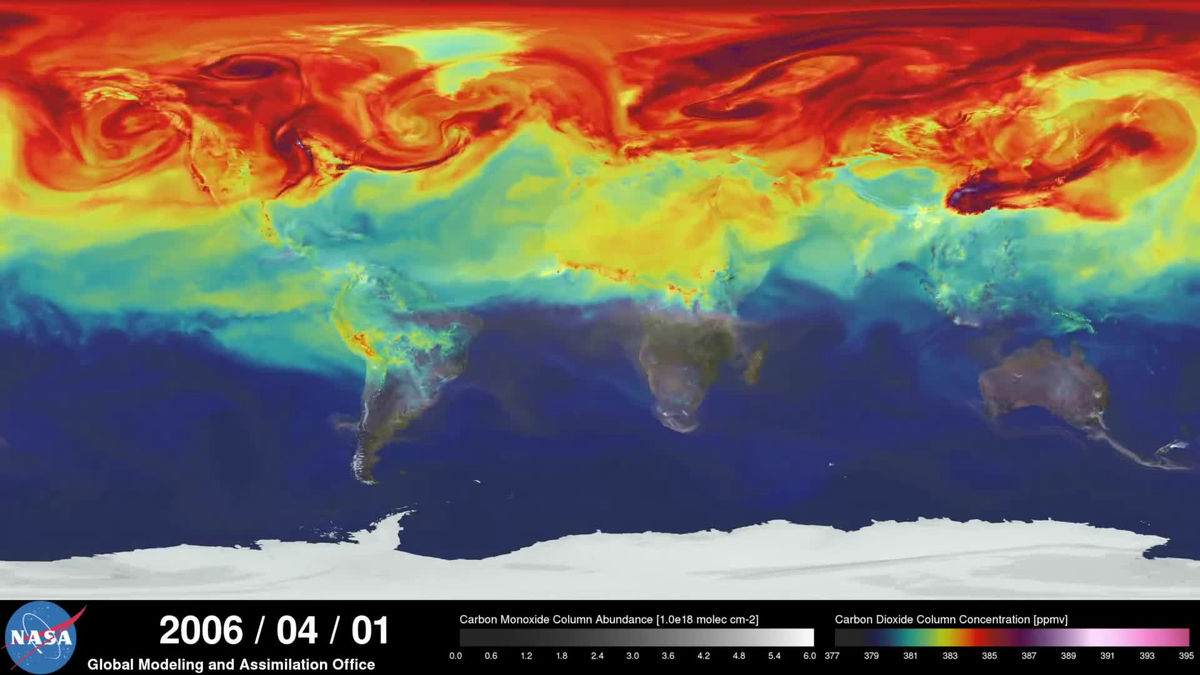
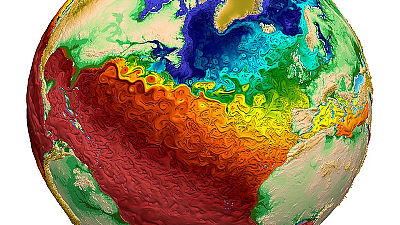
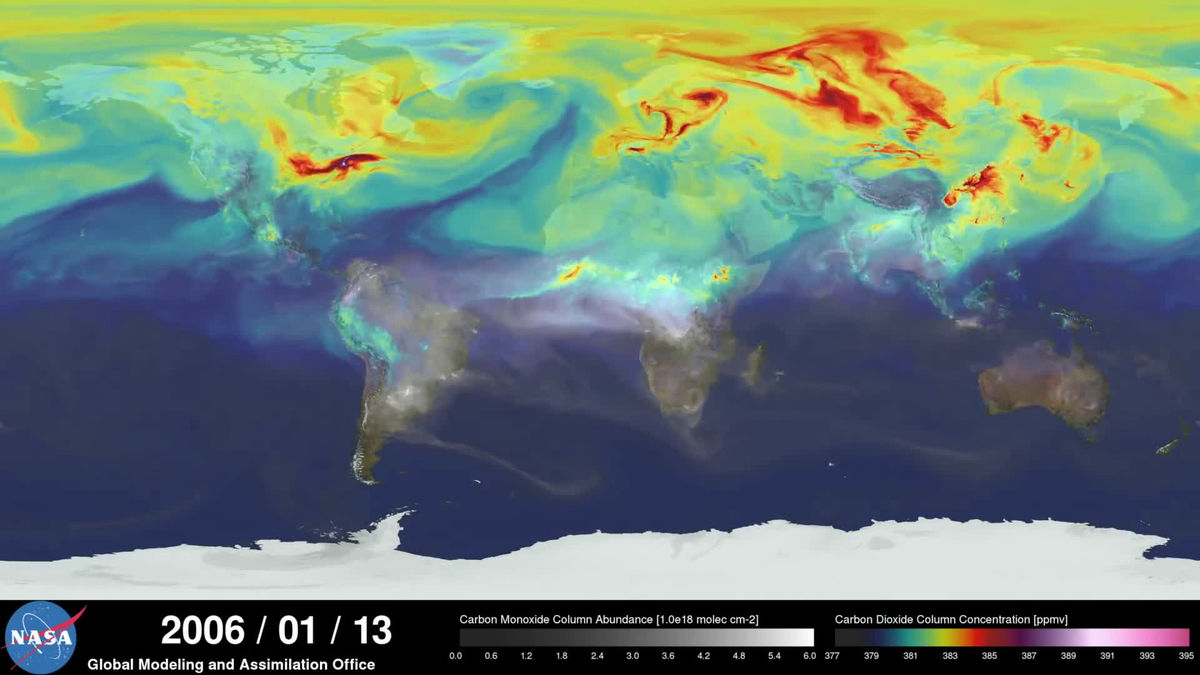
December 3, 2014,World Meteorological Organization (World Meteorological Organization),The possibility that the annual average temperature of this year's world will be the highest in observation historyWe announced that there is. As one of the causes of global warming, an increase in the concentration of carbon dioxide in the atmosphere has been pointed out, but it is known from the global scale that the concentration of carbon dioxide is greatly different depending on time and place. When you analyze such atmospheric carbon dioxide concentration with a supercomputer and condense it for about 3 minutes for one year, it will be such a movie.
NASA | A Year in the Life of Earth's CO2 - YouTube
This shows the carbon dioxide concentration of the Earth on January 1, 2006. You can see that the red part is concentrated in the northern hemisphere where the concentration of carbon dioxide is high.

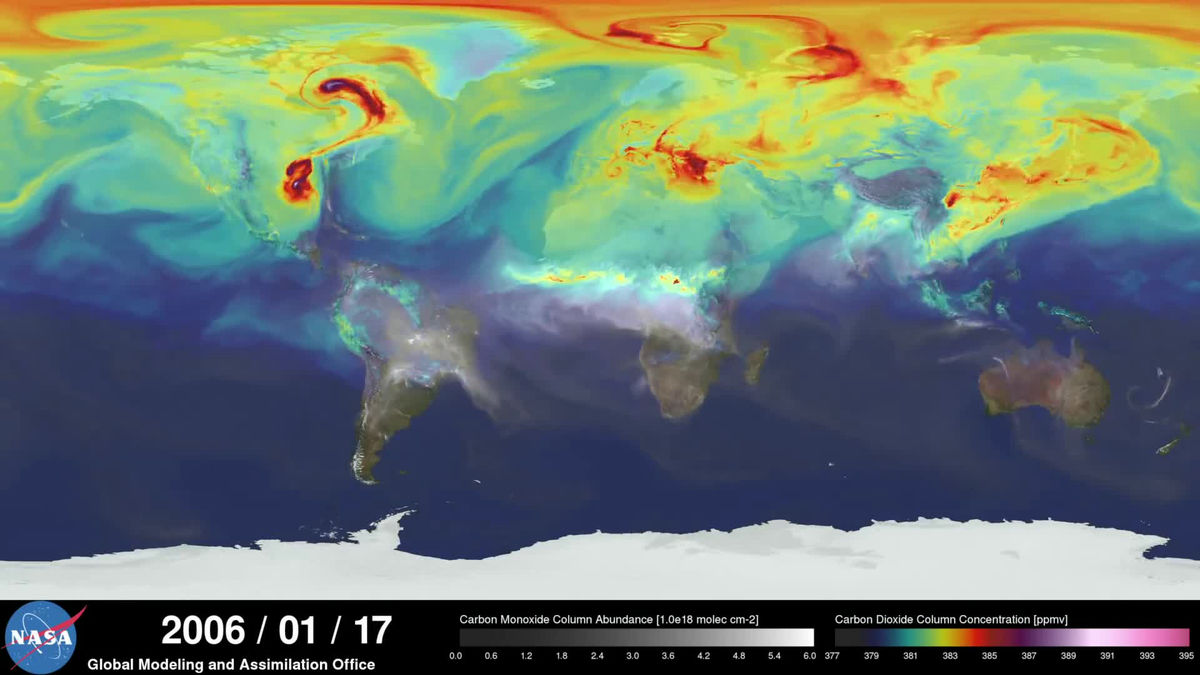
The range where carbon dioxide concentration gradually increases is increasing.
You can see that the carbon dioxide concentration spreads as if it drips the ink in the water.
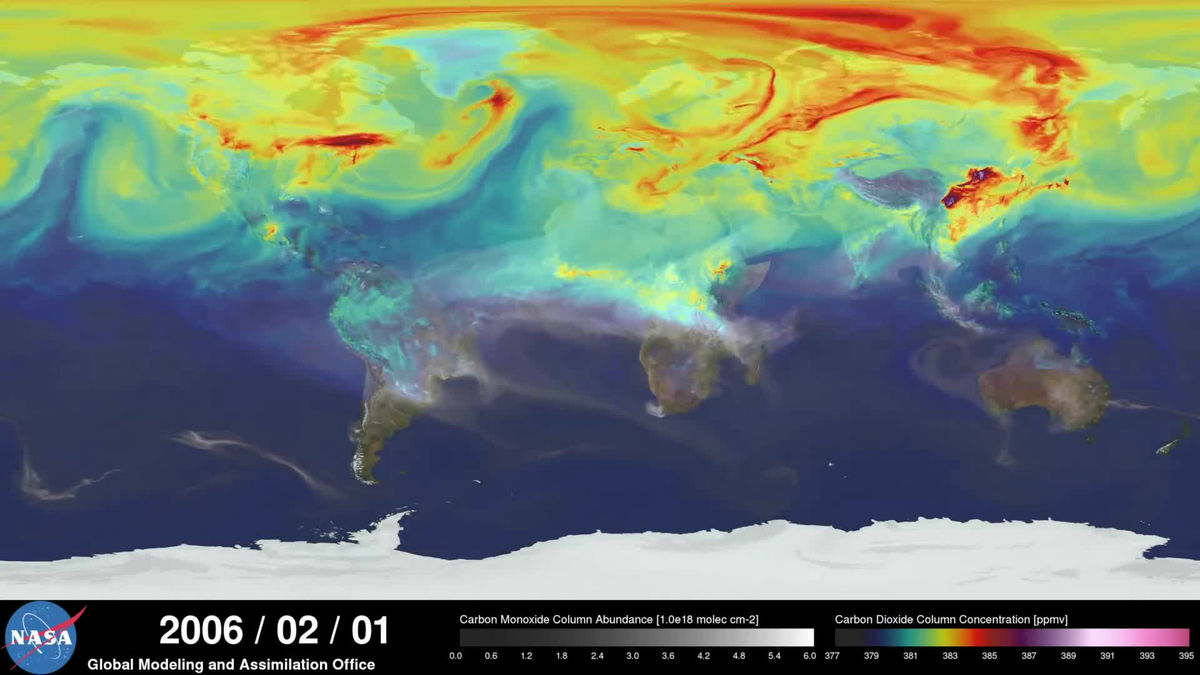
February 1. Carbon dioxide that keeps on standing without stagnation is like a living thing.
March 1st.
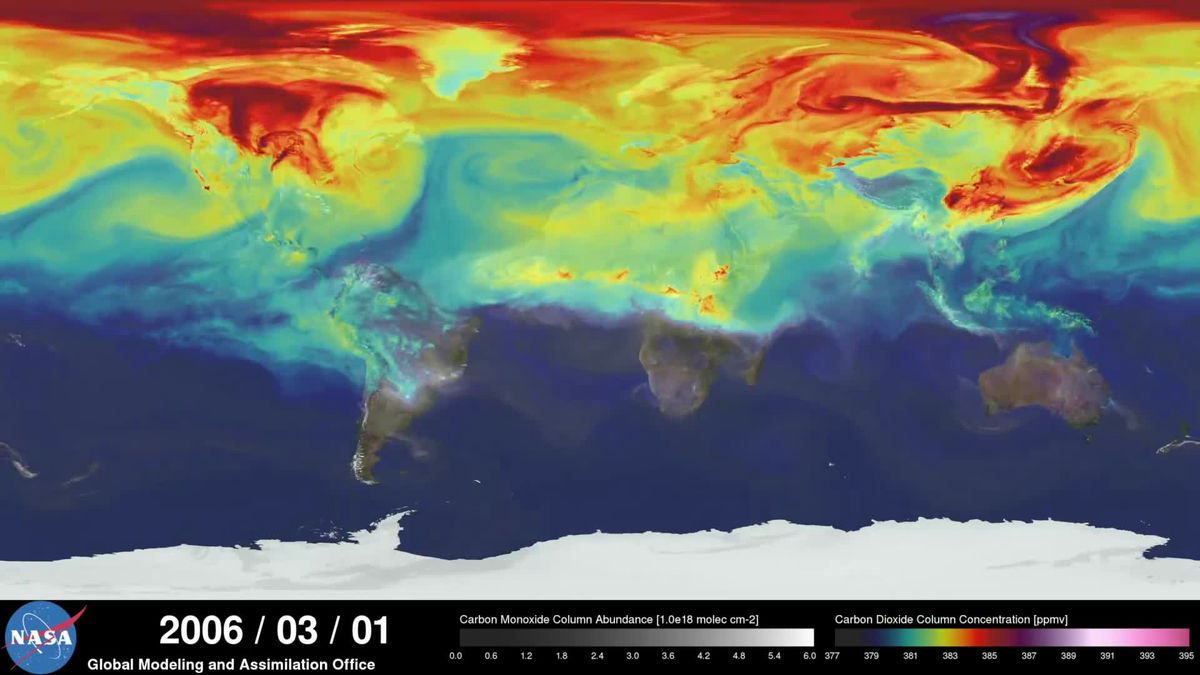
April 1st. As time goes by, the carbon dioxide concentration rises steadily.

May 1st. The carbon dioxide concentration reaches the highest level, and the northern hemisphere is almost reddish.
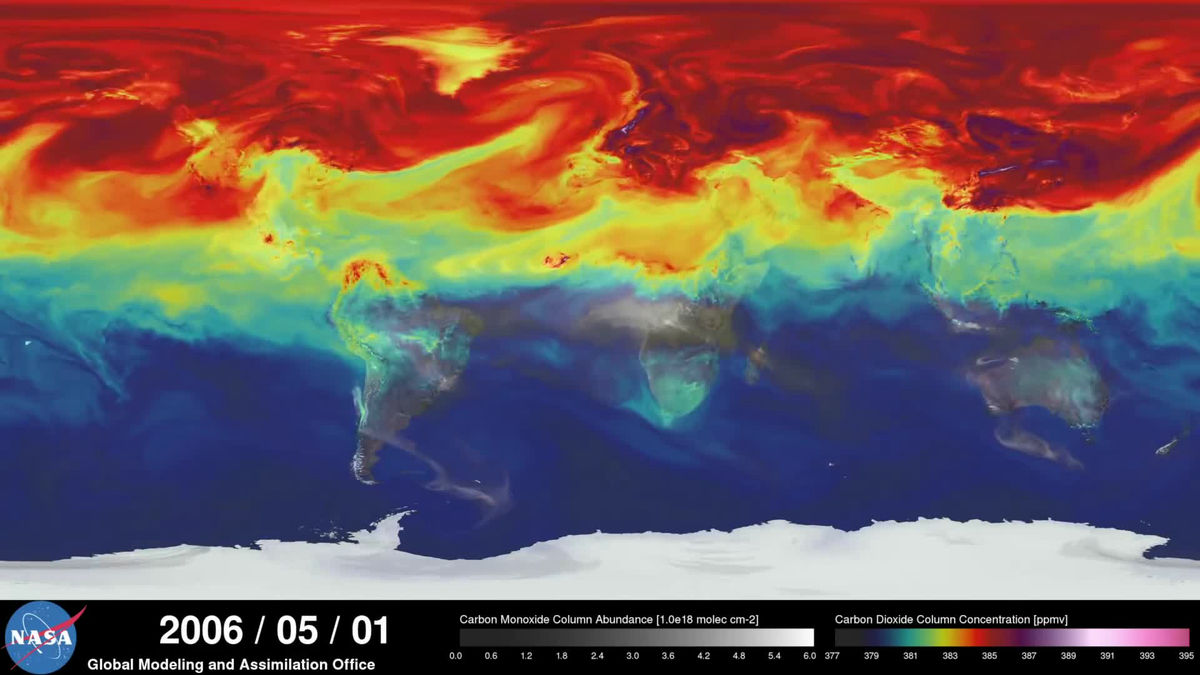
Carbon dioxide concentration began to decline from May to June.
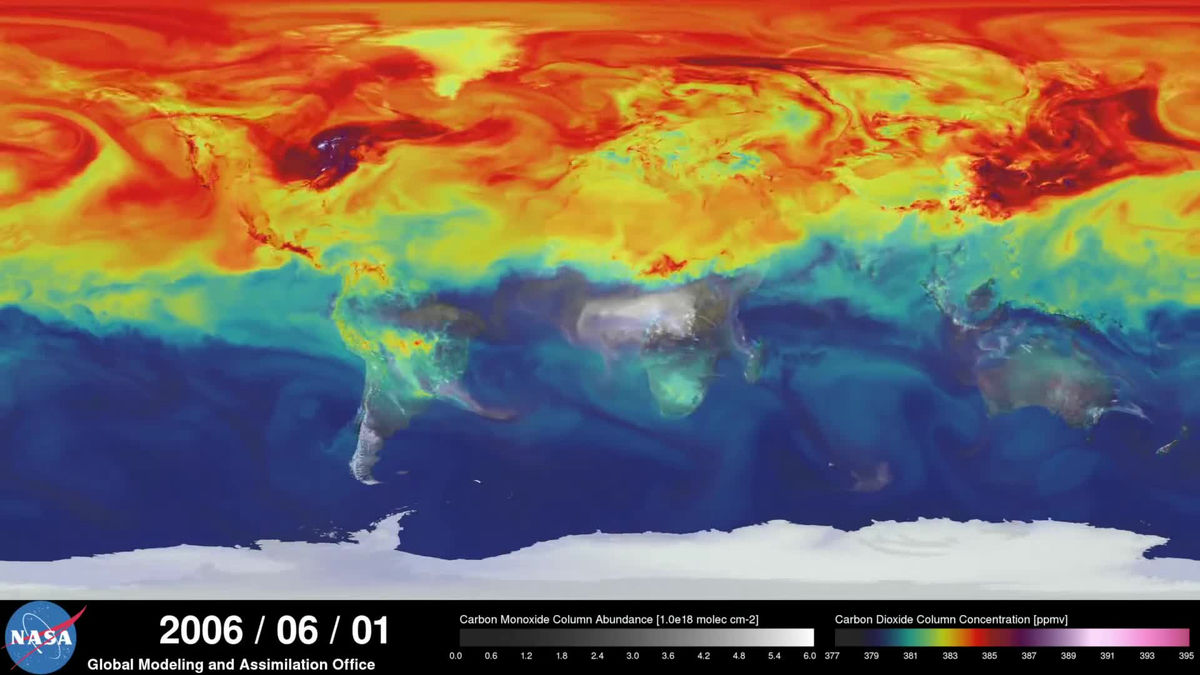
This is because the photosynthesis of plants becomes active from spring to summer, so carbon dioxide in the atmosphere is absorbed by plants and decreases.
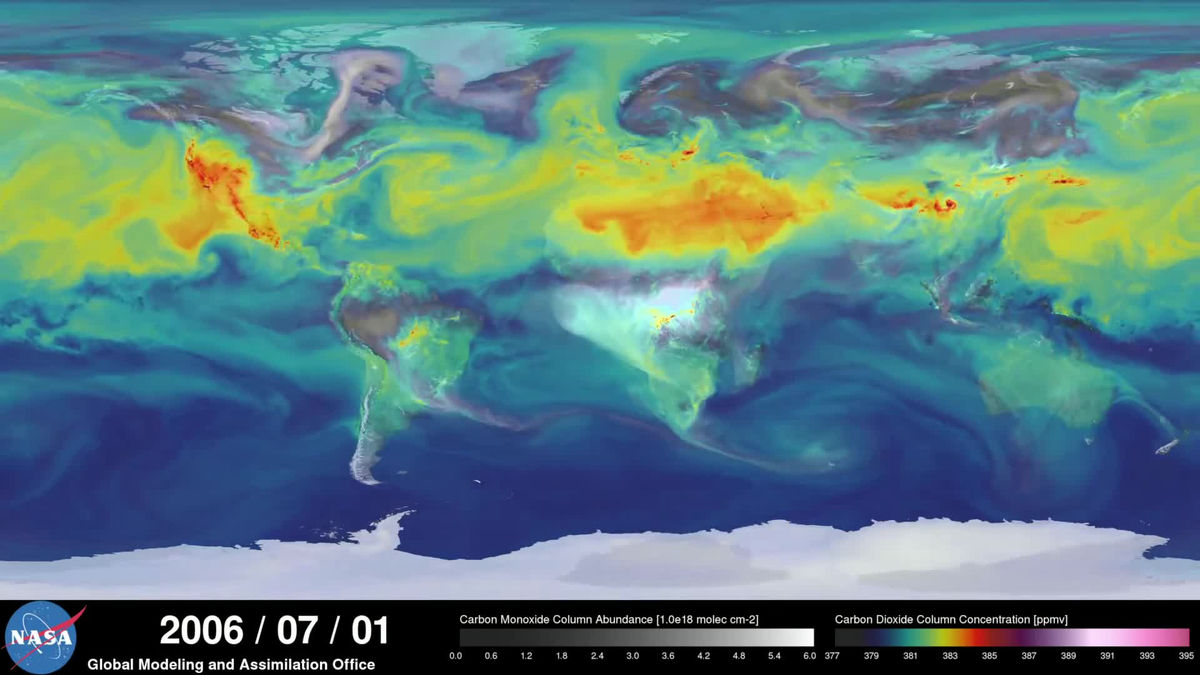
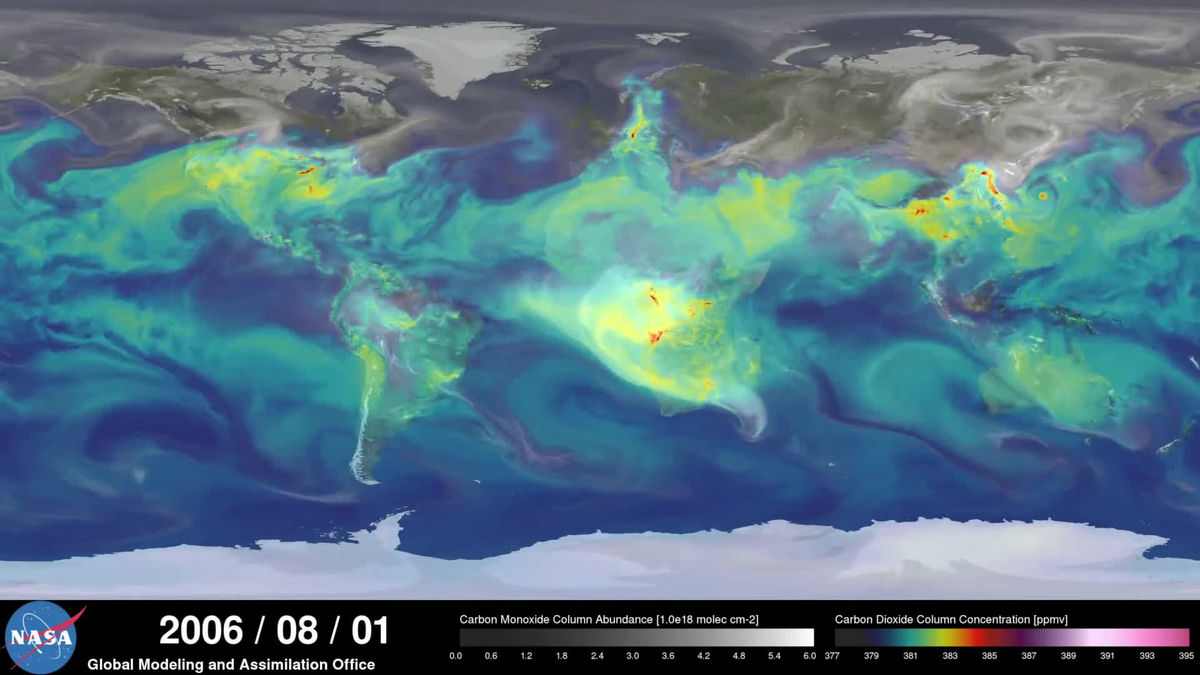
Aug. 1. The concentration of carbon dioxide in the northern hemisphere of midsummer drops sharply.
September 1. In the southern hemisphere on the way of changing the season from winter to spring, you can see areas with high carbon dioxide concentration in some areas.
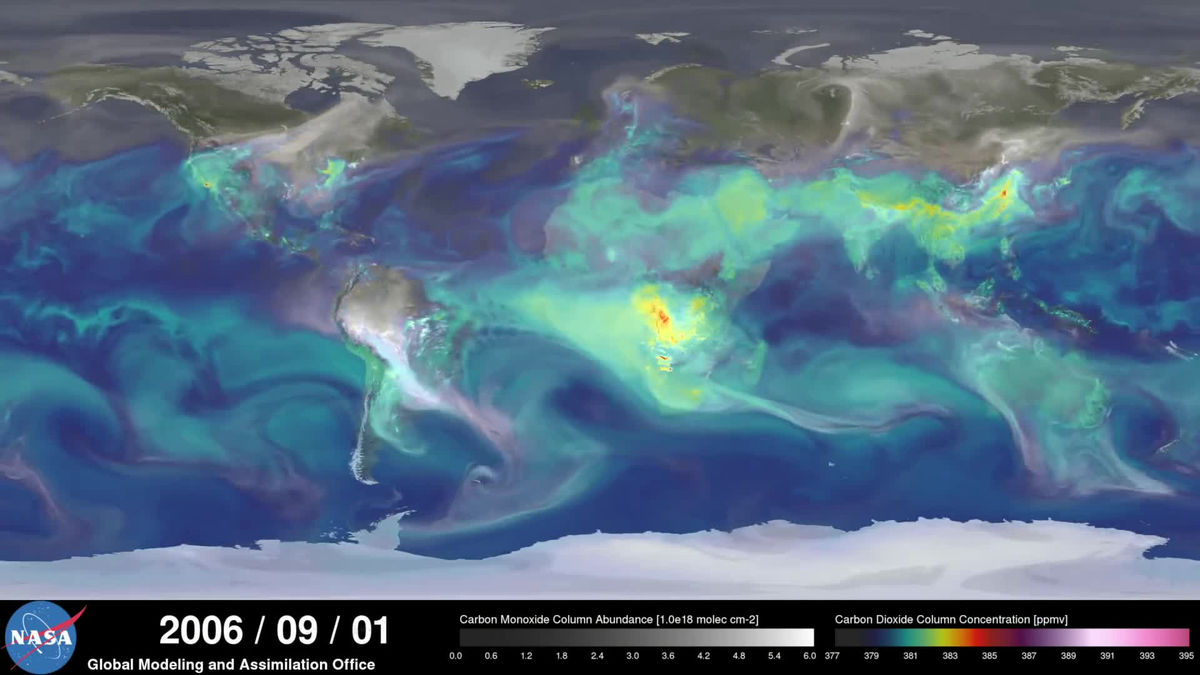
Carbon dioxide concentration changes greatly throughout the year due to changes in the climate and changes in the wind accompanying it.
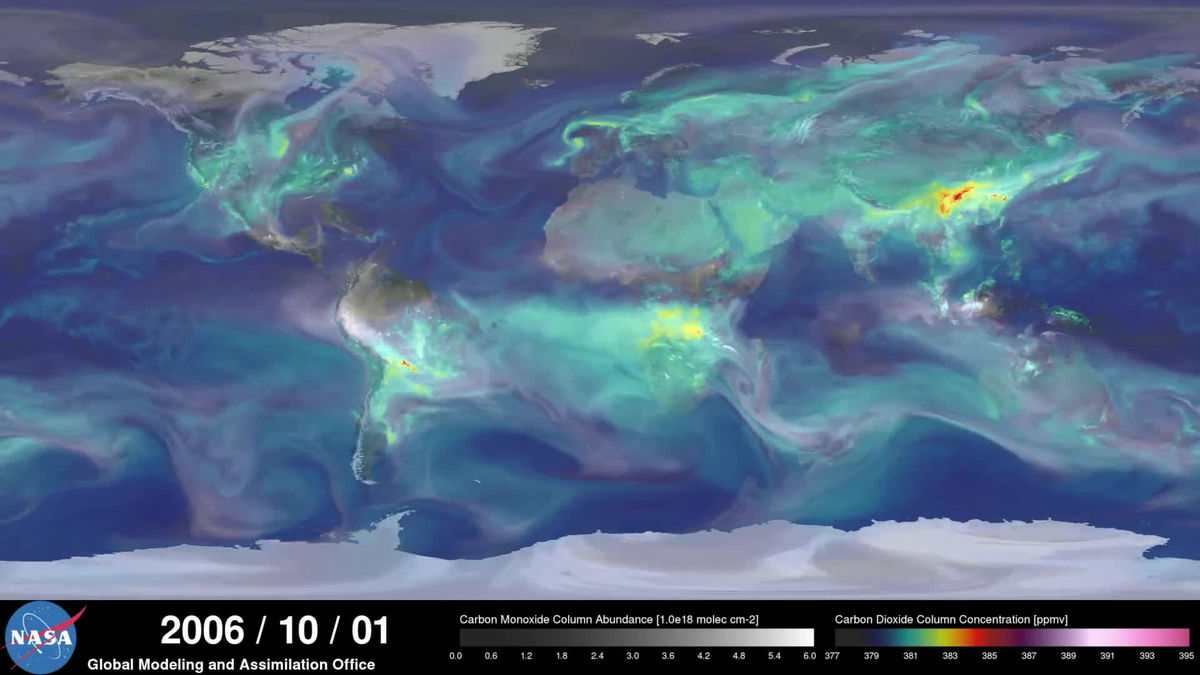
However, the pattern of change is almost the same every year every year.
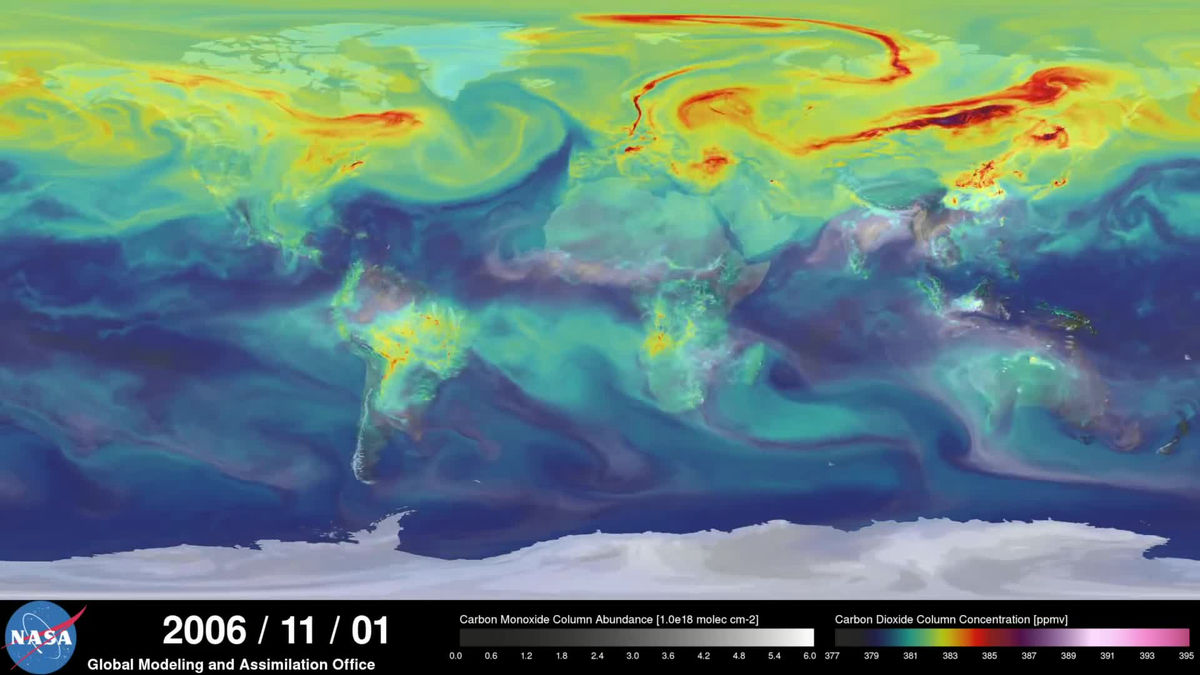
Again a large amount of carbon dioxide began to gather in the northern hemisphere.
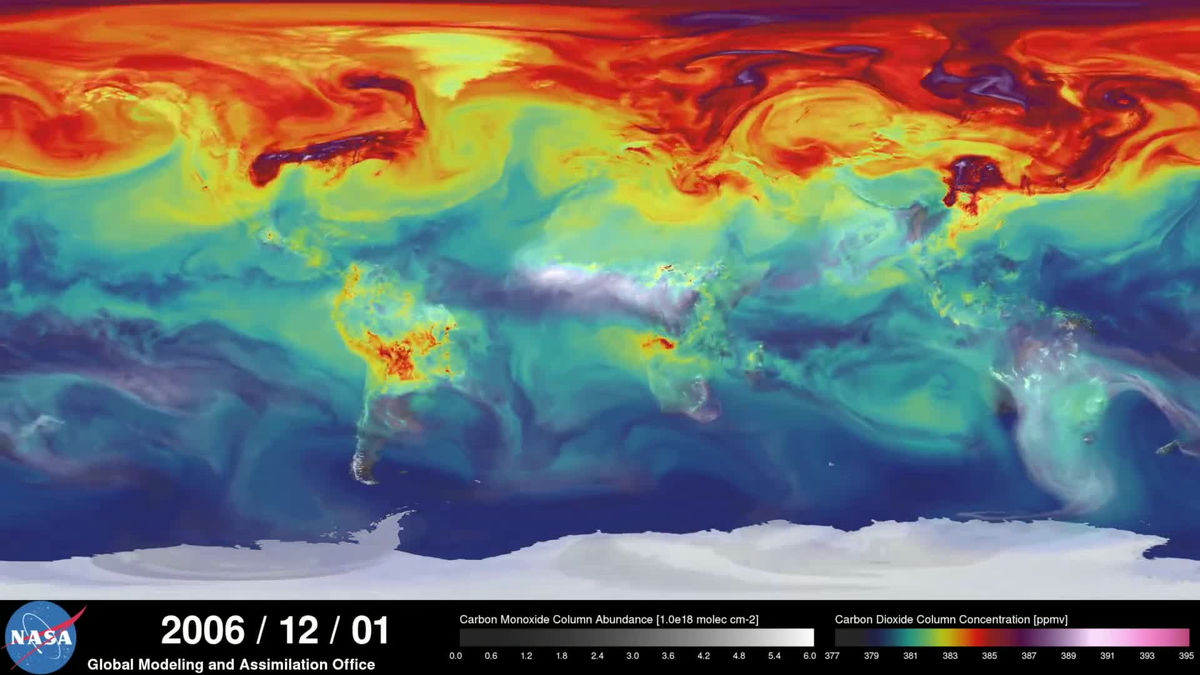
This movie, NASA observation satelliteOCO, OCO-2,GEOS-5It was created based on data from etc. Carbon dioxide is invisible, but in a long span of one year the concentration seems to change greatly depending on the season and place.
Related Posts: