A graph clearly showing the real cause of the world becoming warming surprisingly
ByLos Alamos National Laboratory
The influence which seems to be caused by 'global warming' where the average temperature on the earth rises, such as glacier retreat or abnormal weather, has become seen in various parts of the world. The theory that the cause is a greenhouse gas such as carbon dioxide emitted by human activities is the most influential, but it is said that there are other influences due to changes in aerosol (particulate matter) and land use I have done it. I will discuss various things that can be thought of as such,Climate modelWhen verified by the simulation using, the real cause is surprisingly clearly seen as a result.
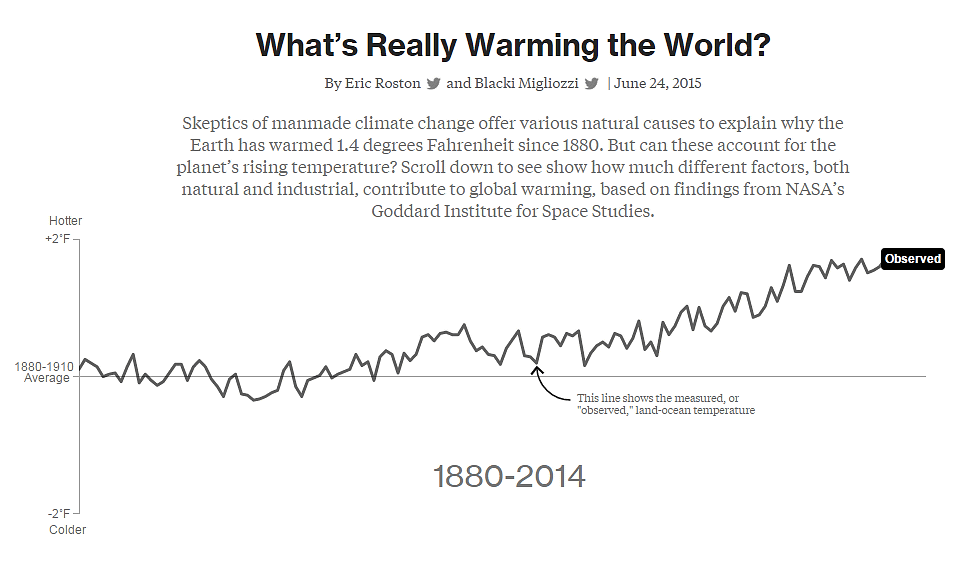
What's Really Warming the World? Climate deniers blame natural factors; NASA data proves otherwise
http://www.bloomberg.com/graphics/2015-whats-warming-the-world/
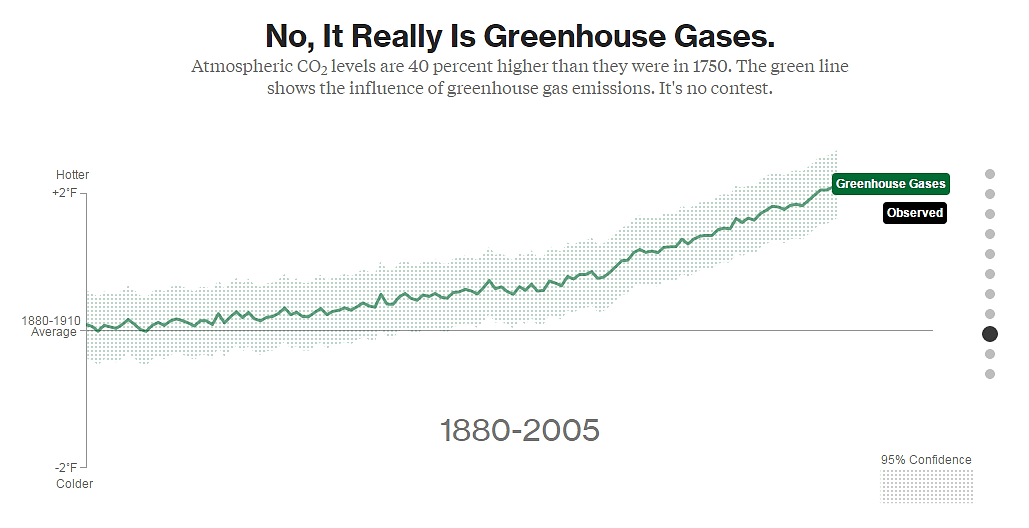
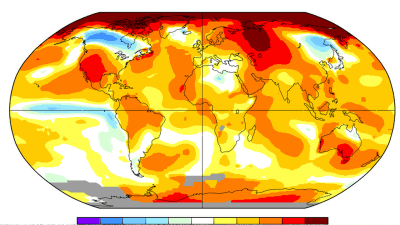
On the site, we can grasp the correlation with global warming at a glance by plotting the change in average temperature in the whole world and various data on the same graph. Firstly, the black graph displayed represents the average temperature from 1880 to 2014. Based on the average temperature in the 30 years from 1880 to 1910, it is about 1.4 degrees Ka in the past 100 years About 1 degree) You can see that the temperature is rising.
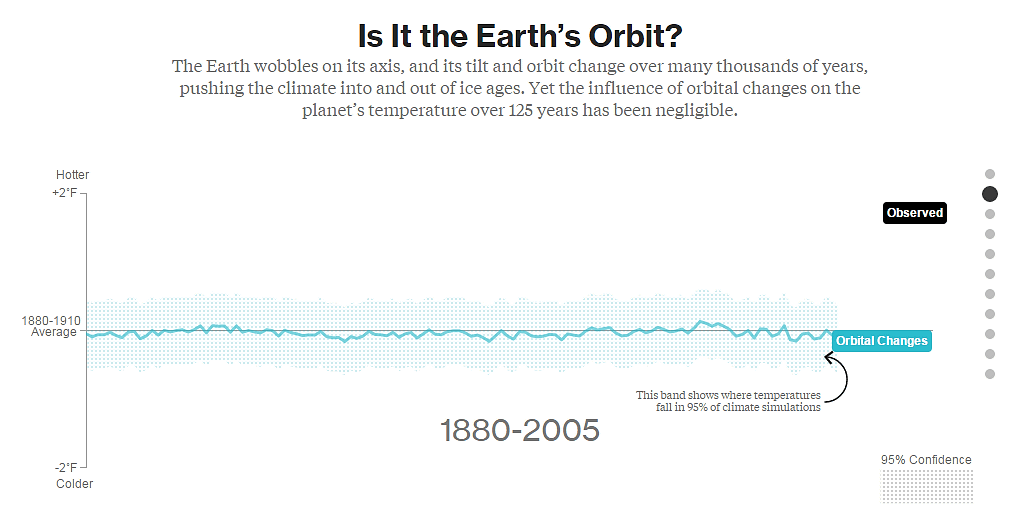
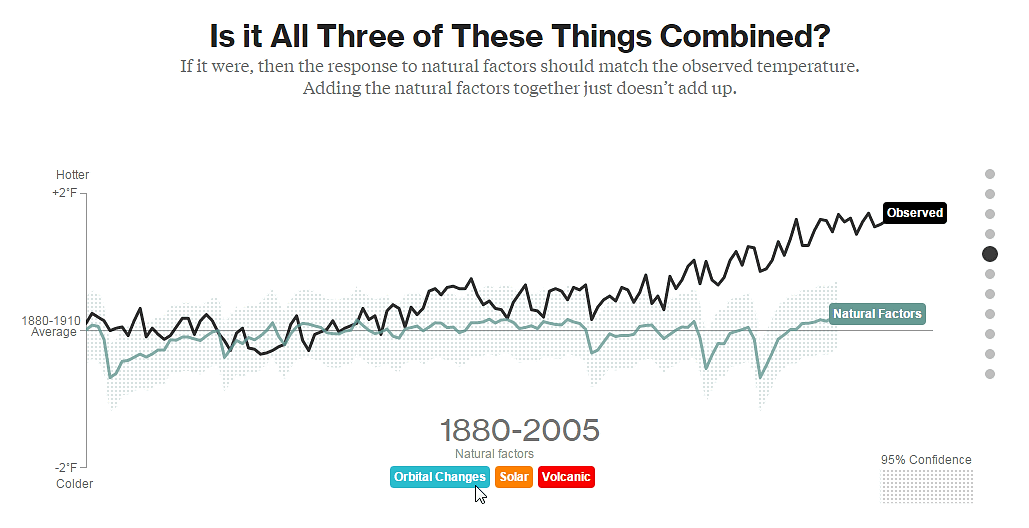
From here we will draw various data on the graph. Firstly, here is a graph showing the influence of changes in the distance between the earth and the sun. Although it is known that the orbit of the earth's revolution is not constant, it is known that it is constantly changing, but basically it is repeatedly approaching and moving within a certain range. Naturally as the energy approaches the sun increases, the temperature rises, but apparently the relationship with global warming seems to be slight.
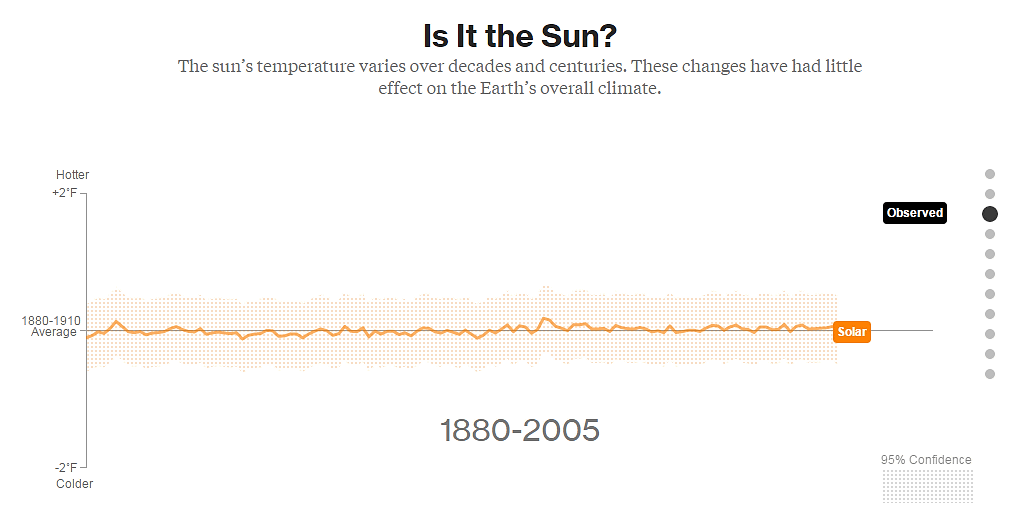
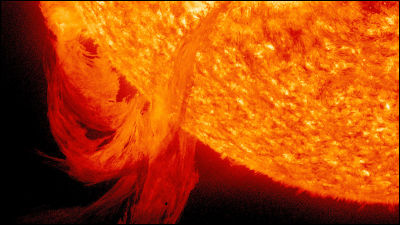
Next, I showed the temperature change of the sun itself. In the long time, the sun also increases or decreases the activity power, but here also we can not see the correlation with the temperature change of the earth.
I turned my eyes to the Earth itself this time. Although this graph shows the effect of volcanic activity on the earth, there is no correlation as well. When the volcano erupts, carbon dioxide of the greenhouse effect gas is released, but it is slight as compared with human activity, and at the same time, since the sulfuric acid compound having the cooling effect is released to the atmosphere, the function of decreasing the temperature There are also things.

A graph that combines the three natural data up to this point is kore. Even if we bundle three, we found that it is not correlated with the black graph showing the change in temperature. On the site, it is possible to check while switching over three graphs.
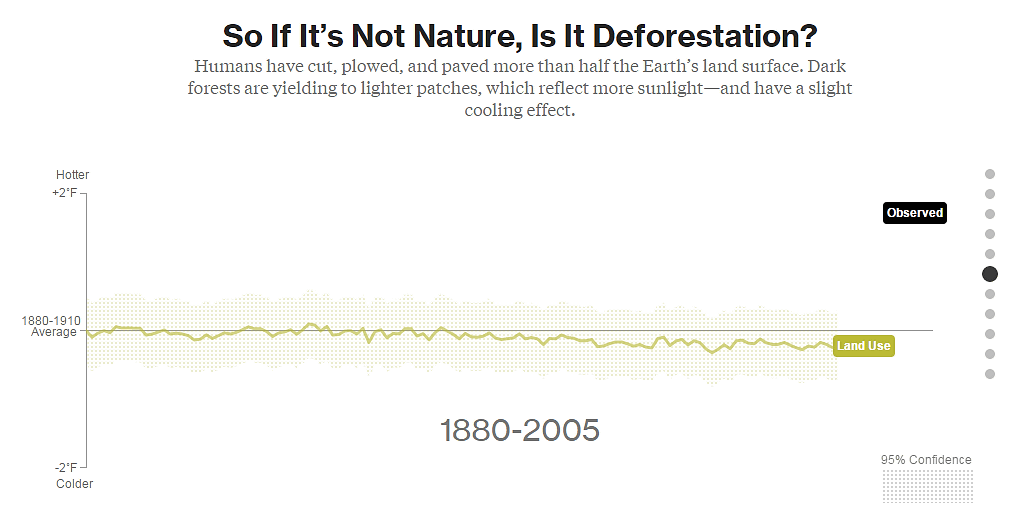
If natural phenomenon is not the cause, what is the influence of human activity? First of all, we compare it with data of deforestation. In the past 100 years, mankind has cleared many forests into flatlands, but compared with the forest where trees are lively, the flatlands reflect more sunlight, rather they have the effect of lowering the temperature .
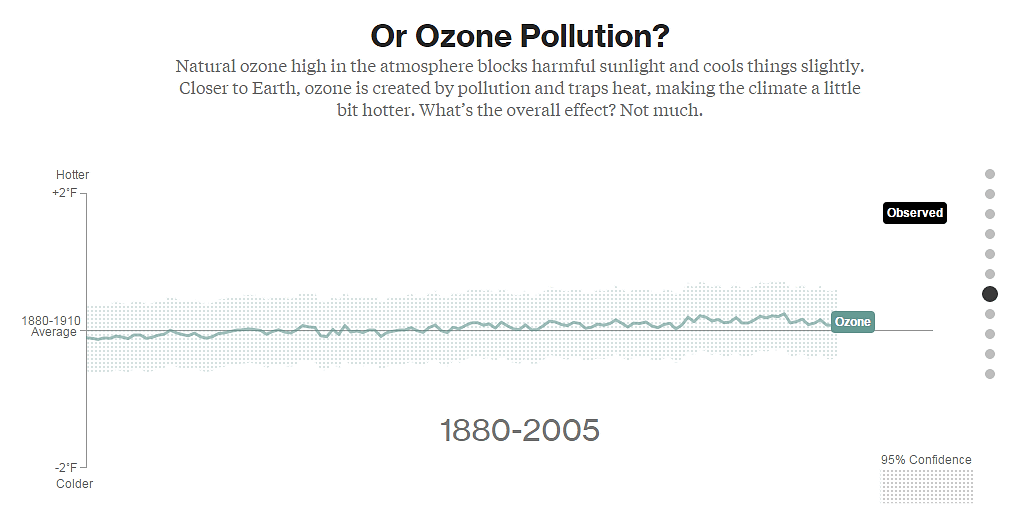
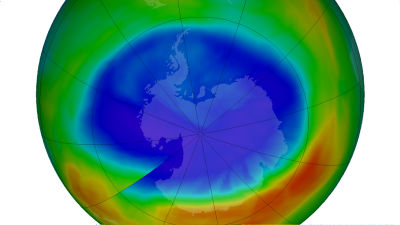
A graph showing the relationship between the increase and decrease of ozone (O 3) and global warming looks like this. Natural ozone present in the upper atmosphere of the atmosphere blocks the harmful sunlight and has the effect of cooling the earth, while greenhouse effect is seen in ozone generated from air pollution occurring near the surface of the earth . The effect of ozone is slightly increasing, but its scale is limited.
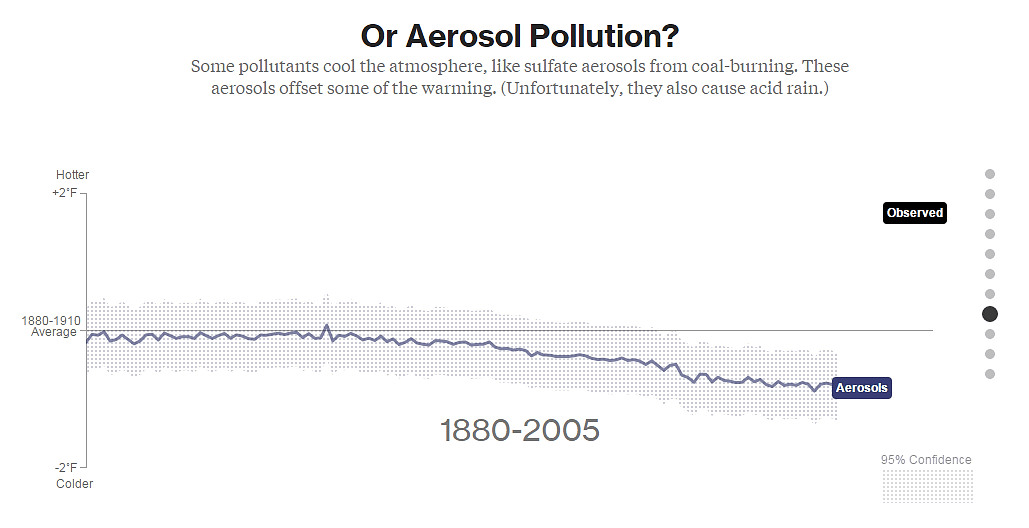
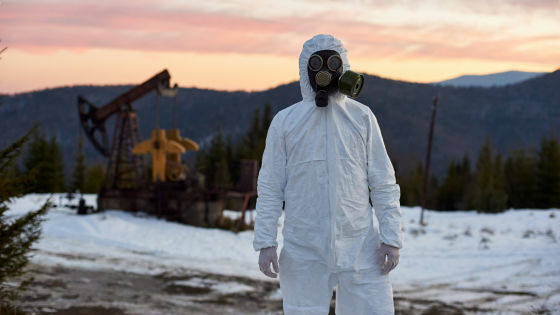
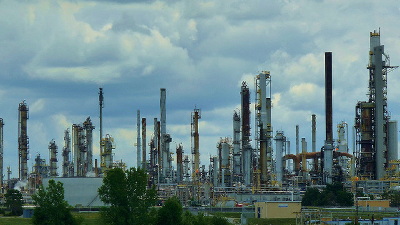
The influence of aerosol in the atmosphere is kore. The particulate matter such as the sulfate aerosol that is emitted when burning coal has a cooling effect, so it acts in the direction of cooling the earth rather, it causes acid rain to fall on the ground.
The last appearance is the effect of so-called "greenhouse gas" such as carbon dioxide. As you can see at a glance, you can see clearly that it shows a global warming effect rising to the right.
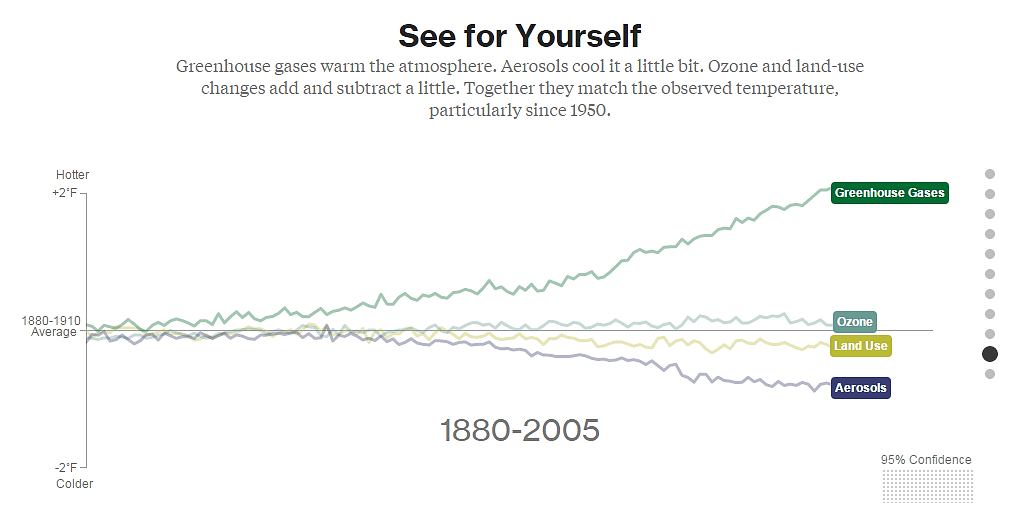
It is like this when you list the effects of greenhouse gases, ozone, deforestation and aerosol. In other words, it is a composition that warming by greenhouse gas and ozone shows a slight resistance to deforestation and cooling effect by aerosol, but in any case, it seems that an event that is not favorable for the earth is occurring .
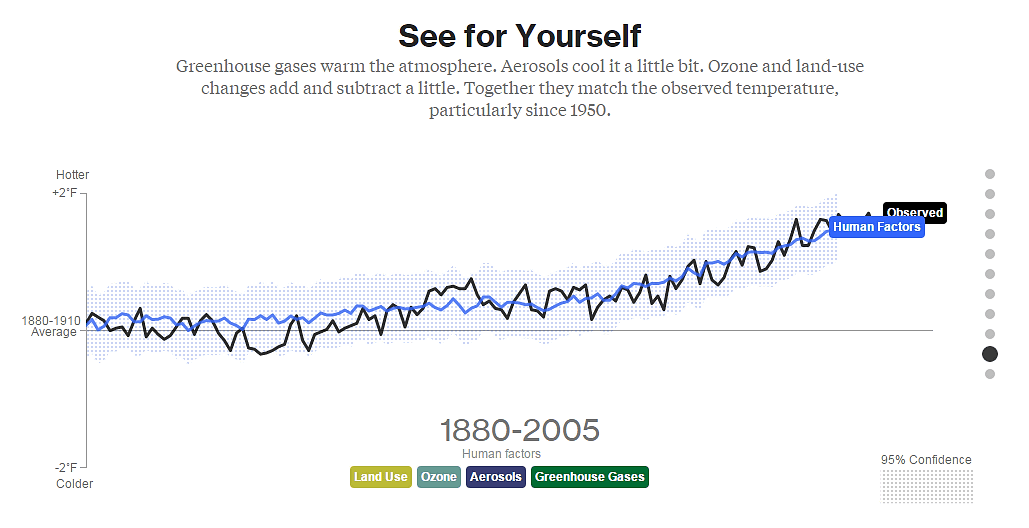
It is like this when collecting the influences (Human Factors) by human activities. In particular, in the area from the center of the graph to the right, there is clear correlation between the rise in the temperature of the earth and no other result.
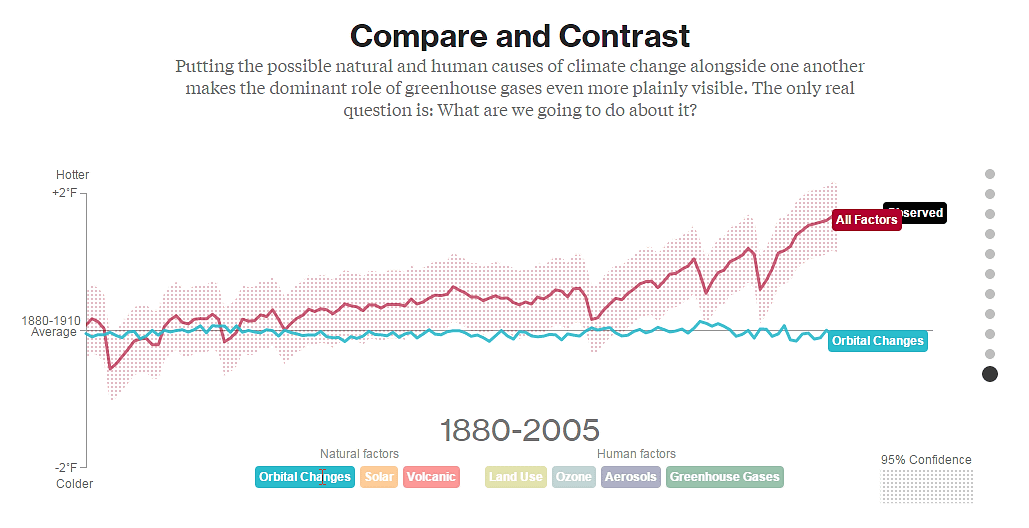
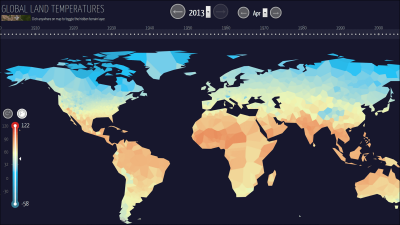
In the last graph, it is now possible to switch all the data that has appeared so far and compare. As you can see clearly, actually it was a graph that made me realize that greenhouse gases have a big influence.
As of 2015, there are laboratories dealing with around 28 global climate models around the world,61 kinds of climate modelsResearch is being conducted to simulate climate such as ocean, ice, atmosphere and so on. This graph shows NASA'sGoddard Institute of Space and Astronautical Science(GISS) computer climate model "ModelE 2"It seems that it was created by running a 500,000 line simulation program on a super computer owned by NASA · Climate Simulation Center.
Related Posts:

in Note, Posted by darkhorse_log