`` Fast or Slow '' review that measures site display speed from all over the world for free
Many people who run their own sites and blogs are wondering, 'Is this site displayed crisply when viewed from other countries?' By using ' Fast or Slow ' that creates a detailed report on the user experience of the site just by entering the URL, you can grasp the display speed etc. of the site viewed from all over the world such as Europe, America, Asia and Australia at a glance I can do it.
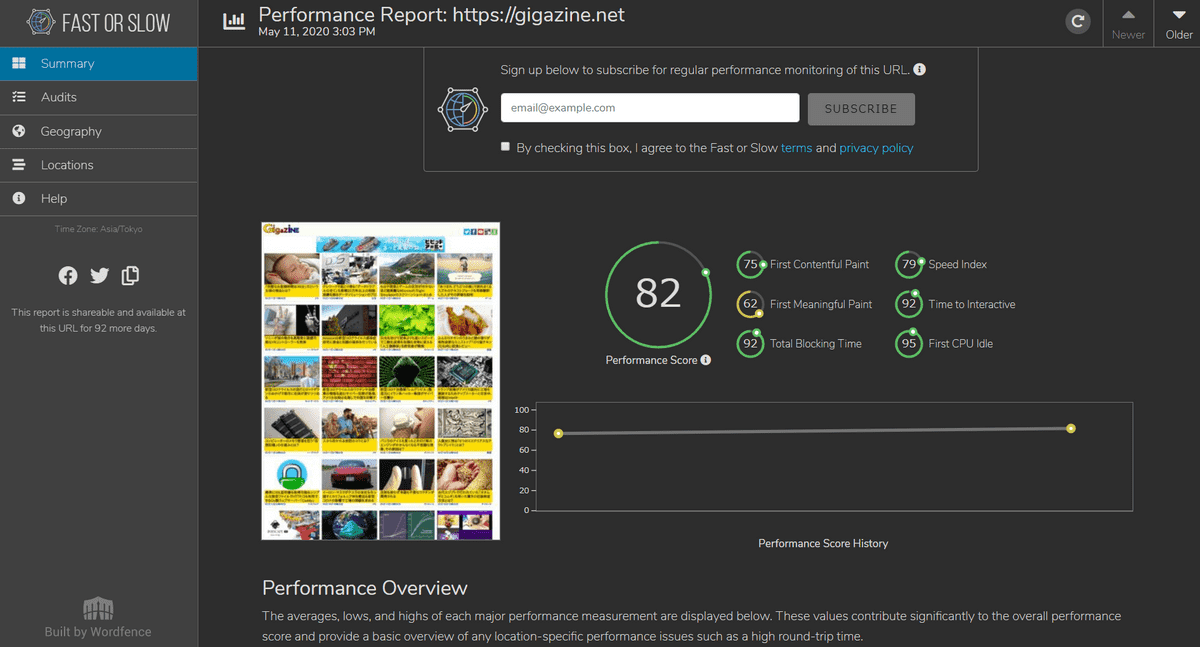
Start Profiling-Fast or Slow
When you access the above URL, the URL input field is displayed, so immediately enter 'gigazine.net' and click 'PROFILE'.

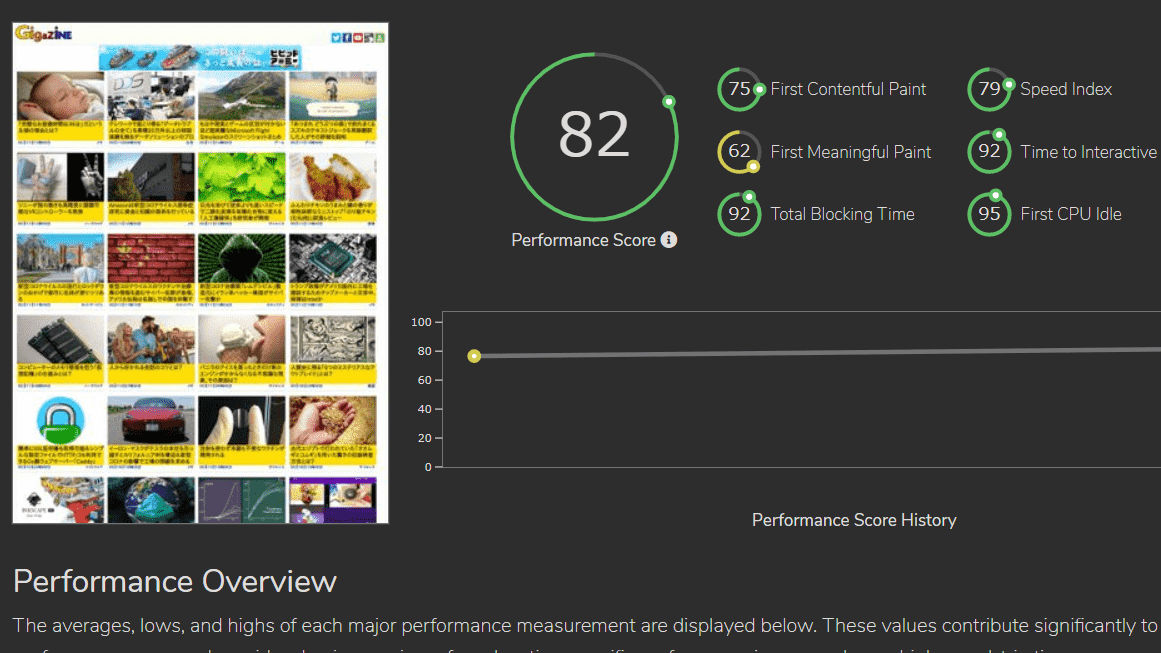
Then, the following report was displayed in about 10 seconds.
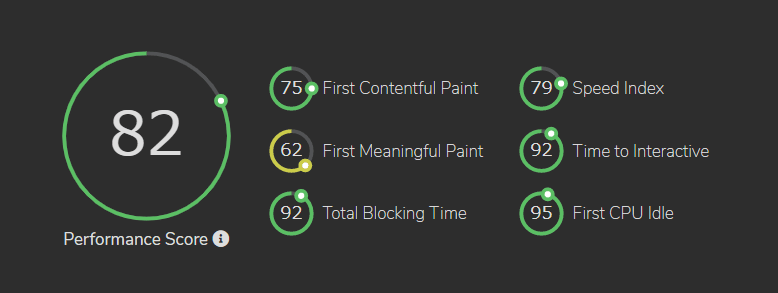
The results are 75 points for '
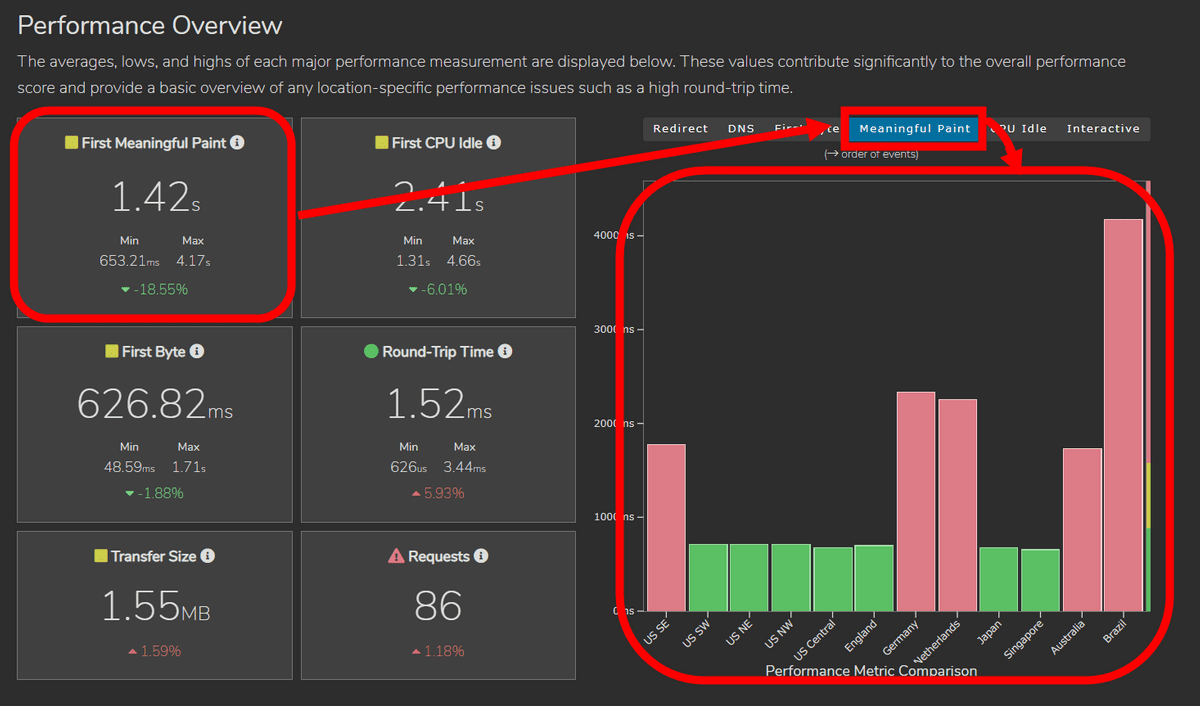
If you look underneath it, you can see the specific values for each item and the results for each region. For example, the result of 'First Meaningful Paint' is '1.42 seconds', but click 'Meaningful Paint' in the upper right and click 'Southeast America' 'Southwest America' 'Northeast America' 'Northwest America' 'Central America' Displaying bar charts for every 12 locations of 'UK', 'Germany', 'Netherlands', 'Japan', 'Singapore', 'Australia', and 'Brazil' shows relatively good results in the United States and Japan, while 4 in Brazil. You can see that it took an extremely long time of more than a second.
Scroll further down for advice on how to improve performance.
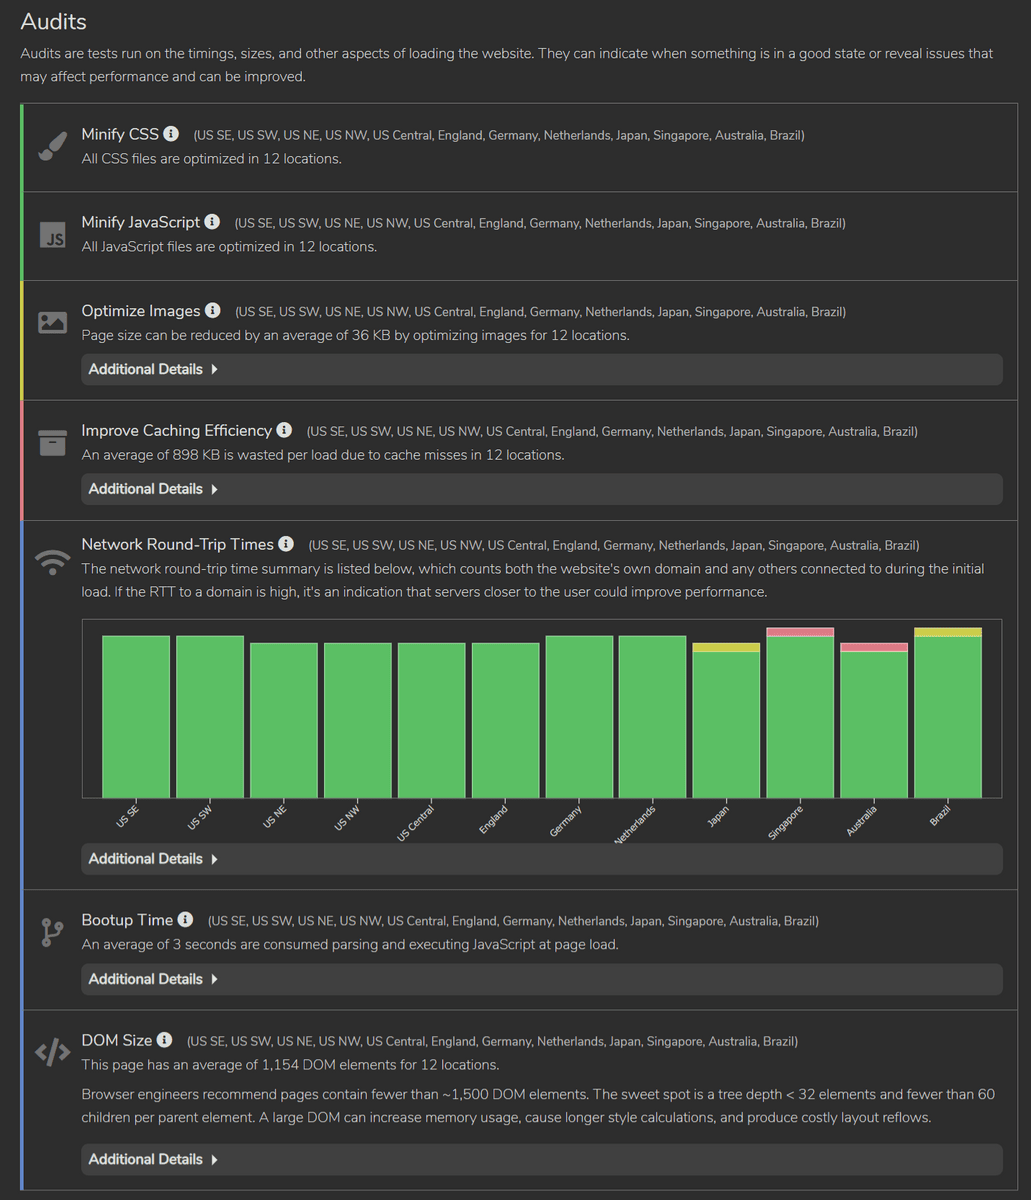
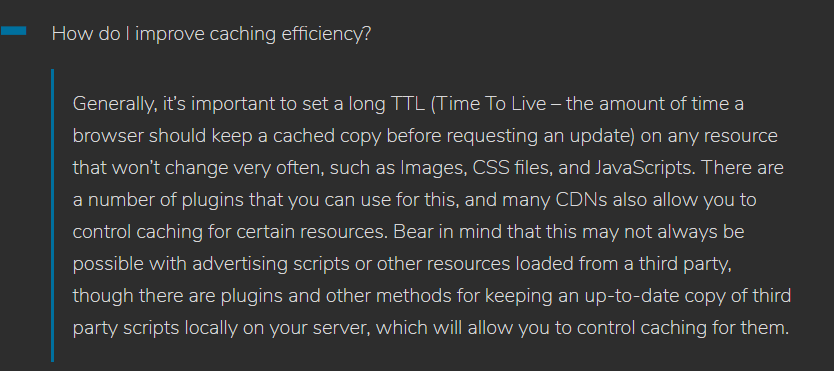
For example, in the 'Improve Caching Efficiency' item, '12 cache misses are wasting an average of 898KB per load'. Click the button with the red frame ...

Details about what to do specifically are displayed.
If you scroll further, you can see a map that shows the location of the area tested by 'Fast or Slow' and the network that connects each area on the world map.
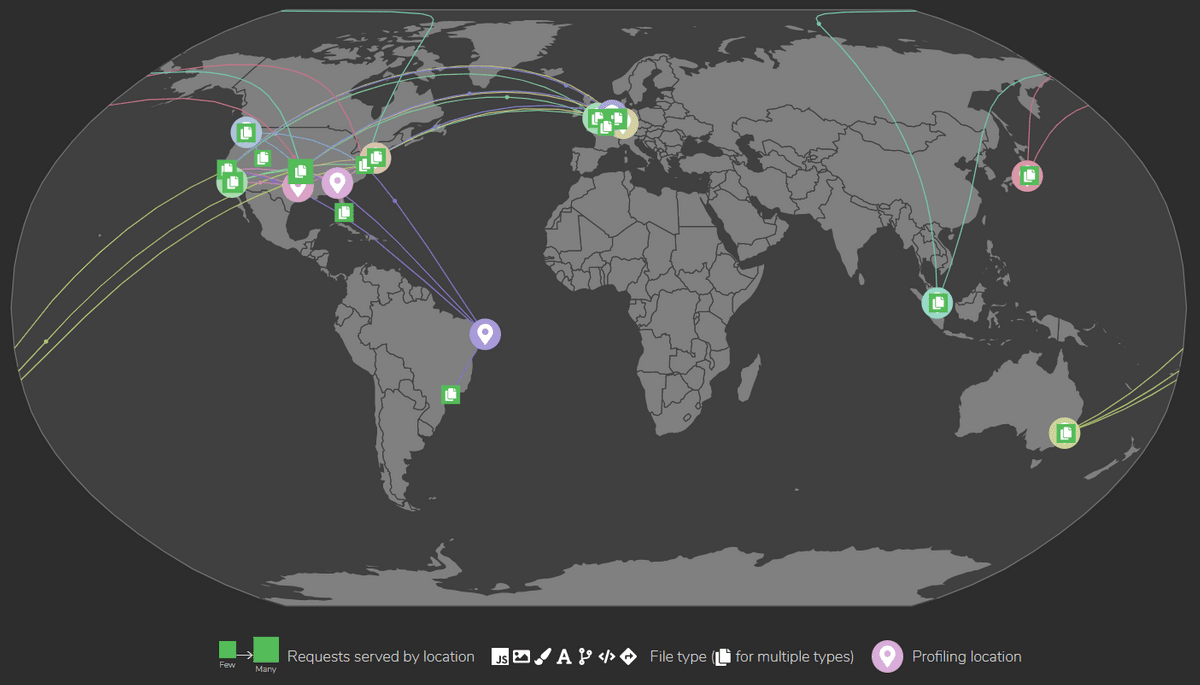
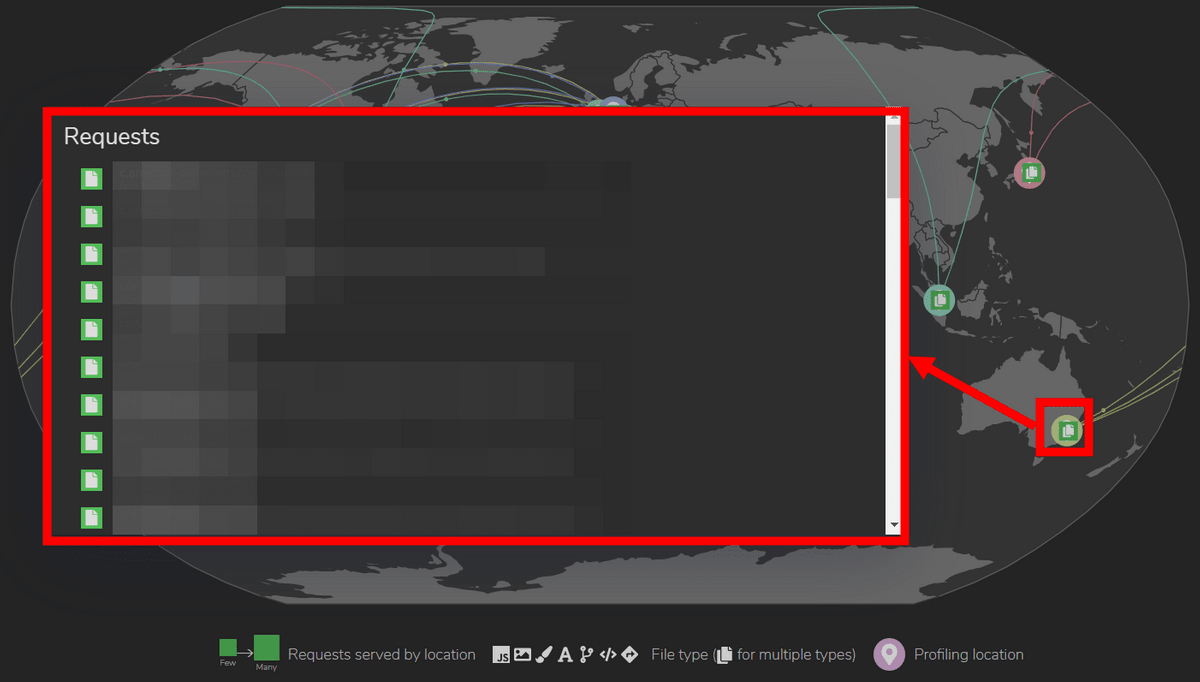
Click the icon displayed in the region to see the specific details of the page request used for the test.
Below that is the main score for each region. For example, even in the same United States, it can be seen that 'US Southeast' and 'US Southwest' have significantly different 'First CPU Idle' times of '3.59 seconds' and '1.39 seconds', respectively. I will. Also, if you click 'VIEW DETAIL' ...
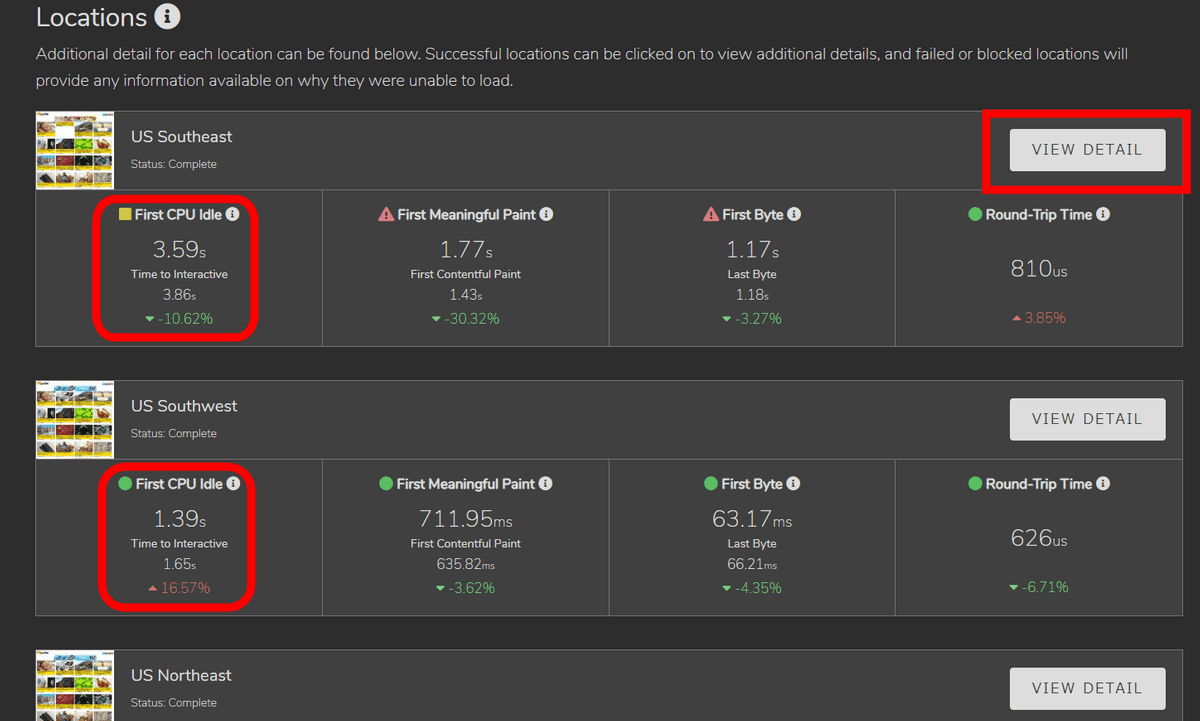
You can see a report that focuses on the above items in that region.

Related Posts:


in Review, Web Service, Posted by log1l_ks