Web application 'CHARTS FACTORY' that can create graph charts free of charge and save images and share with others
It is a statistical chart such as a graph chart that shows the data visually clearly. " CHARTS FACTORY " is a simple UI web application that allows you to create graph charts quickly with free registration, no need to save the created graphs in image format, and share graphs with others at URL.
CHARTS FACTORY
https://chartsfactory.com/
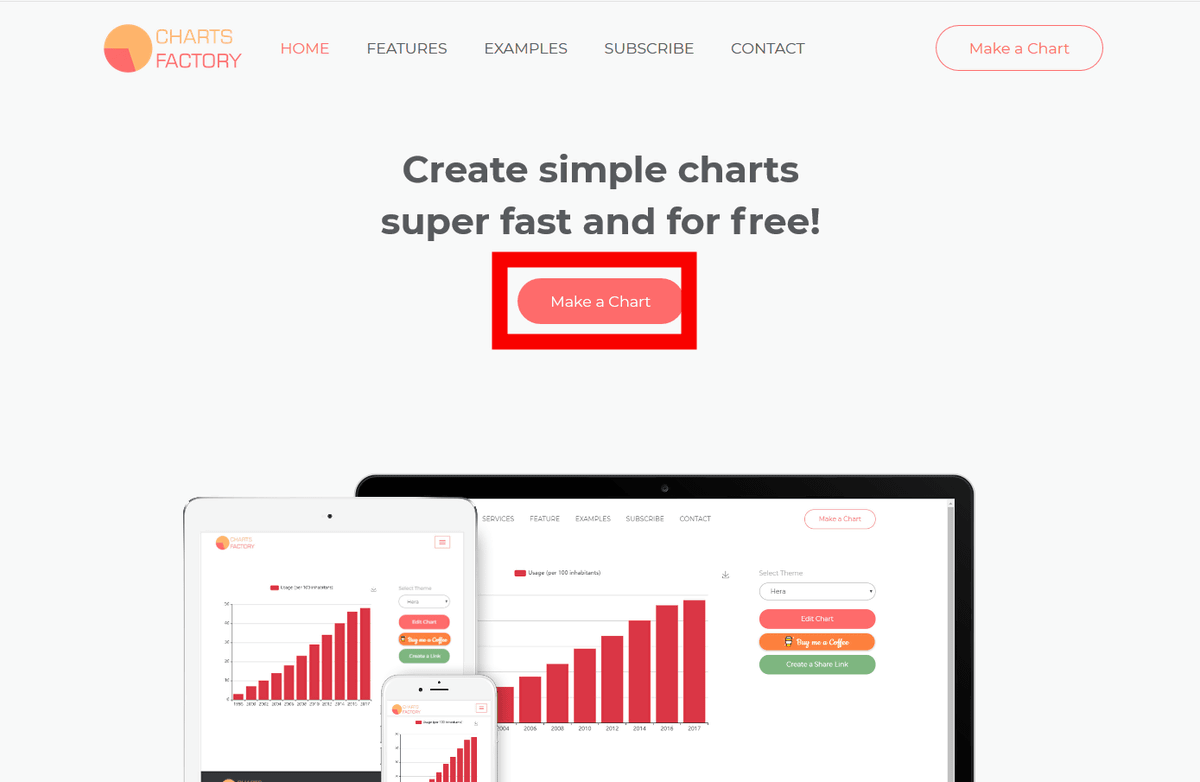
I actually try to make a graph using CHARTS FACTORY. Go to the page of CHARTS FACTORY and click "Make a Chart".
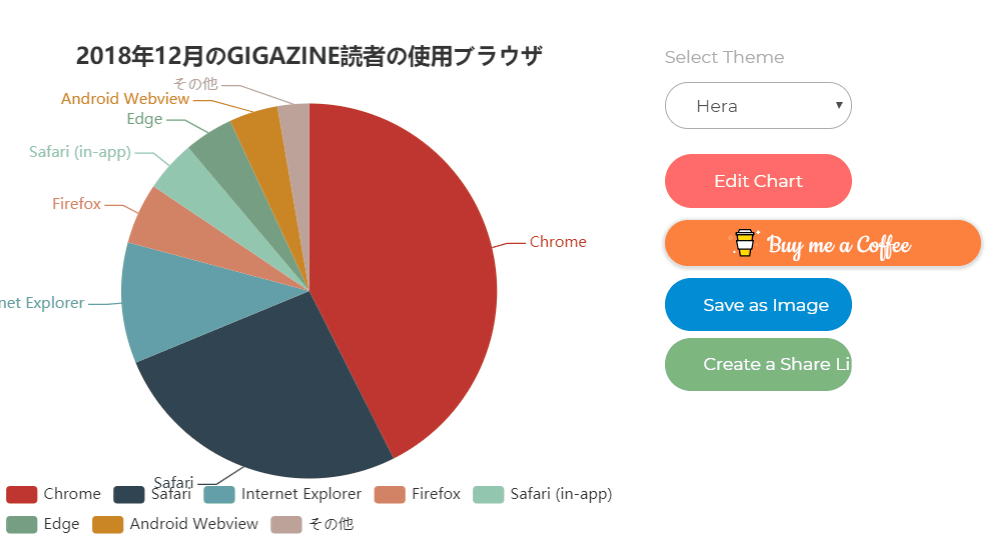
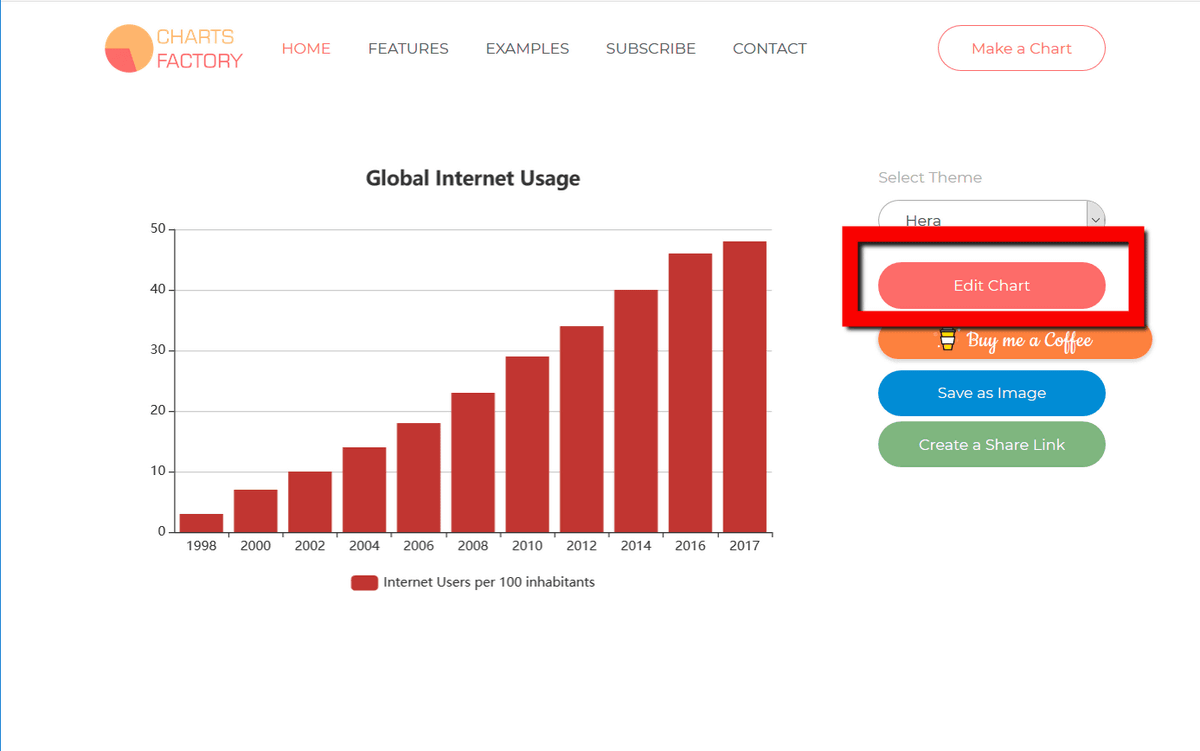
Then, with such feeling, the graph of "Global Internet Usage (worldwide Internet users)" is displayed at the beginning. This time we will use the access analysis result of GIGAZINE for December 2018 to display the browser used by GIGAZINE reader in December 2018 as a graph. Click "Edit Chart" to start creating the graph.
A bar will appear on the right side of the window. I will enter the data of the graph to be created in this bar.
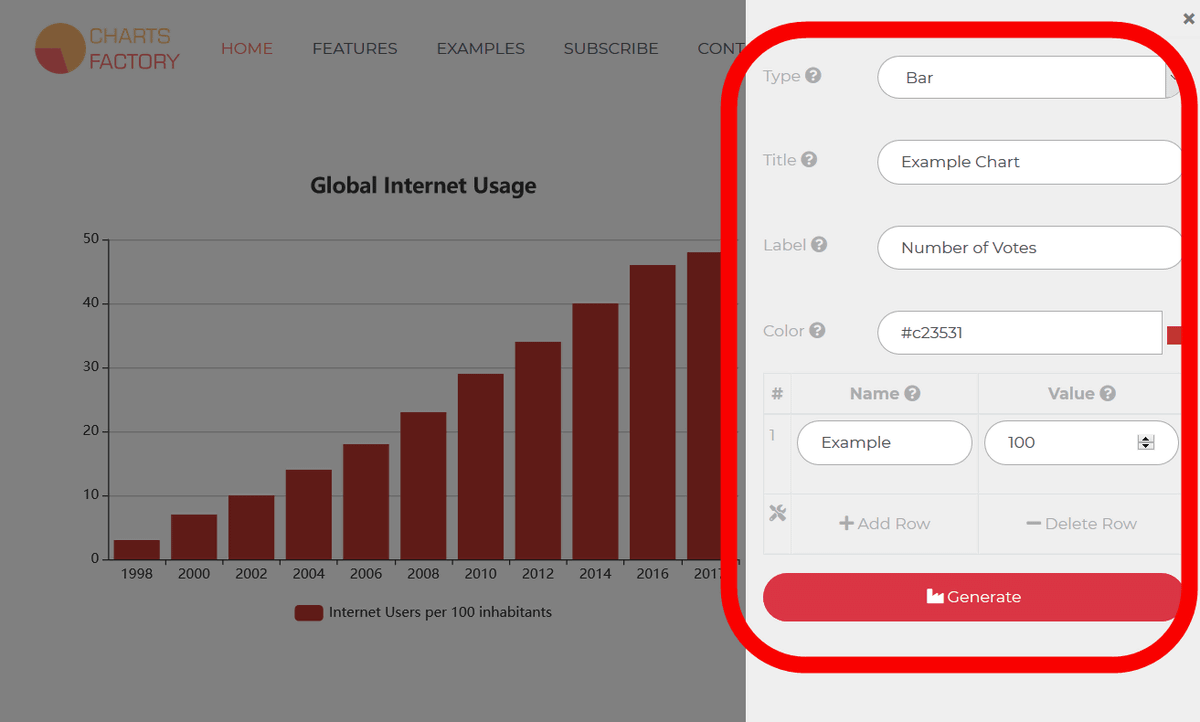
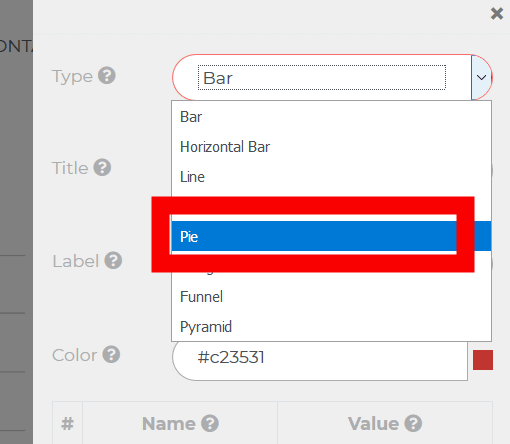
In "Type", select the type of graph you want to create. "Bar (Bar graph )" "Horizontal Bar" "Line graph line " Area "Area graph " "Pie ( pie chart )" " Donut graph " "Funnel ( funnel graph )" " There are options such as Pyramid (pyramid chart). For this time we will select "Pie (pie chart)" which makes the ratio easier to understand.
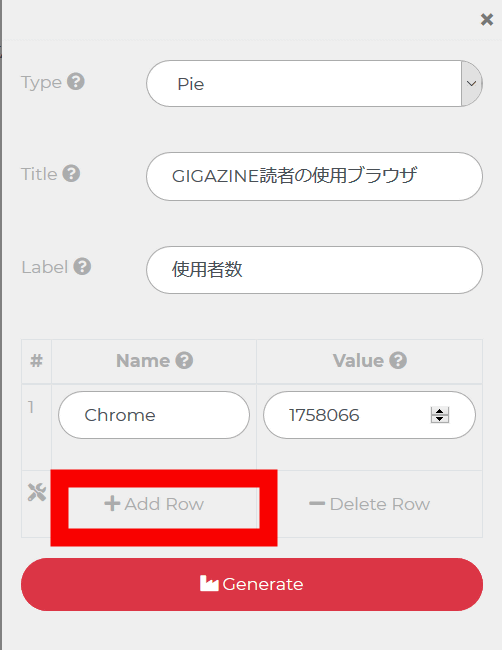
Enter the title of the graph in "Title" and the contents of the data to be tabulated as "Label". This time it was "respectively used by GIGAZINE readers of December 2018" "number of users".

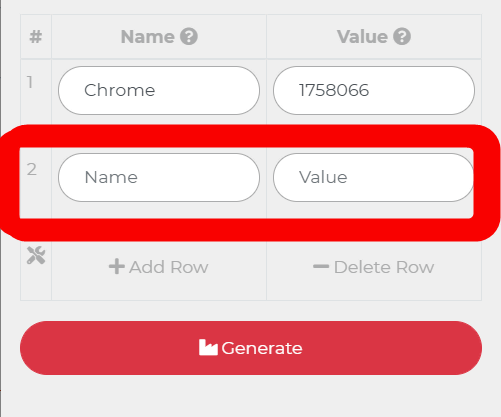
In the column for entering the statistical data to be used for the graph, look like this, enter the name of the statistical data in the left column and the numerical value on the right side. At first there is only one input field, but clicking "Add Row" ... ...
The entry field of statistical data increased by one. You can now incorporate multiple statistical data into the graph.
After entering all the statistical data in the input field created using "Add Row", click "Generate" to make the graph.

The created graph looks something like this. If you want to change the graph, you can change the contents of the graph at any time by clicking "Edit Chart".
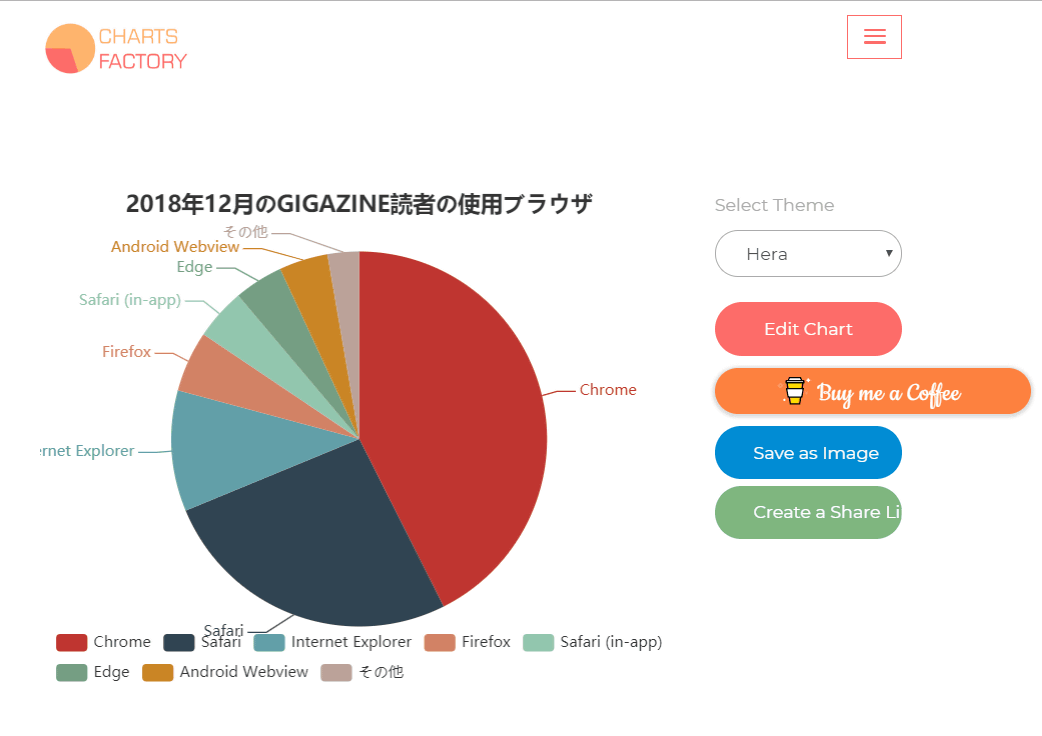
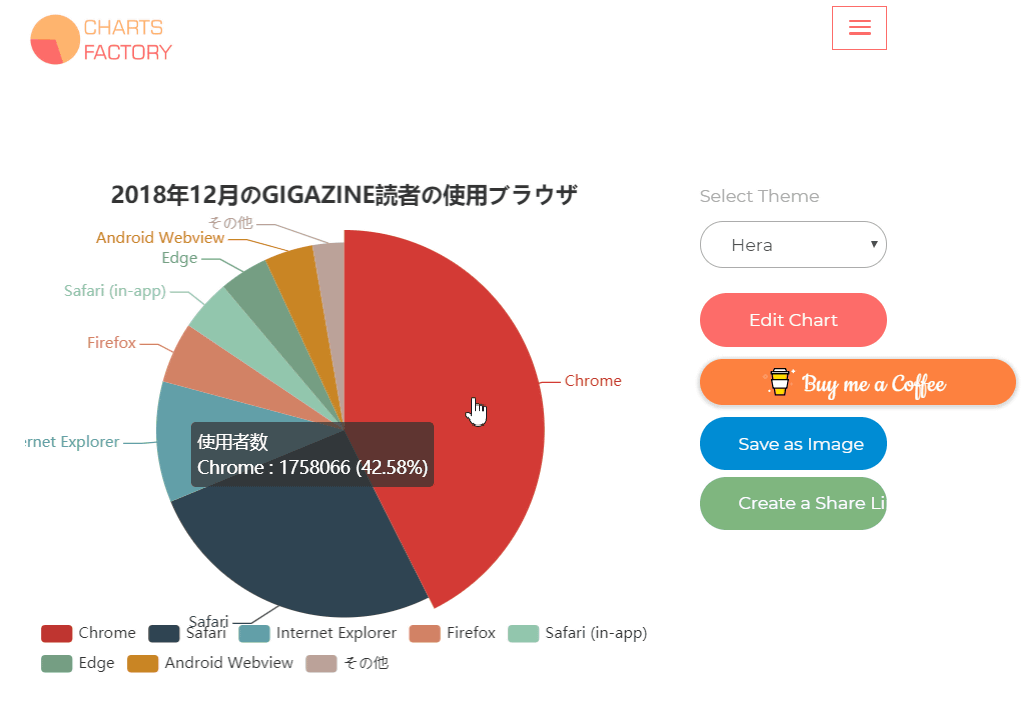
When placing the mouse cursor on the graph, statistical data is displayed. Since I made a pie chart this time, it also shows what percentage of each element is occupied by each element.
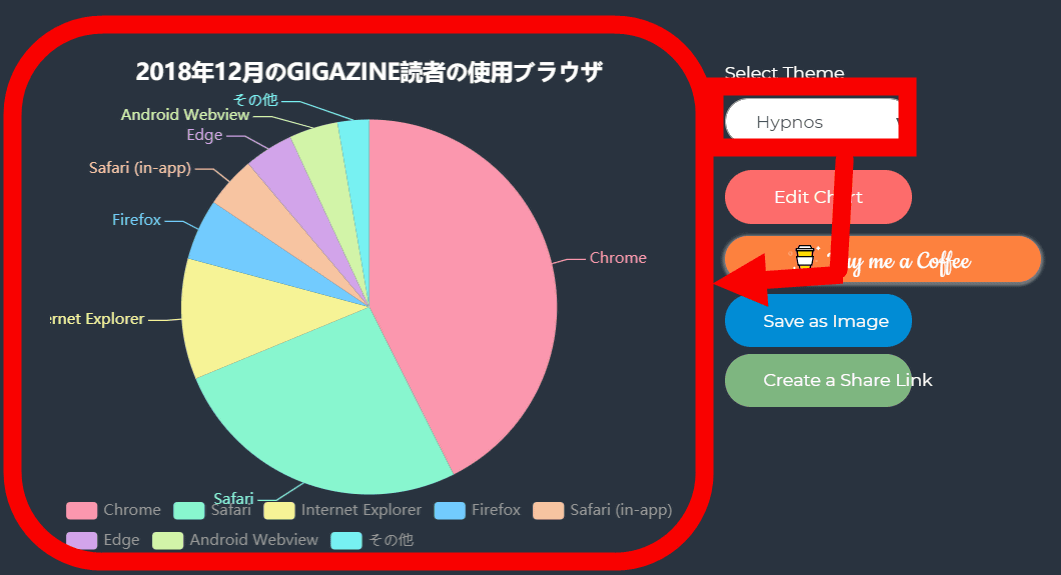
In "Select Theme" it is possible to add a grid or gradation to a character / graph / wall color change or wallpaper, or change the appearance of the graph. However, the choice is the name of the gods appearing in Greek mythology such as "Zeus" "Hades", etc. It is difficult to know "what design is" from the name of choice.
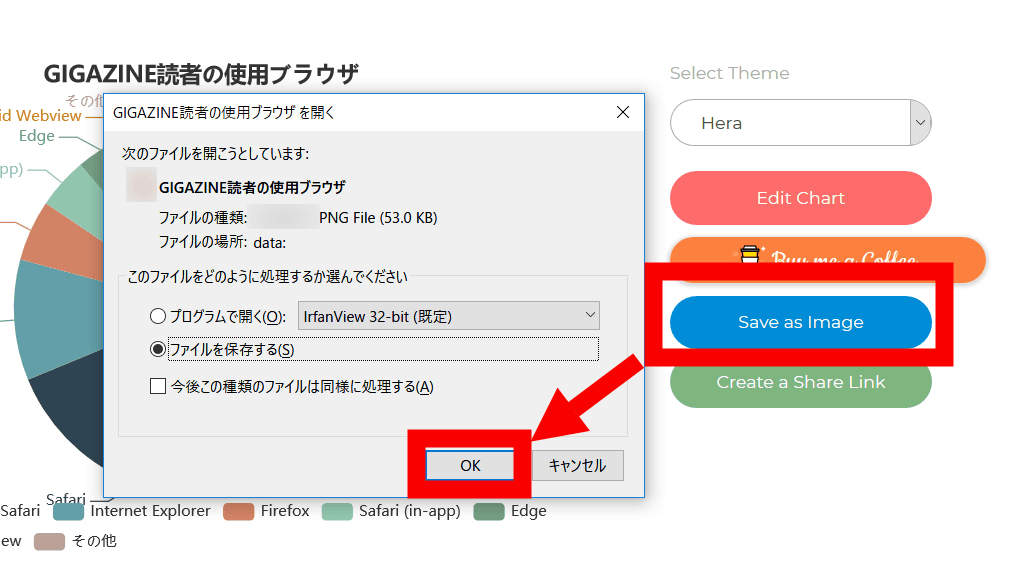
By clicking "Save as Image", it is possible to download the created graph in png format.
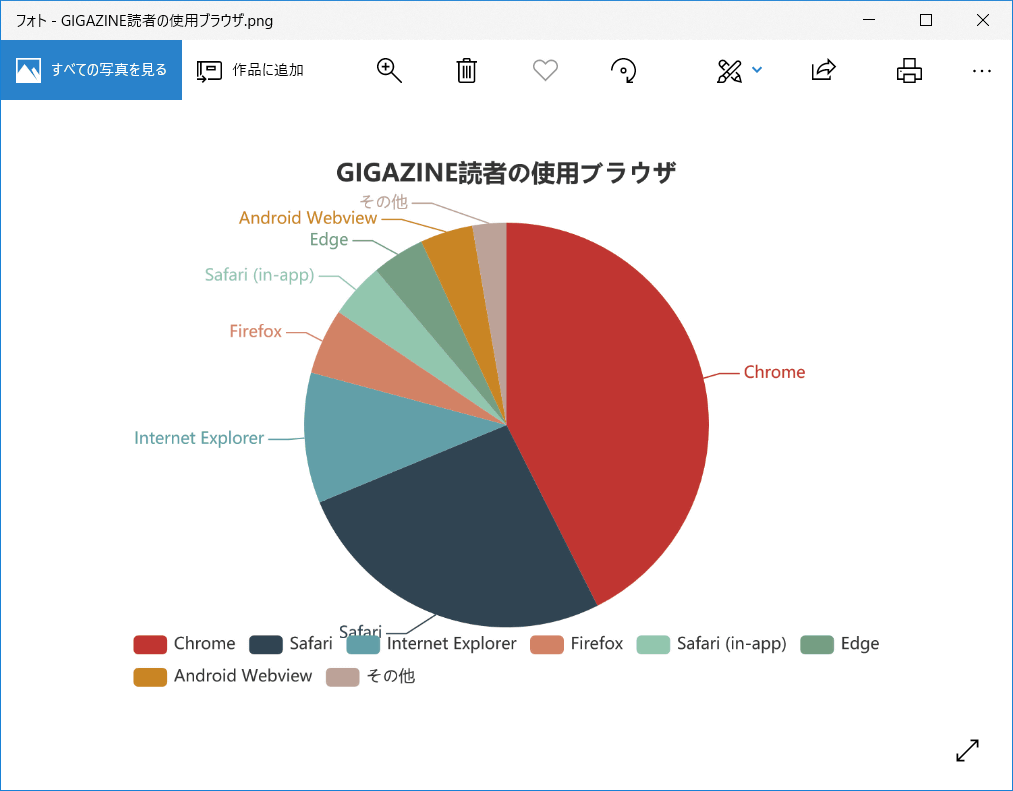
The graph actually downloaded was like this.
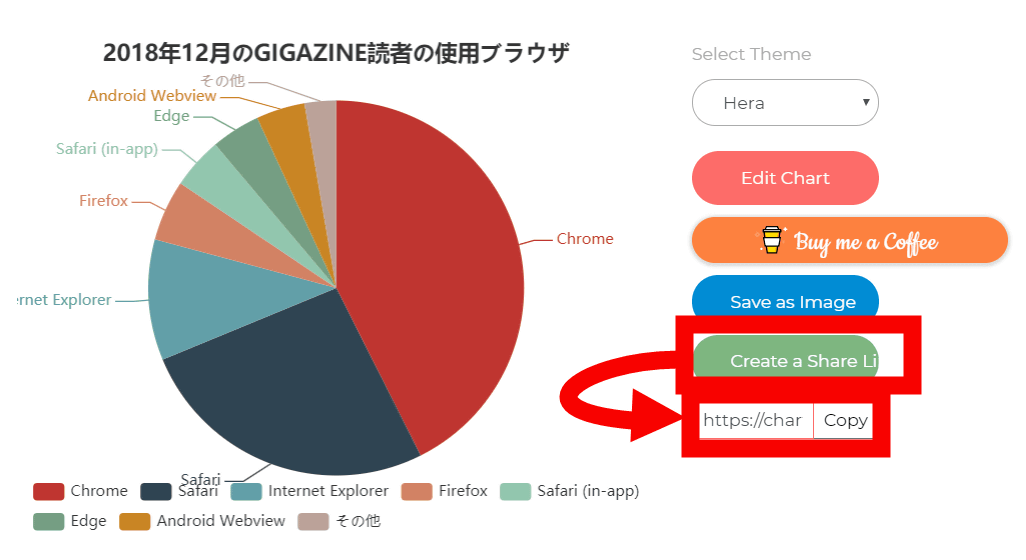
Click "Create a Share Link" to display the URL of the created graph. By sending this URL, other people can see the contents of the graph, but you can not reedit the graph displayed from the URL, only "Save as Image" function is available.
People who say "I do not know how to use graphs" is clicking on Example from the tab at the top ... ...
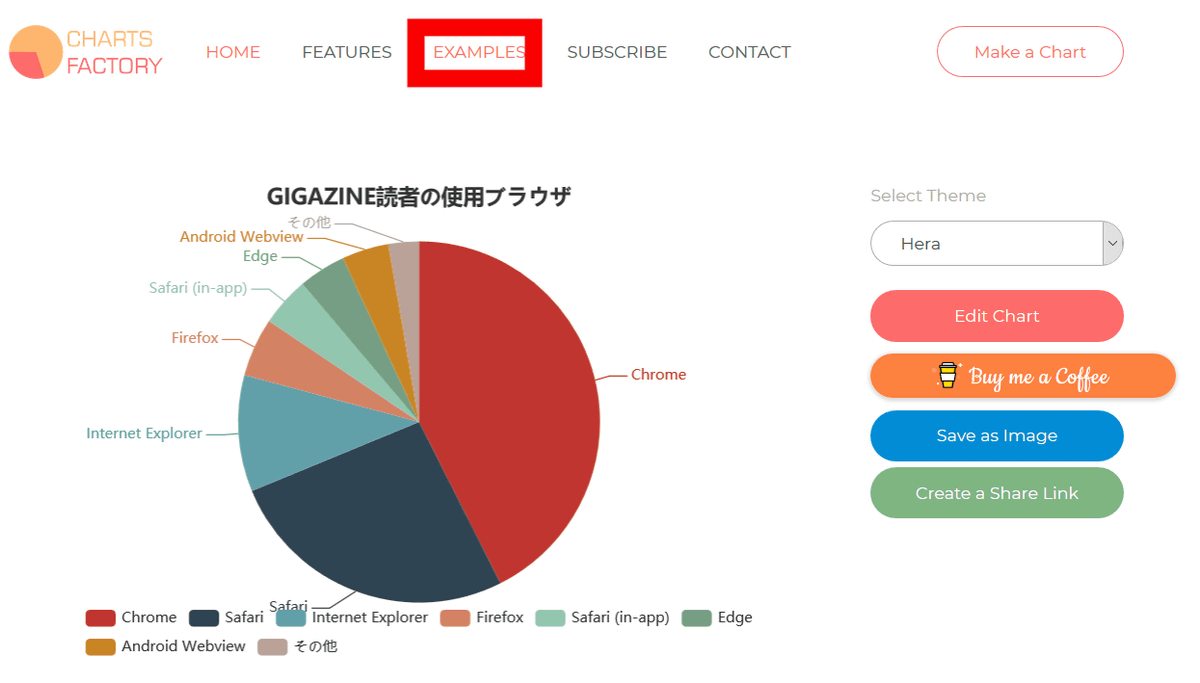
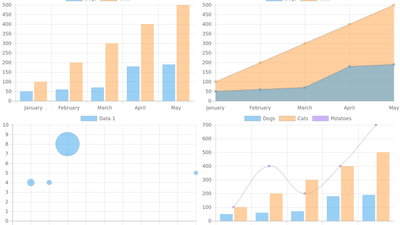
An application example of the graph is displayed.
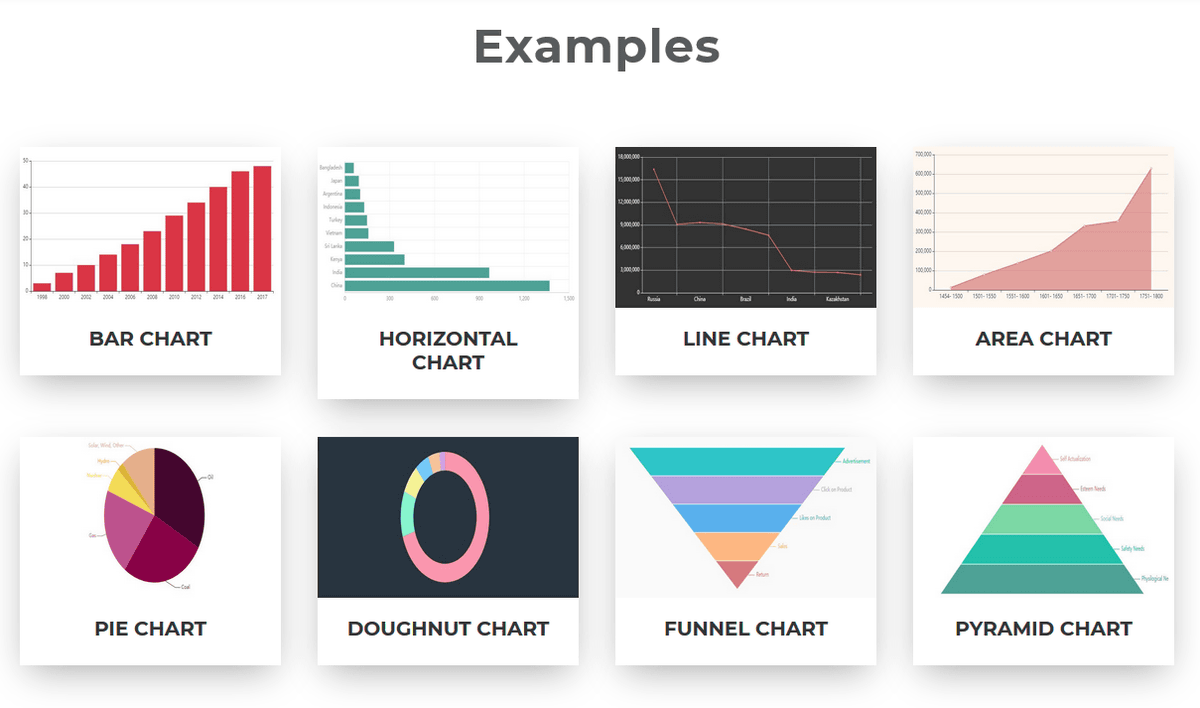
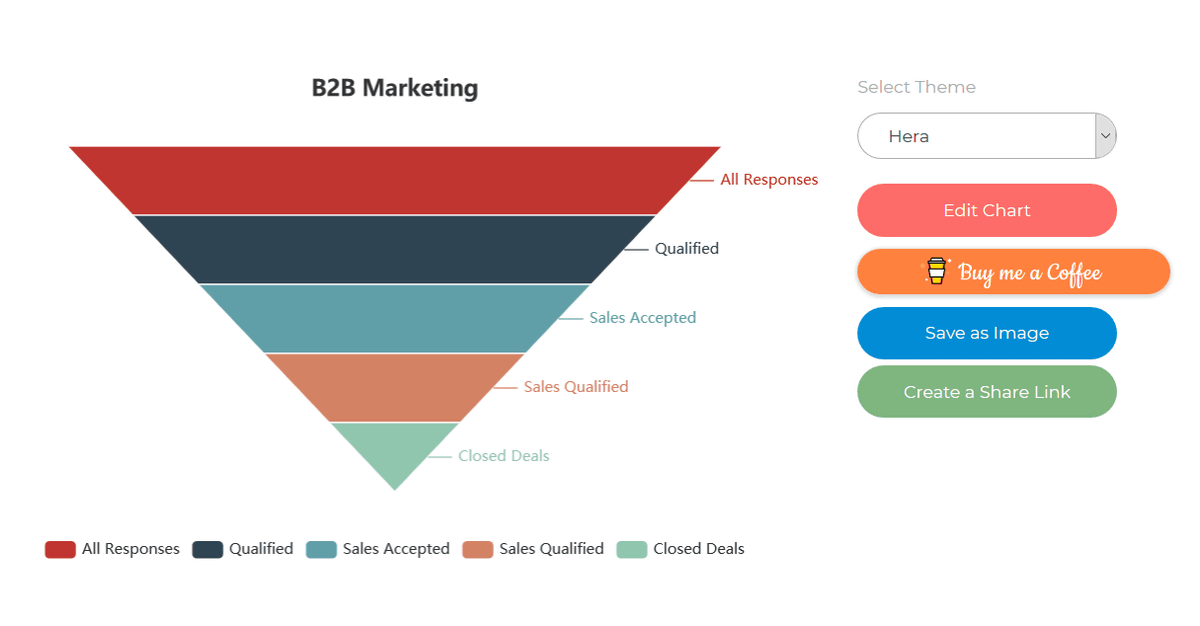
By clicking the application example, I was able to check the detail of the graph.
Related Posts:


in Web Service, Review, Web Application, Posted by darkhorse_log